
On Feb 16, the Litecoin price underwent a rapid price decrease. However, it is still trading above significant support areas and its long-term outlook remains bullish.
Cryptocurrency swing trader @PostyXBT posted a Litecoin chart showing that while the price was initially successful in breaking through resistance, the recent Bitcoin decrease caused it to fall right back through this area without validating it as support.
He believes that the long-term outlook is still bullish as long as the price does not reach a close below the recent higher low, which is found at $67.
Prime example of a set up being invalidated due to the recent blood.
Strong daily close above R, looking for a retest of S, dumps straight back through (fake out).
However, the macro bullish structure is still valid, unless we close below the higher low (red line). pic.twitter.com/N2WTpjz3uf
— Posty (@PostyXBT) February 17, 2020
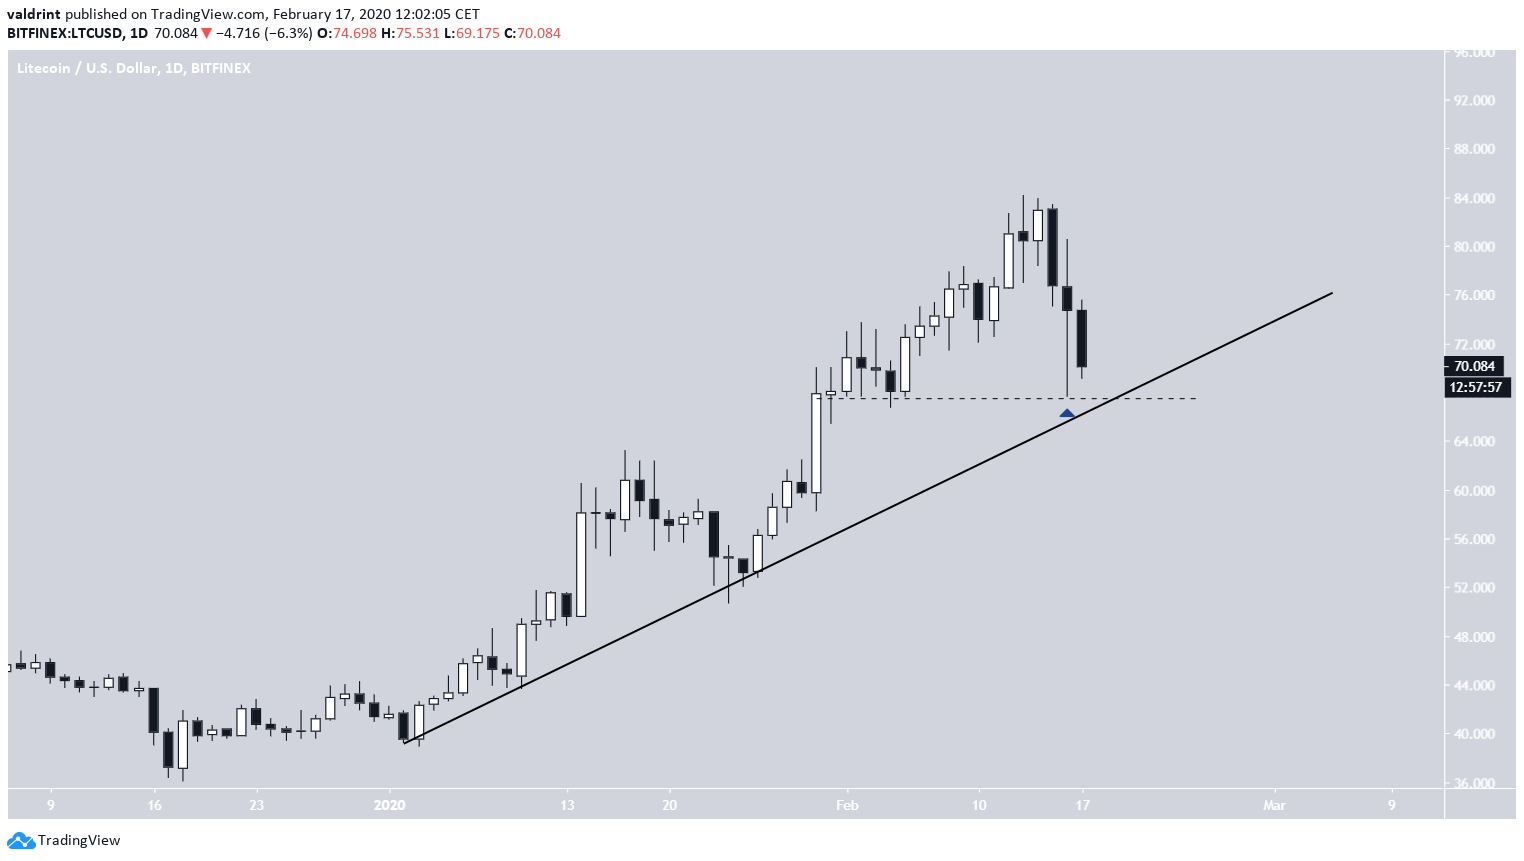
Ascending Support Line
The Litecoin price has been following an ascending support line since Jan 2. The line has been validated four times.
The $67 support level mentioned in the tweet fits in perfectly with this ascending support line. In addition, it was validated by the long lower wick of Feb 16.
So, at first glance, the hypothesis that the price is bullish as long as it stays above $67 seems correct.
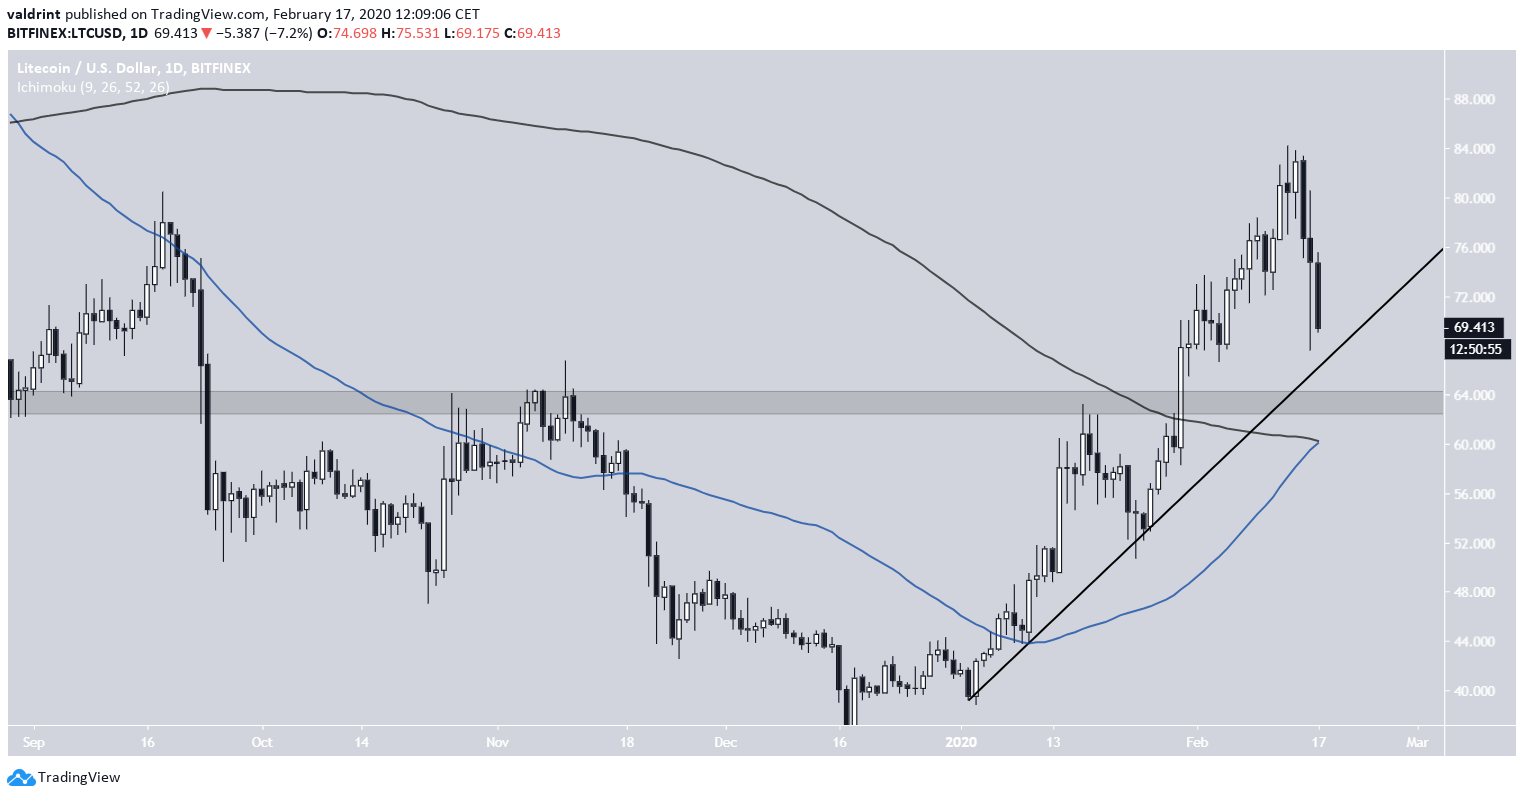
Zooming out slightly shows a major support area between $62-$64. This area has previously acted as both support and resistance and was the zone in which the price broke out on Jan 30 to accelerate the rate of increase.
If the price falls back to that range, it would likely struggle to make it back above the ascending support line. However, it should find support above the bullish cross between the 50 and 200-day moving averages (MA) that just transpired.
So, as long as the price is trading above $62, its long-term movement can still be considered bullish.
LTC/USD Highlights
- The price is following an ascending support line.
- A golden cross has just transpired.
- There is support at $67 and in the range of $62-$64.
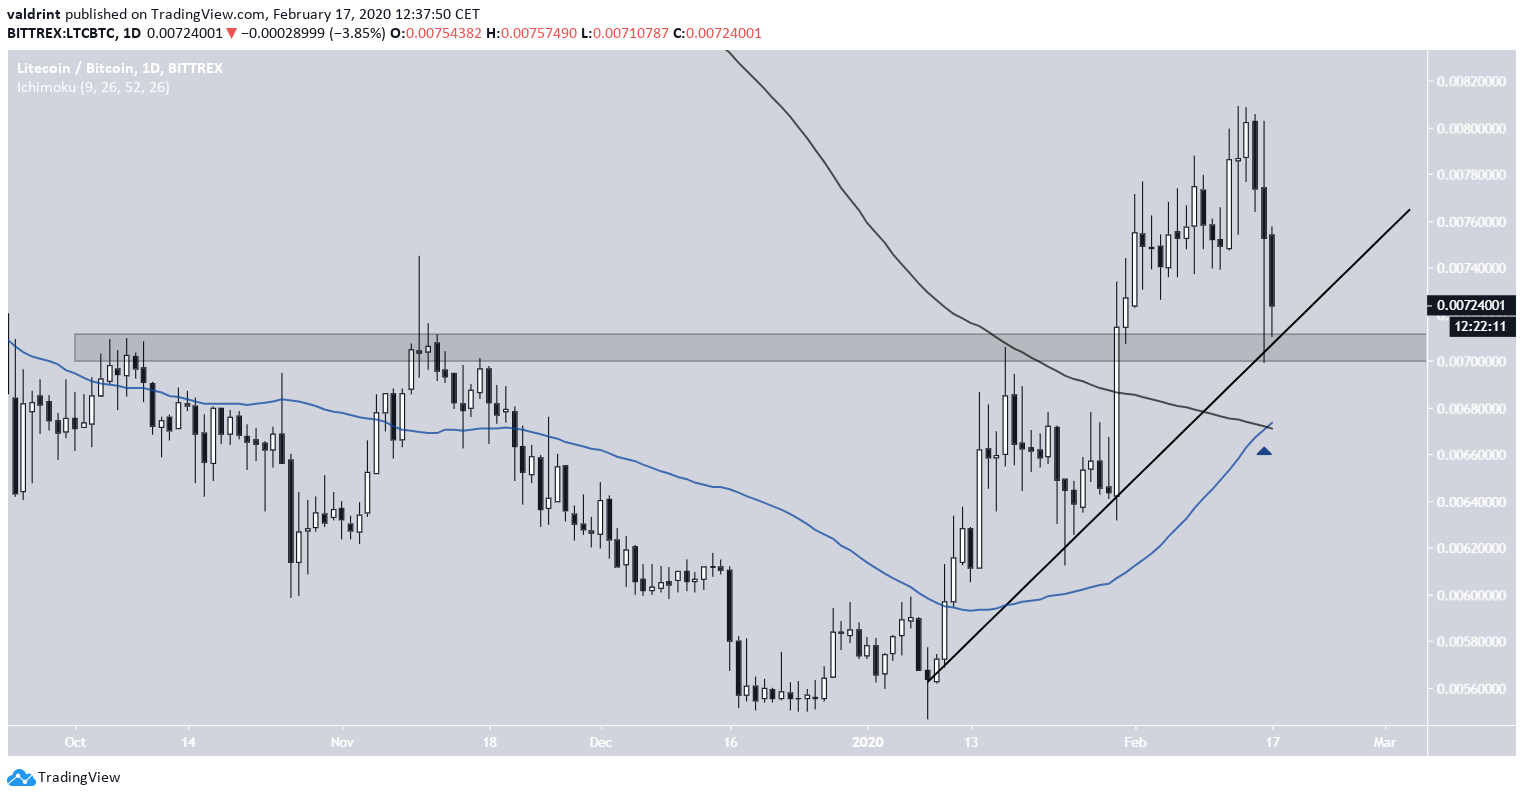
Litecoin/Bitcoin
Looking at the BTC pair, we can see a similar ascending support line in place. The price is currently right at this support line, having validated it with a long lower-wick twice.
The main support area is found at ₿0.007. Unlike the USD pair, the bullish cross between the 50 and 200-day MAs is right at this support area, along with the ascending support line.
Therefore, the LTC/BTC chart is more straightforward for trading purposes. As long as the price is above ₿0.007, its long-term movement is considered bullish.
LTC/BTC Highlights
- There is support at ₿0.007.
- The price is following an ascending support line.
- A golden cross has just transpired.
