


The Litecoin (LTC) price increased considerably during the week of Nov 15-22. The rate of increase has turned parabolic, and a short-term correction could occur.
In any event, the long-term trend remains bullish and LTC is likely to rally towards the resistance areas outlined below.
Weekly Rally
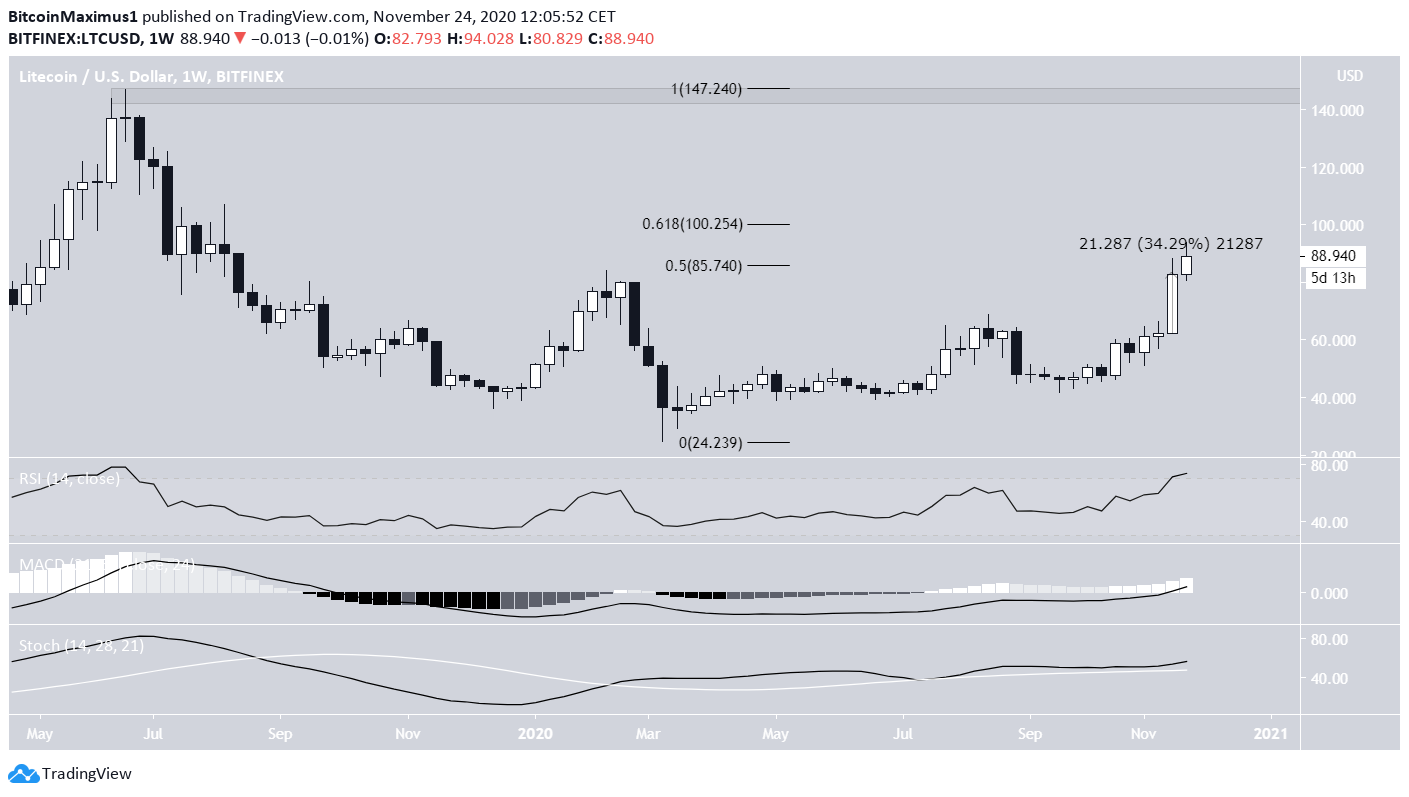
The LTC price increased by 34% during the week of Nov 15-22, reaching a high of $88.34. This has taken the price right to a significant resistance area between $86-$100, created by the 0.5 – 0.618 Fib retracement levels.
Technical indicators do not show any weakness yet since the RSI, MACD, and Stochastic readings are gradually increasing, even if the RSI is oversold.
The main resistance area created by the June 2019 highs is found near $147.
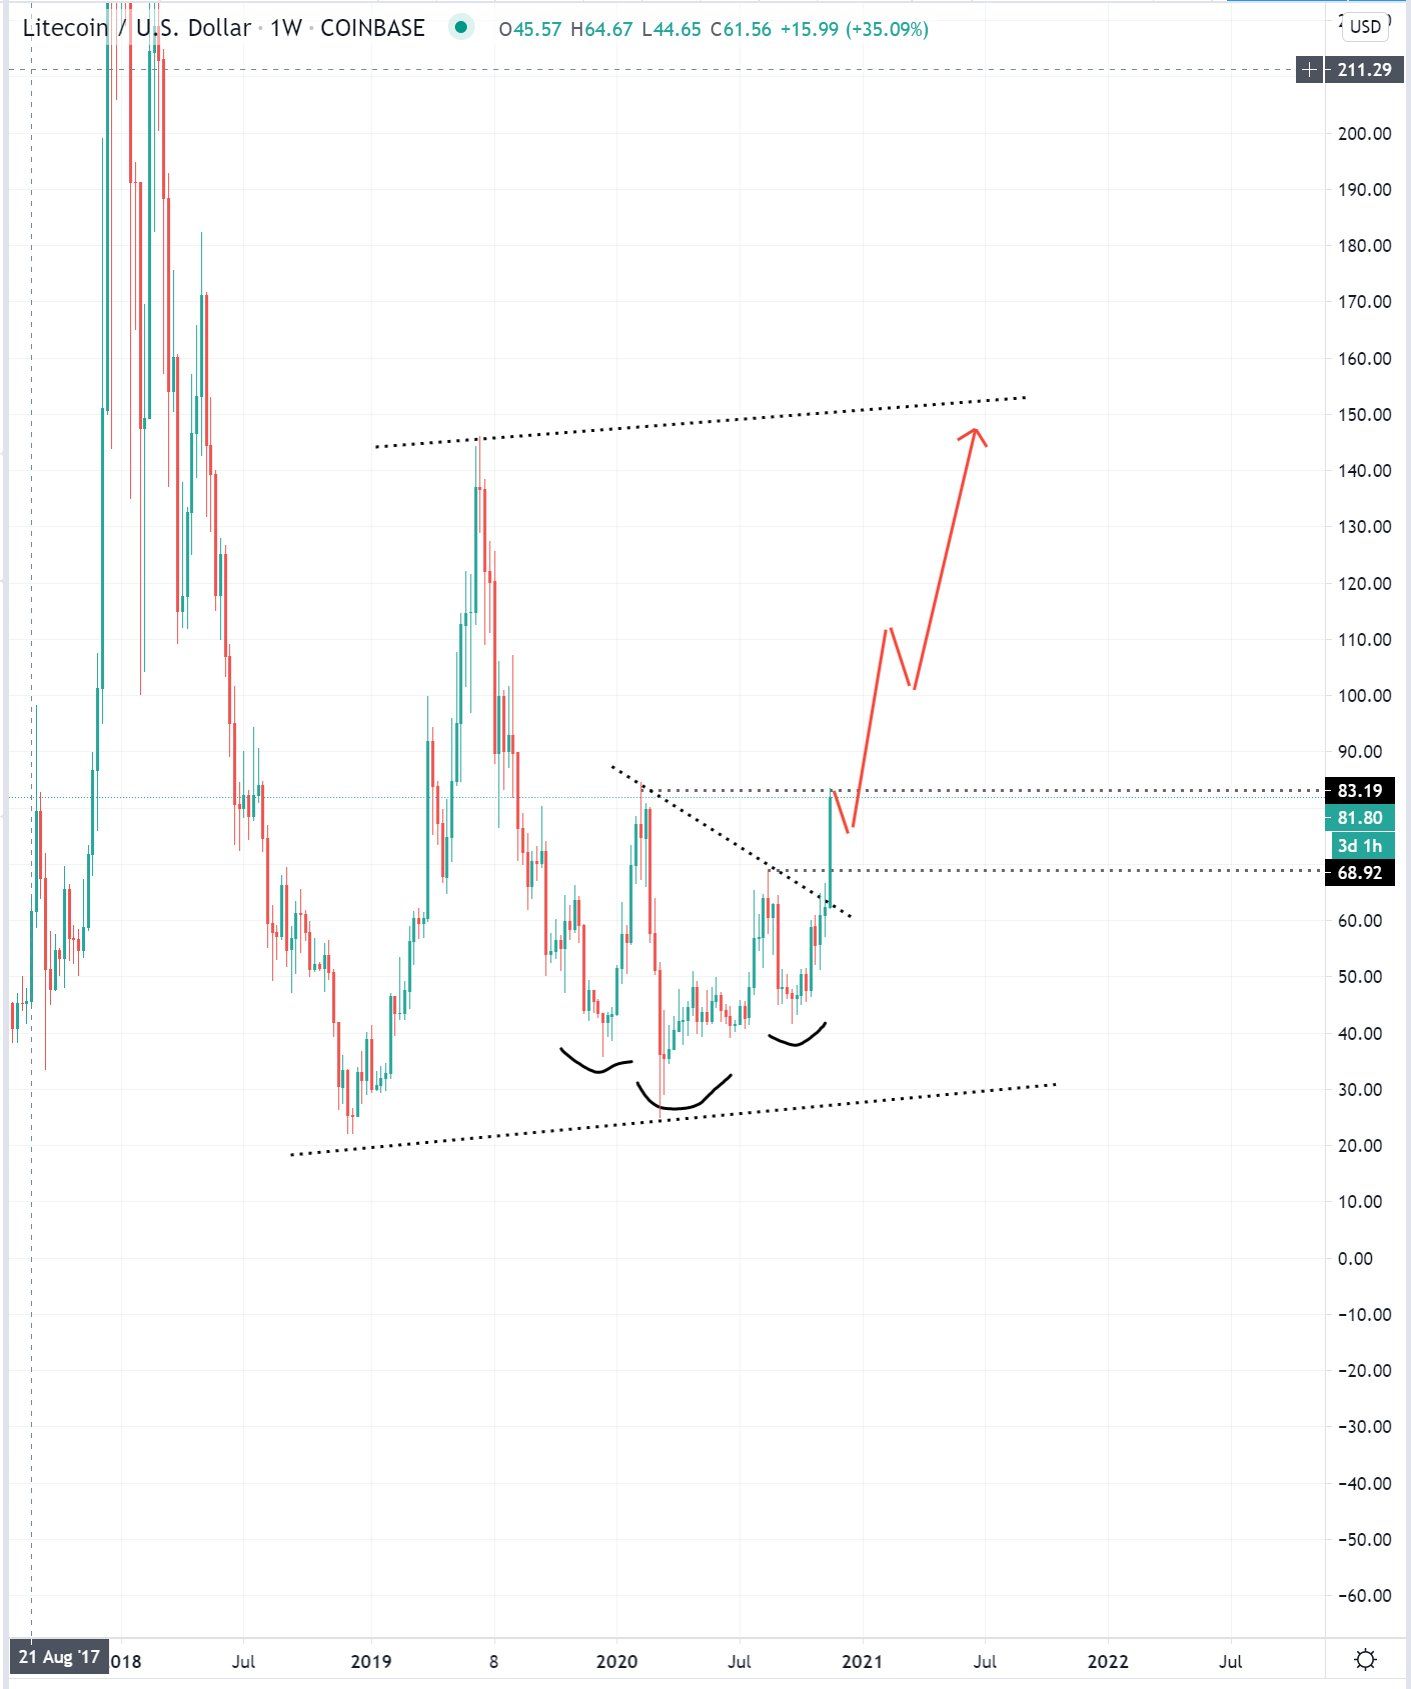
Cryptocurrency trader @Smartcontracter outlined an LTC chart, stating that the price will continue to rally and may lead the rest of the majors. He outlined a target near $150, close to the resistance area from June 2019.
To determine if the price will get there, a look at a lower time-frame and technical indicators is required.
Future Movement
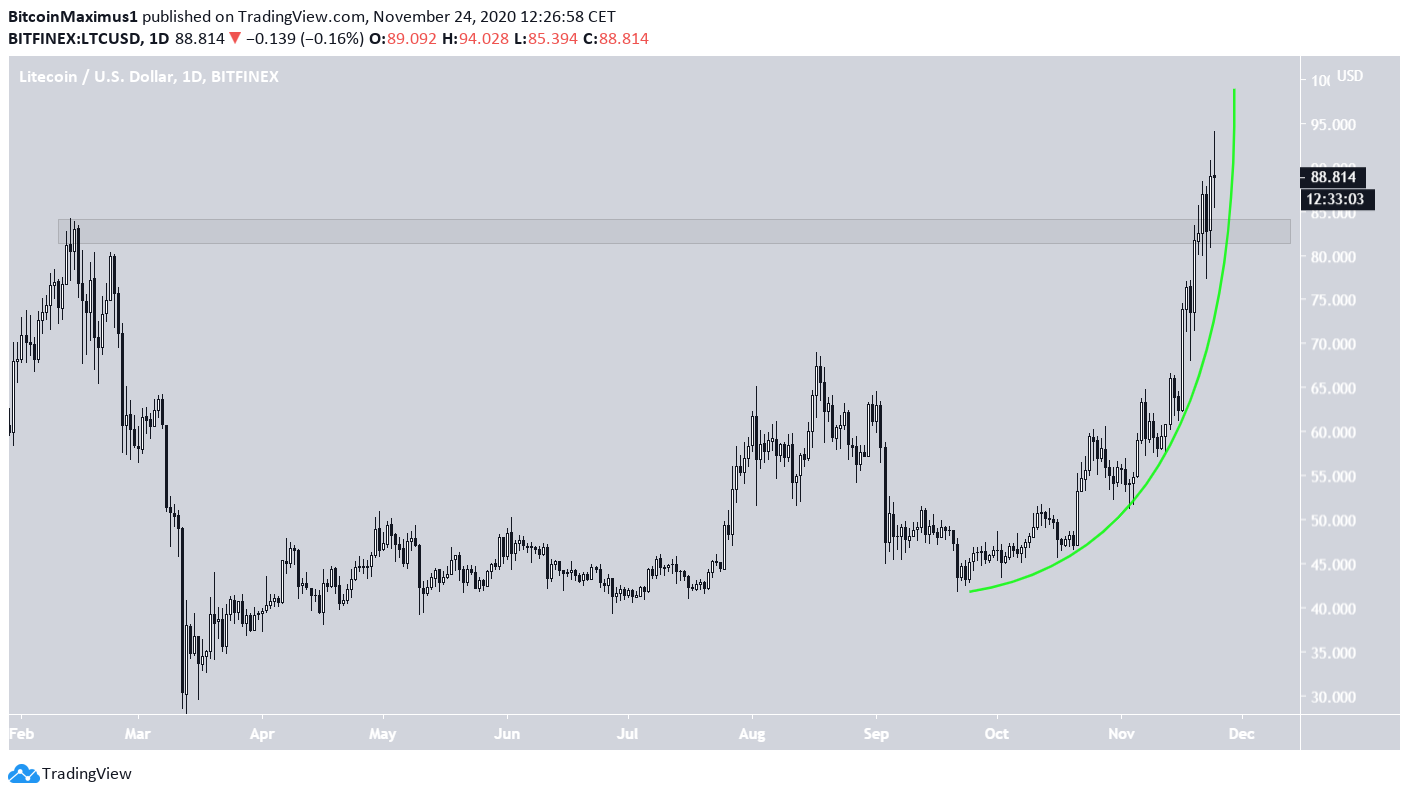
The daily chart shows that although the price has seemingly broken out from the $85 level, it is also following a parabolic ascending support line, which is unsustainable in the long-term.
However, as long as the price is trading above this line, it should continue moving upwards.
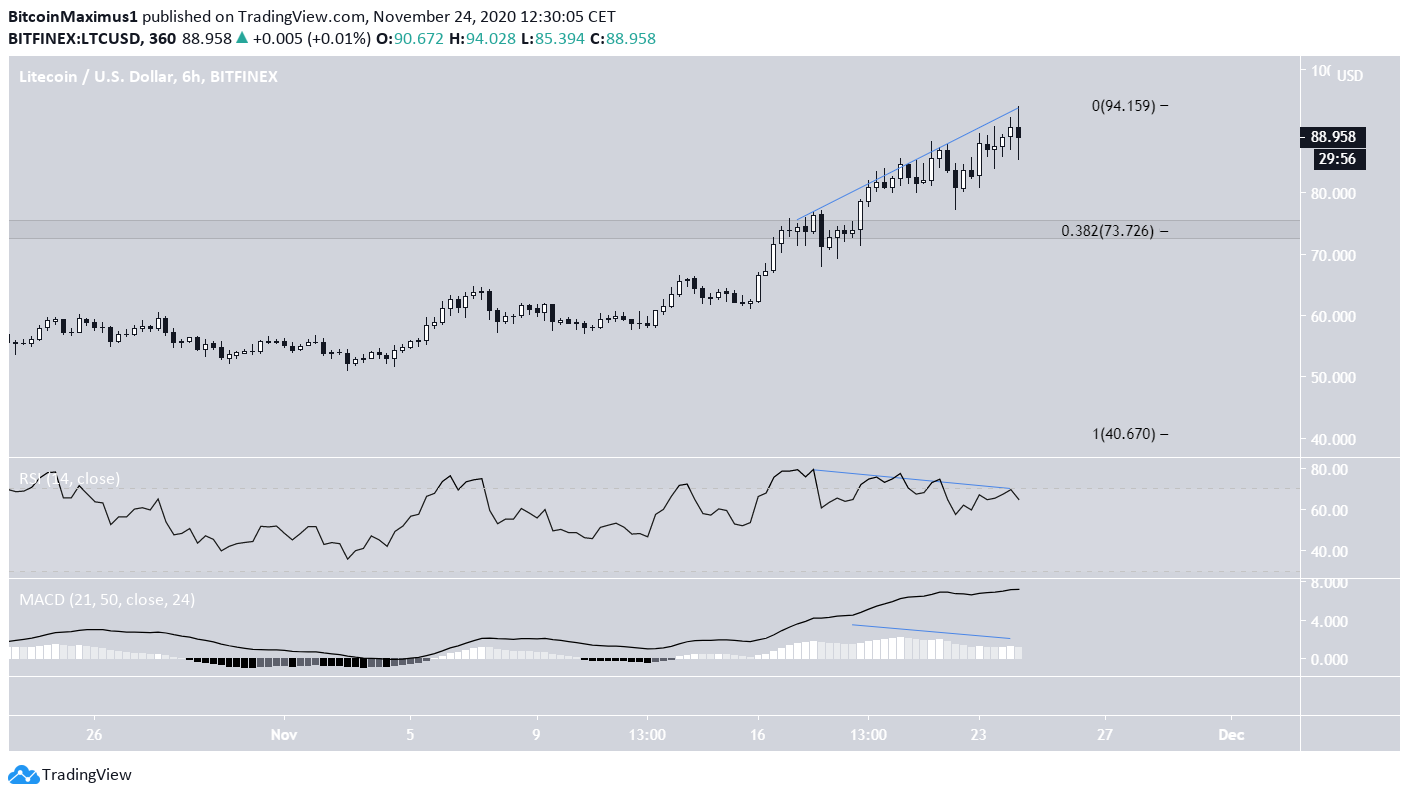
The six-hour chart shows the first signs of weakness, in the form of bearish divergence in the RSI.
Therefore, it would make sense for a small retracement to occur first, possibly towards the 0.382 fib level at $73, before the price eventually continues moving upward.
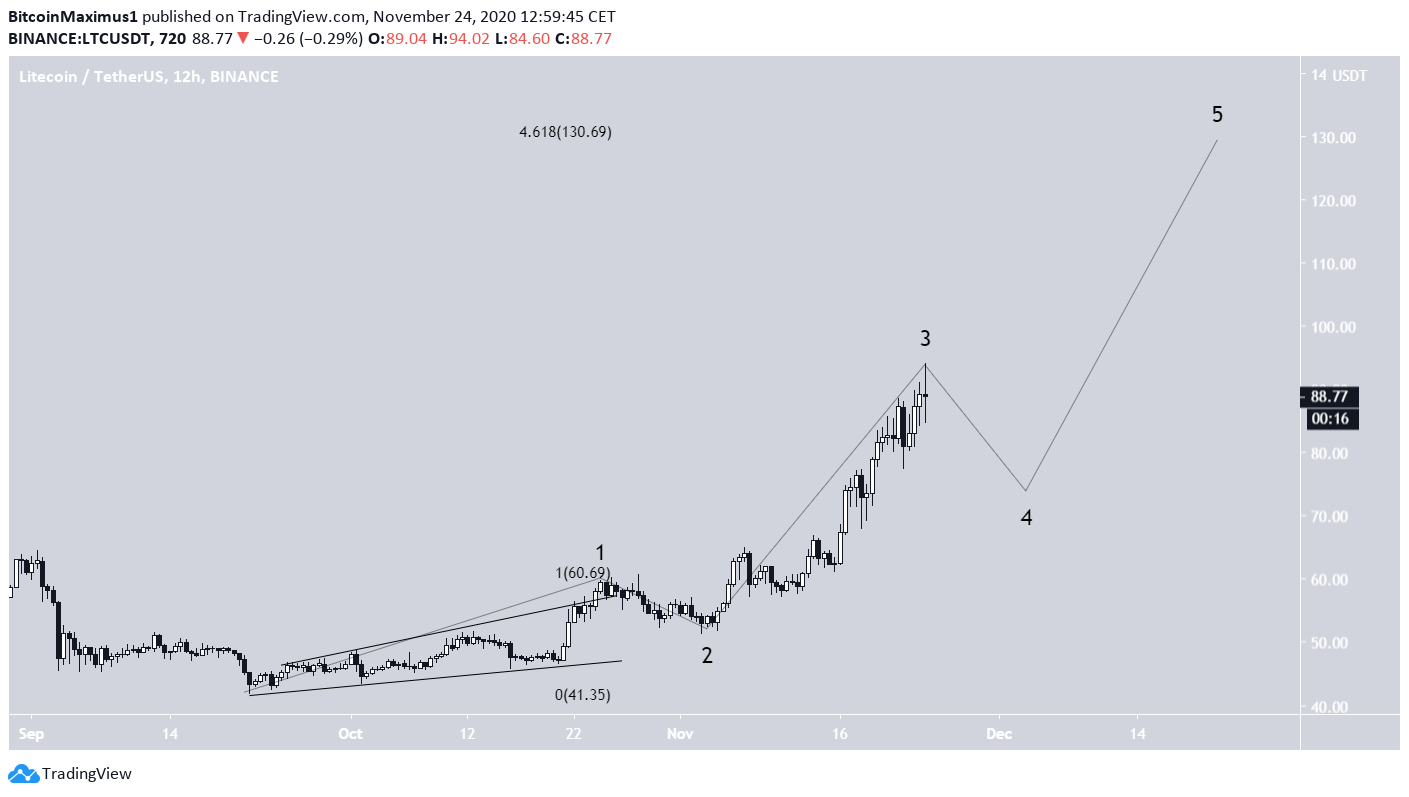
Wave Count
On Sept 21, the LTC price seems to have begun a bullish impulse (shown in black below), currently trading near the top of wave three.
A possible wave four correction also fits with the bearish divergence outlined previously.
A possible target for the top of the move would be near $130, the 4.16 Fib extension of wave one. However, this is a preliminary target, since wave four has not yet begun. A more accurate target will emerge once wave four is complete.
Conclusion
To conclude, the LTC price should eventually reach the $140 resistance area. The short-term rate of increase is unsustainable and a small correction is expected before LTC resumes its upward move.
For BeInCrypto’s previous Bitcoin analysis, click here!
Disclaimer: Cryptocurrency trading carries a high level of risk and may not be suitable for all investors. The views expressed in this article do not reflect those of BeInCrypto


