![Will Komodo Reach 12,000 Satoshis? [Premium Analysis]](/_mfes/post/_next/image/?url=https%3A%2F%2Fassets.beincrypto.com%2Fimg%2FYb44nD4Kxsf9YokRvIbuFUGDwpc%3D%2Fsmart%2Fd752919c2c67488bb00cd50f9554f9db&w=1920&q=75)
The Komodo price has been decreasing since reaching a high on November 18. It is currently attempting to find support above 8500 satoshis and initiate another upward wave.
The Komodo price reached a low on October 25 and began an upward move. The rate of increase intensified in November — causing the price to break out.
Full-time trader @cryptoMichNL stated that, after breaking out, the Komodo price is retesting a previous resistance area and is in the process of validating it as support. If it does, it can continue moving upwards towards 12,000 satoshis.
This area here is finally being retested, which would give a beneficial long entry.
If green holds, then targets of 1200 can be reached here. pic.twitter.com/8ZhfZft4wf
— Michaël van de Poppe (@CryptoMichNL) December 9, 2019
Current Komodo Trading Range
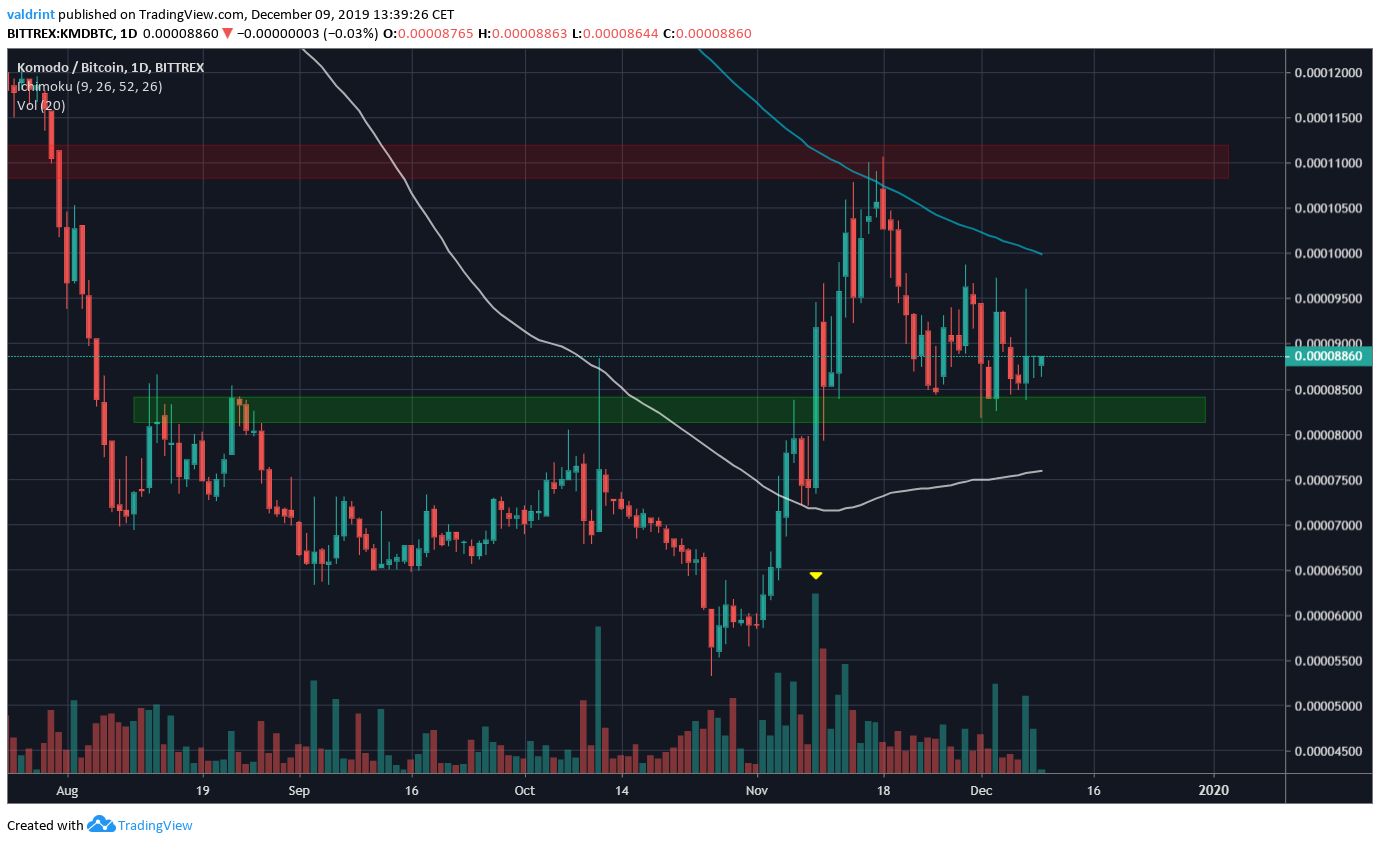
The Komodo price reached a low of 5330 satoshis on October 26. Afterward, it broke out of the previous resistance area at 8200 satoshis and reached a high of 11,067 satoshis before decreasing towards pre-breakout levels.
The Komodo price validated the support area twice on December 8. Therefore, it is likely trading in a range between 8300 and 11,000 satoshis. This trading range is supported by the fact that the price is trading between the 100- and 200-day moving averages (MAs), having found support above the former and resistance below the latter.
Double Bottom
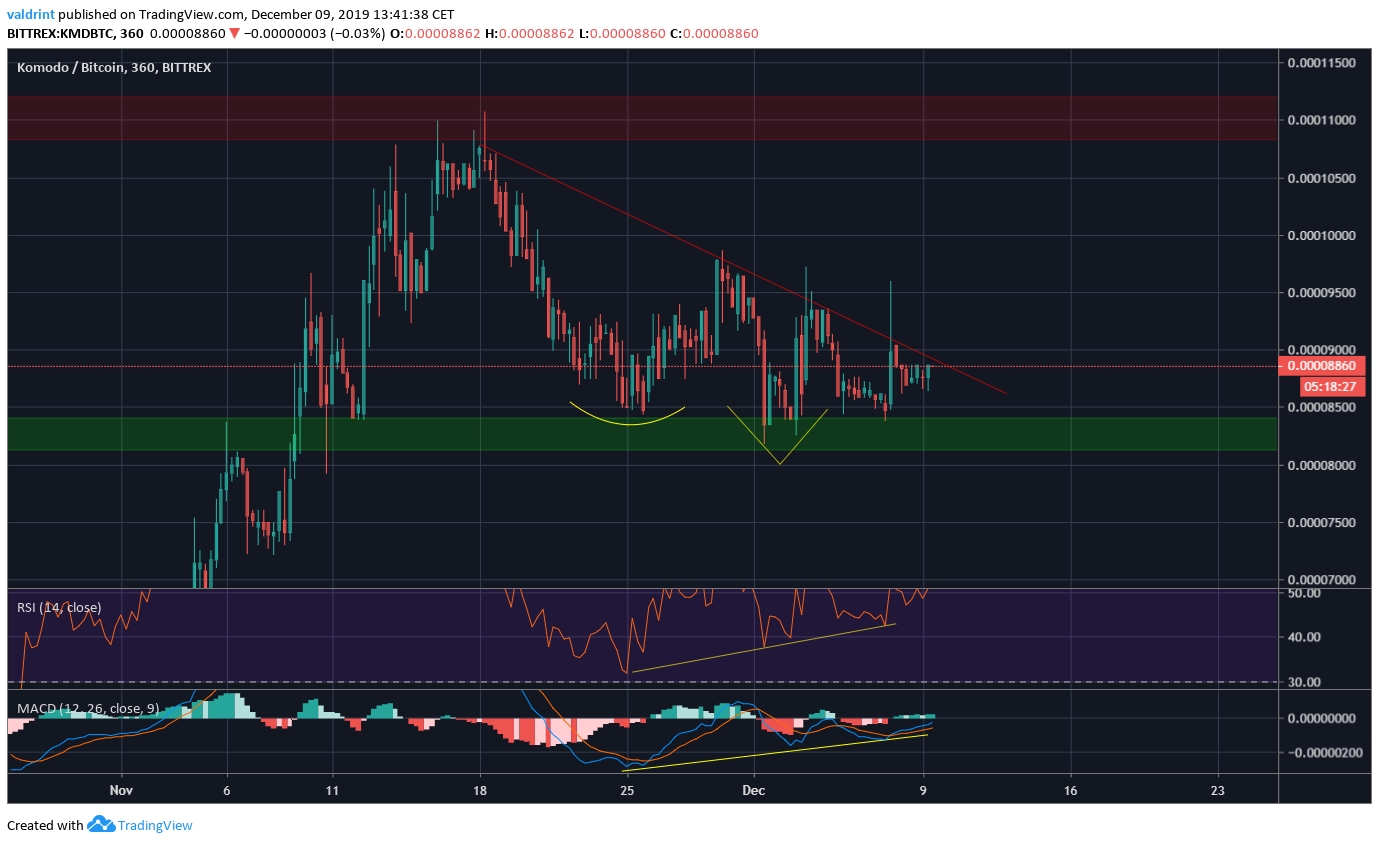
In the short-term, the Komodo price has made a double bottom inside the aforementioned support area. There is a developing bullish divergence in both the RSI & the MACD. This suggests that a breakout is near.
Additionally, there is a descending resistance line in place since November 18. If the Komodo price breaks out of it, it will likely head towards the resistance area at 11,000 satoshis and make another breakout attempt.
Future Movement
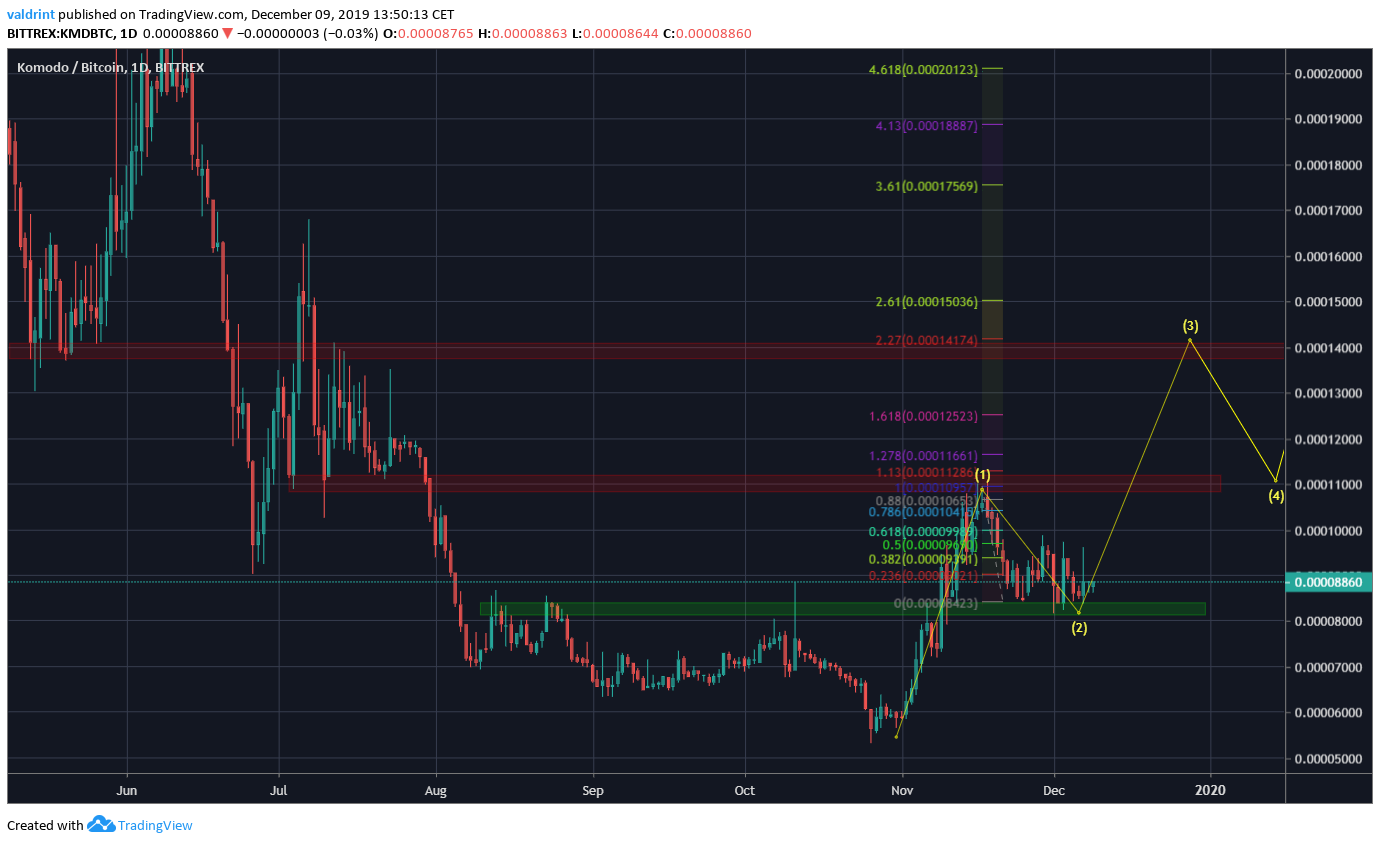
If the Komodo price continues its upward movement and breaks out of the resistance, it is likely to reach the target at 14,000 satoshis. In that scenario, this would constitute the third upward wave of five wave Elliott formation.
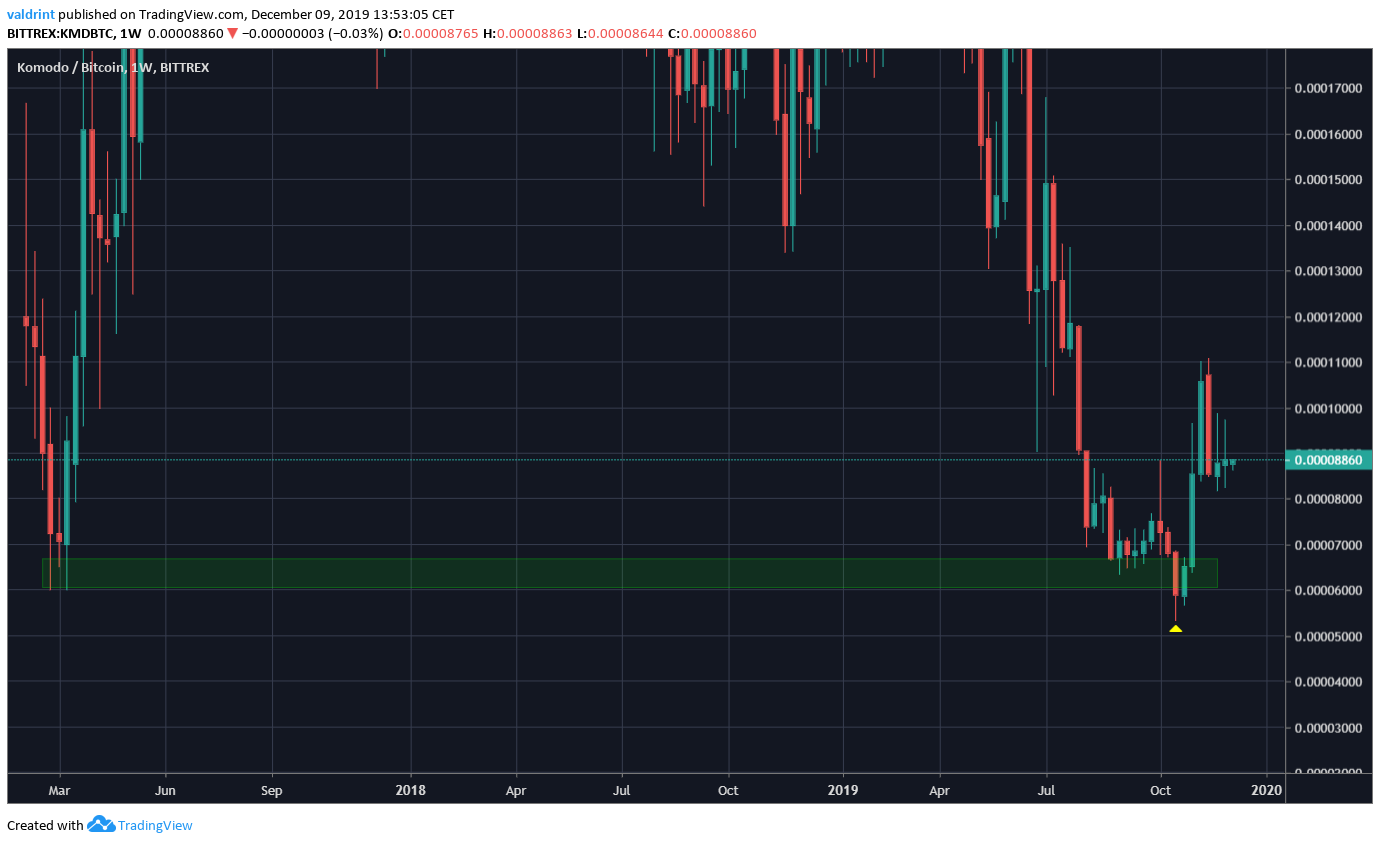
One reason to think the Komodo price will do so is the all-time chart. The price reached an all-time low in October 2019, breaking down below the final support area. However, the lower levels could not be sustained and Komodo immediately moved upward. This is often a sign that a reversal has occurred.
To conclude, the Komodo price has broken out above the previous resistance area and is in the process of validating it as support. If successful, we are expecting to see a continued upward movement.
