
The Graph (GRT) has been decreasing since reaching an all-time high price of $3.88 on Feb. 12.
Despite the ongoing decrease, GRT has broken out from a descending wedge. It has likely begun an upward movement which could potentially take it all the way to $4.
Descending Wedge
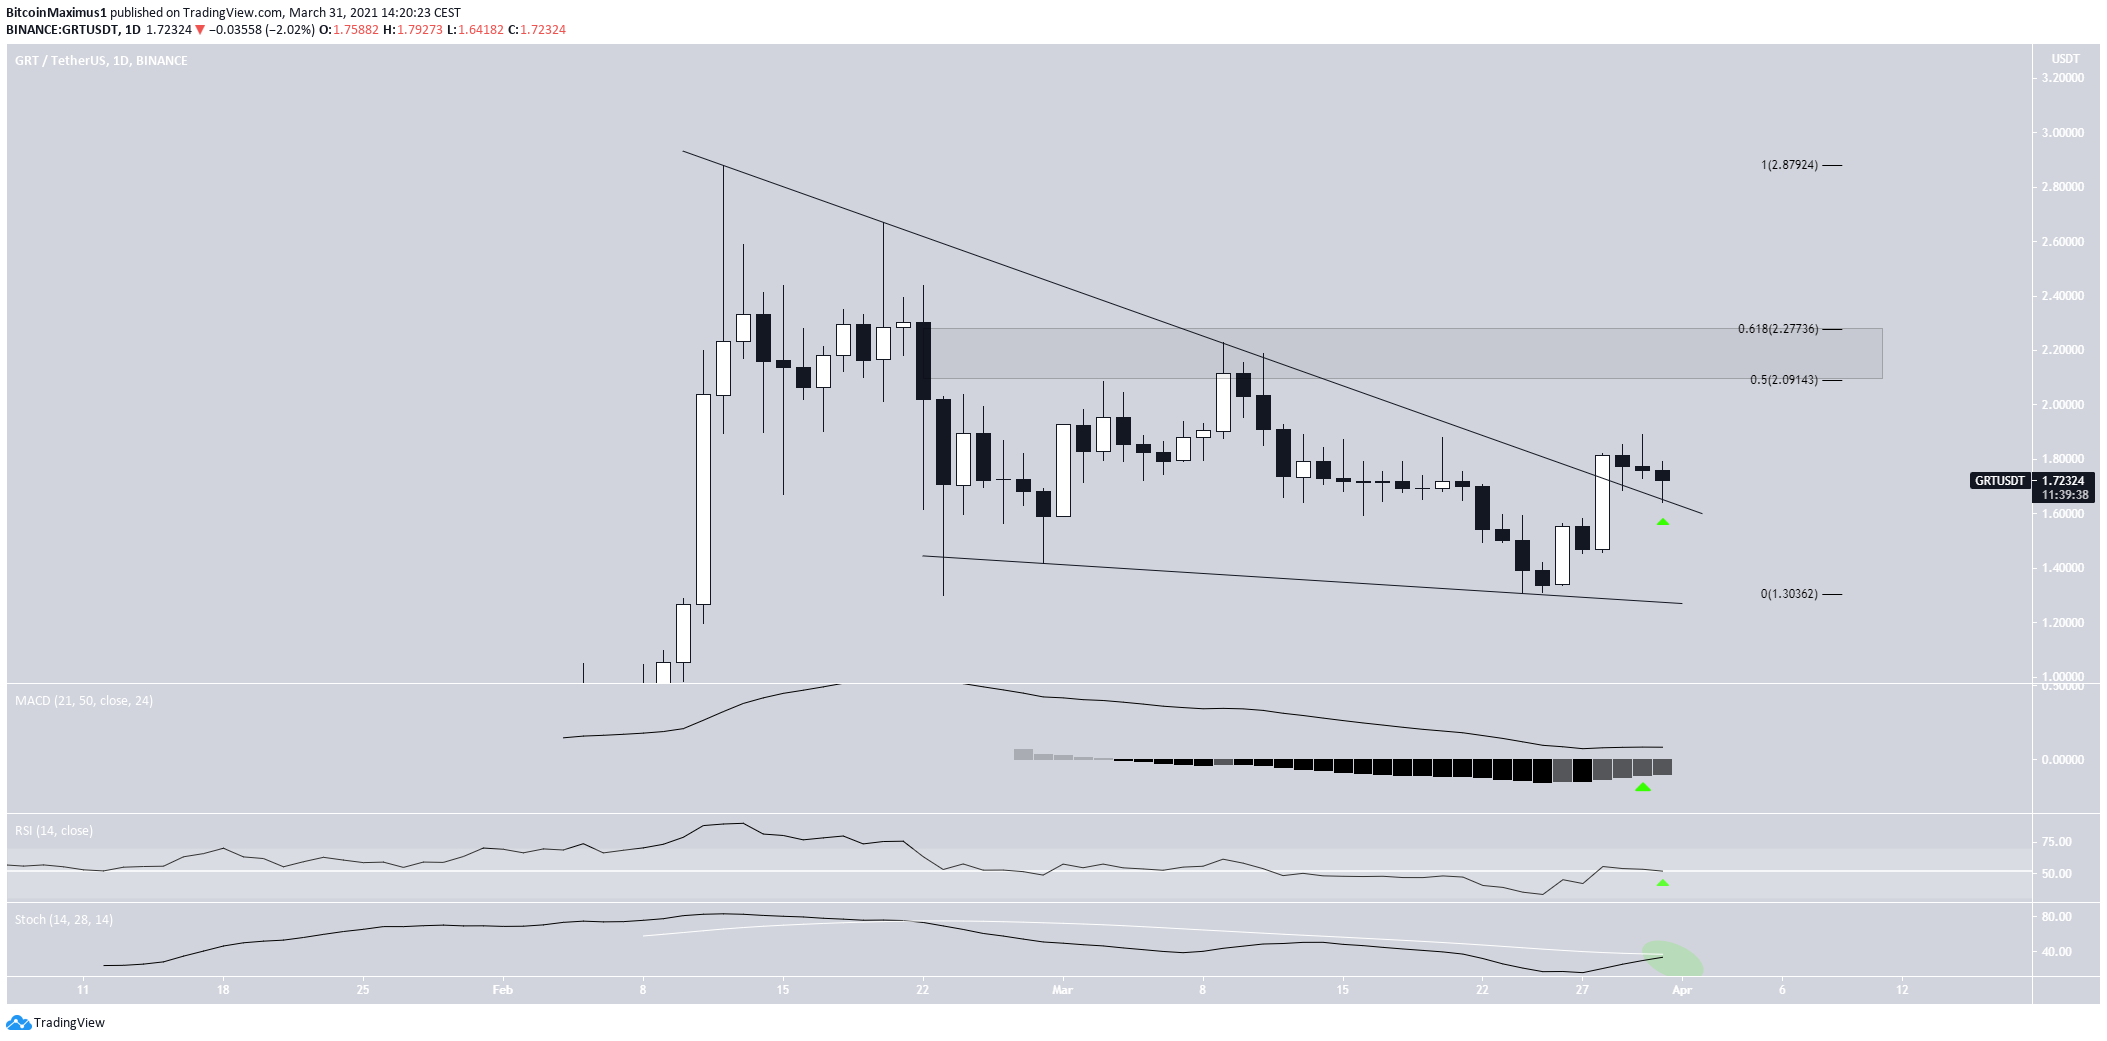
GRT has been moving downwards since Feb. 12, when it reached an all-time high price of $3.88. However, the decrease took the shape of a descending wedge, which is considered a bullish reversal pattern.
On March 28, it managed to break out from this pattern. Currently, it is in the process of re-testing the resistance line as support.
Technical indicators have also turned bullish.
The MACD has given a bullish reversal signal. The RSI has crossed above 50. The Stochastic oscillator is in the process of making a bullish cross.
The main resistance area is found at $2.09-$2.27. This is created by the 0.5-0.618 Fib retracement levels of the entire downward move.
Afterward, the next resistance would be found at the all-time high price near $3.
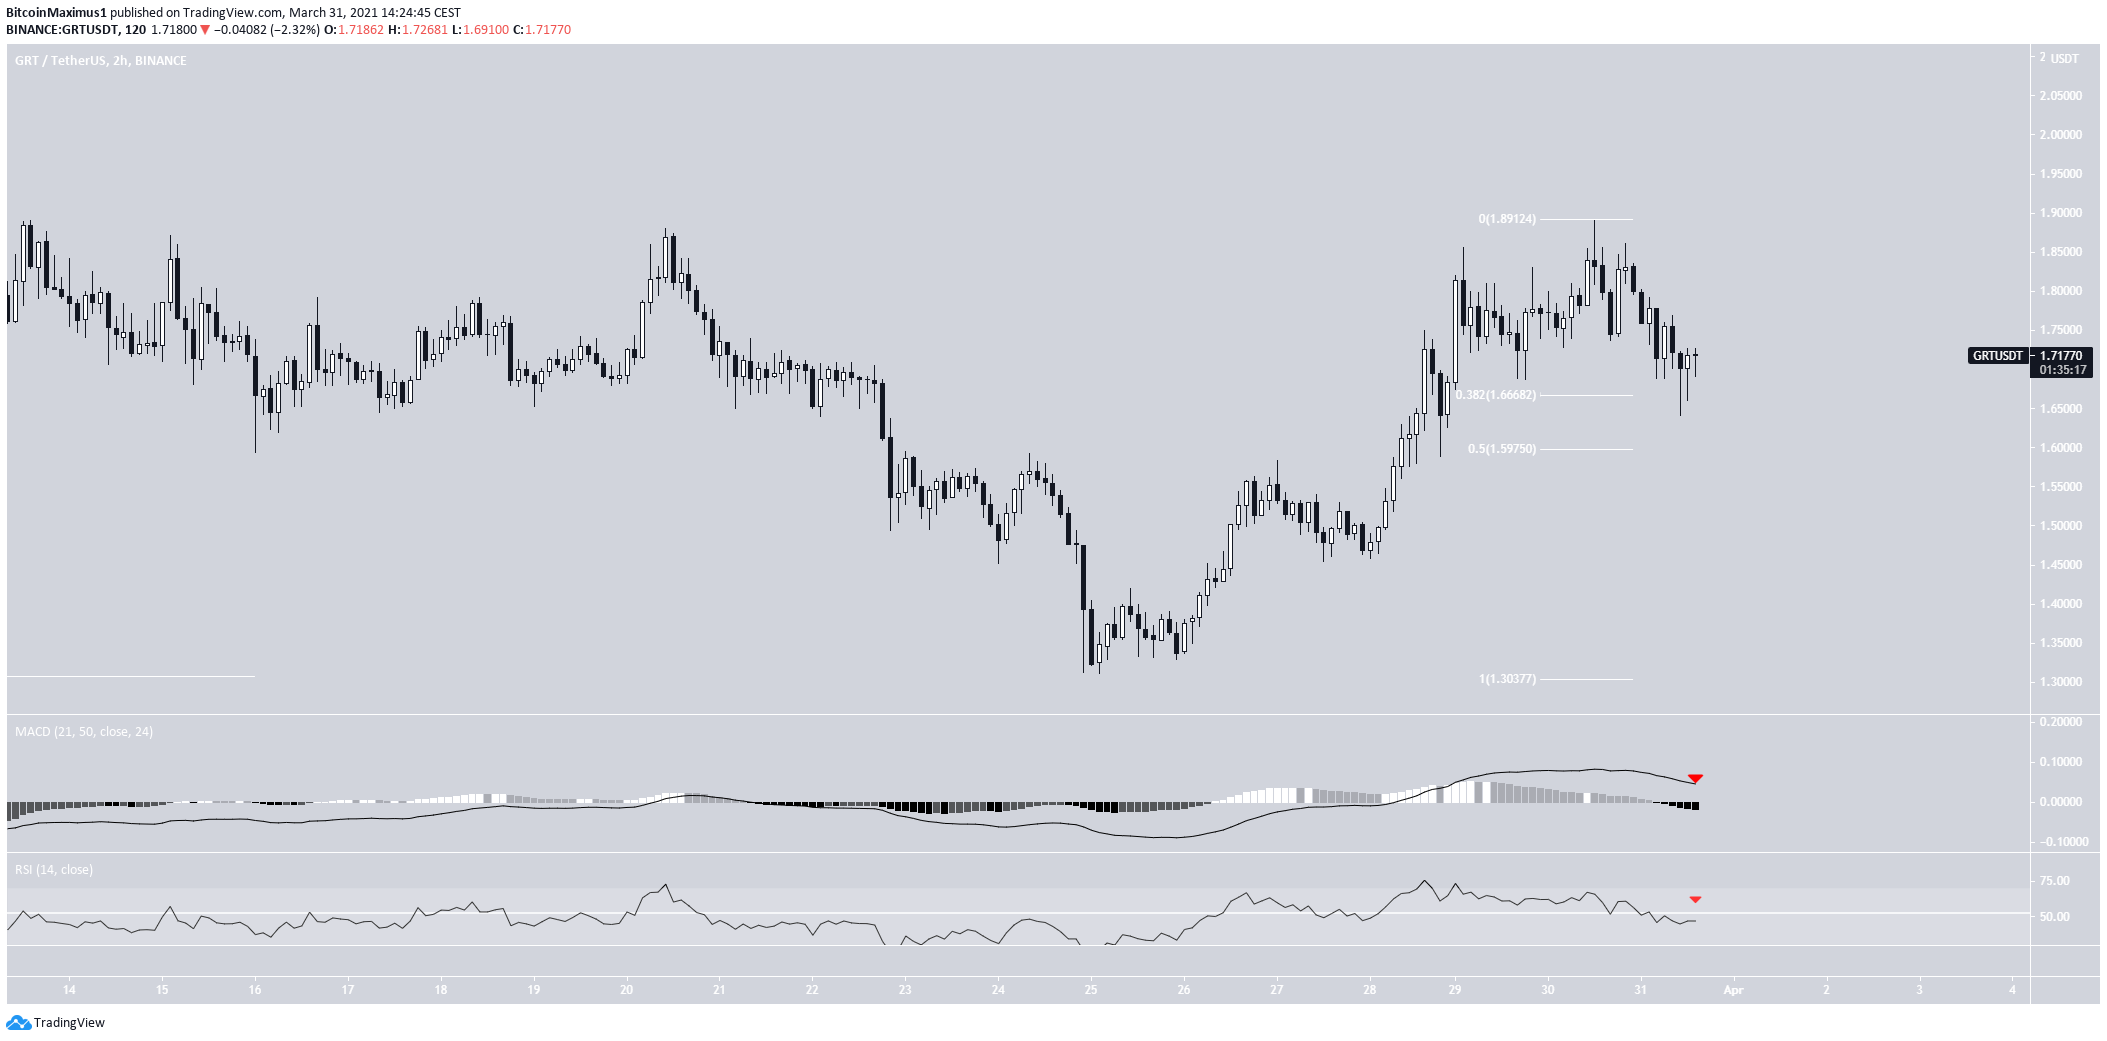
The shorter-term two-hour chart shows that GRT is currently retracing after the breakout.
While it has bounced at the 0.382 Fib retracement support, technical indicators are bearish.
Therefore, GRT may drop to the 0.5 Fib retracement support at $1.59 or slightly lower before resuming its upward movement.
Future GRT Movement
Cryptocurrency trader @Thebull_Crypto outlined a GRT chart, stating that it has already broken out from a descending wedge.
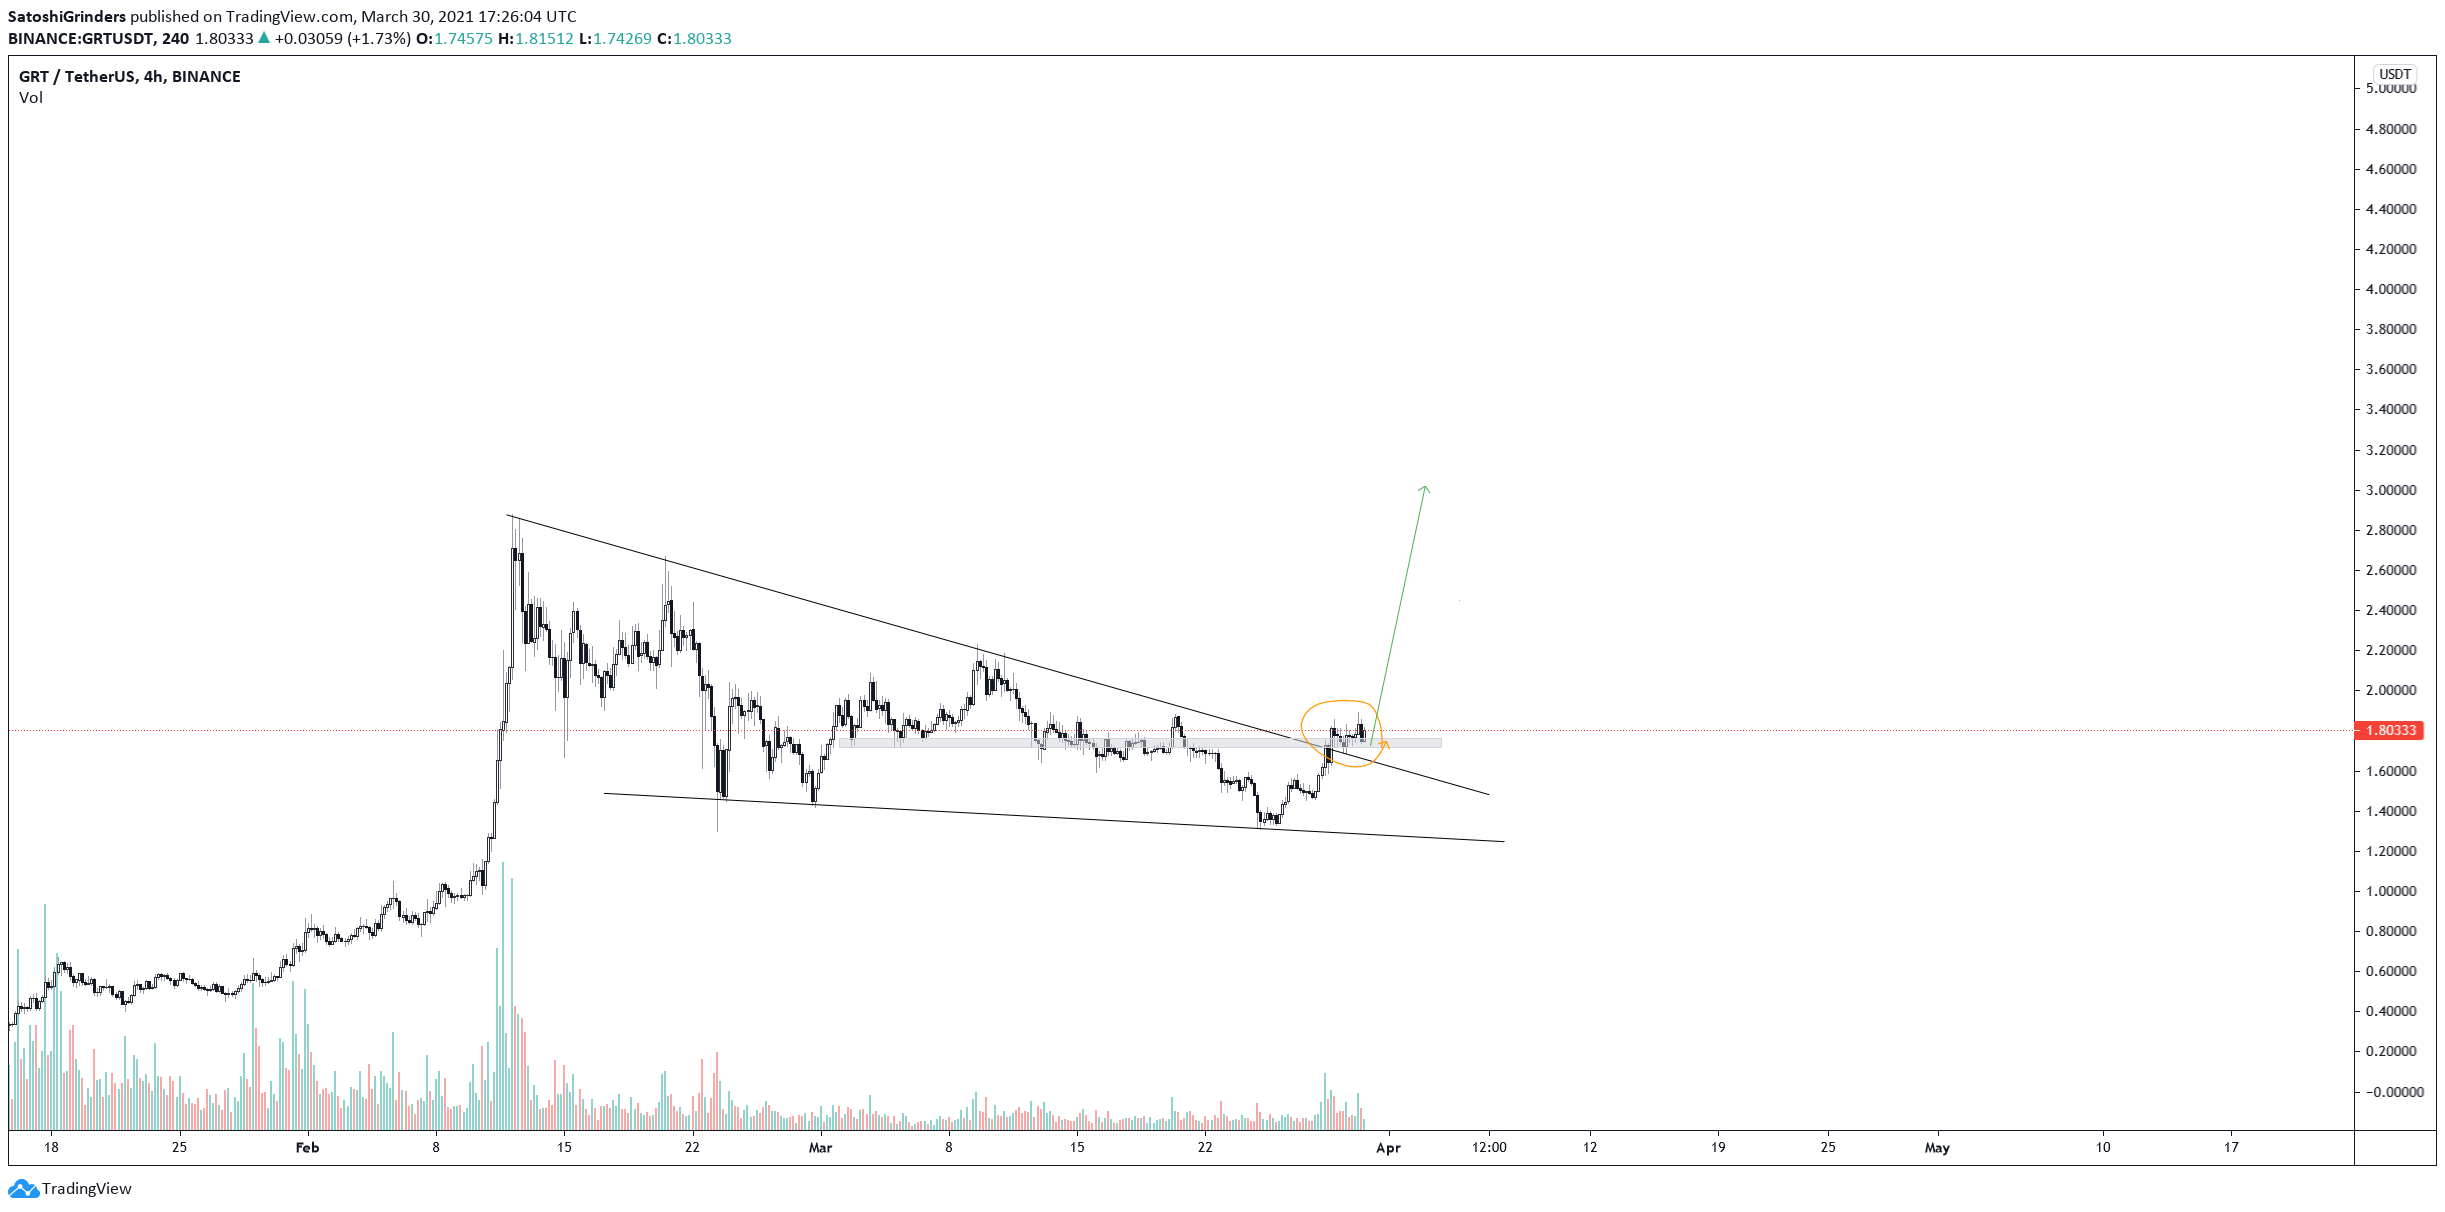
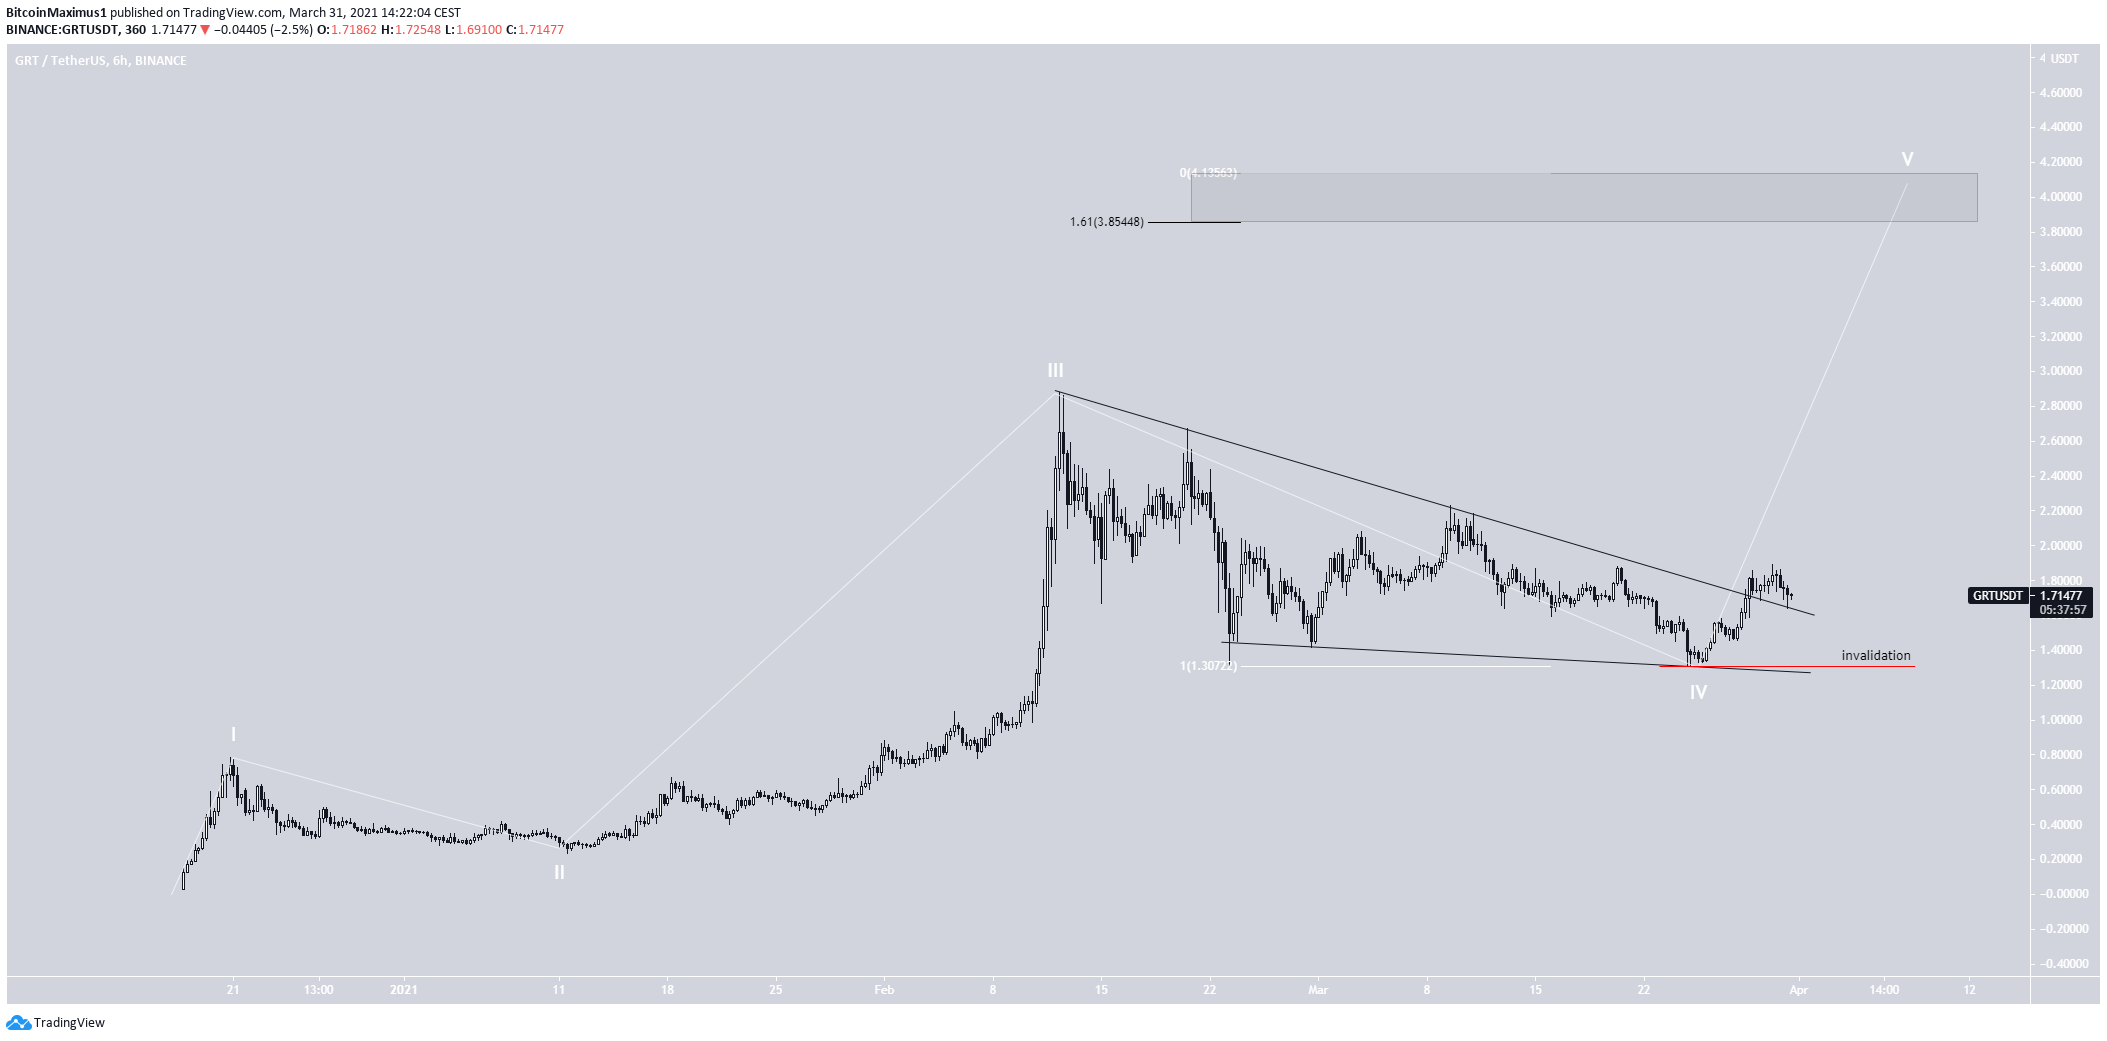
Additionally, the wave count suggests that the token has just begun wave five (white) of a bullish impulse.
The most likely target for the top of the move is found between $3.85 and $4.13.
The target is found using an external retracement on wave four (black fib) and a Fib projection on waves 1-3 (white fib).
Conclusion
To conclude, GRT has broken out from a descending wedge and potentially begun a bullish impulse. A possible target for the top of the upward movement is found near $4.
For BeInCrypto’s latest bitcoin (BTC) analysis, click here.
