
The Ethereum price has reached a significant resistance level, a breakout above which could indicate that the price has begun an upward trend.
On December 17, the Ethereum price broke down below a significant support area and, at the time of writing, was trying to reclaim it.
Cryptocurrency trader and market analyst Bitcoin Jack (@BTC_JackSparrow) outlined this movement, stating that the Ethereum price has reached a make or break level since it is attempting to reclaim the previous breakdown level. If this movement is not successful, it would be considered a bearish retest.
Make or break for $ETH really pic.twitter.com/e6xnfEUwvG
— //Bitcoin 𝕵ack 🐐 (@BTC_JackSparrow) January 7, 2020
Will Ethereum be successful in reclaiming this level, or will it continue moving downward? Keep reading below to find out.
Significant Levels
The ETH price began an upward move on September 6. The move ended on October 9, and the price has been decreasing since. Afterward, Ethereum reached the support area at ₿0.0172 and began the current upward movement.
The outlook seems quite bearish. Firstly, the price is close to the descending resistance line that has been in place since January but has failed to reach it. The same thing has happened with the previous breakdown level at ₿0.0192.
The resistance is strengthened by the presence of the 50-, 100- and 200-day moving averages (MA), which are all offering resistance to the price.
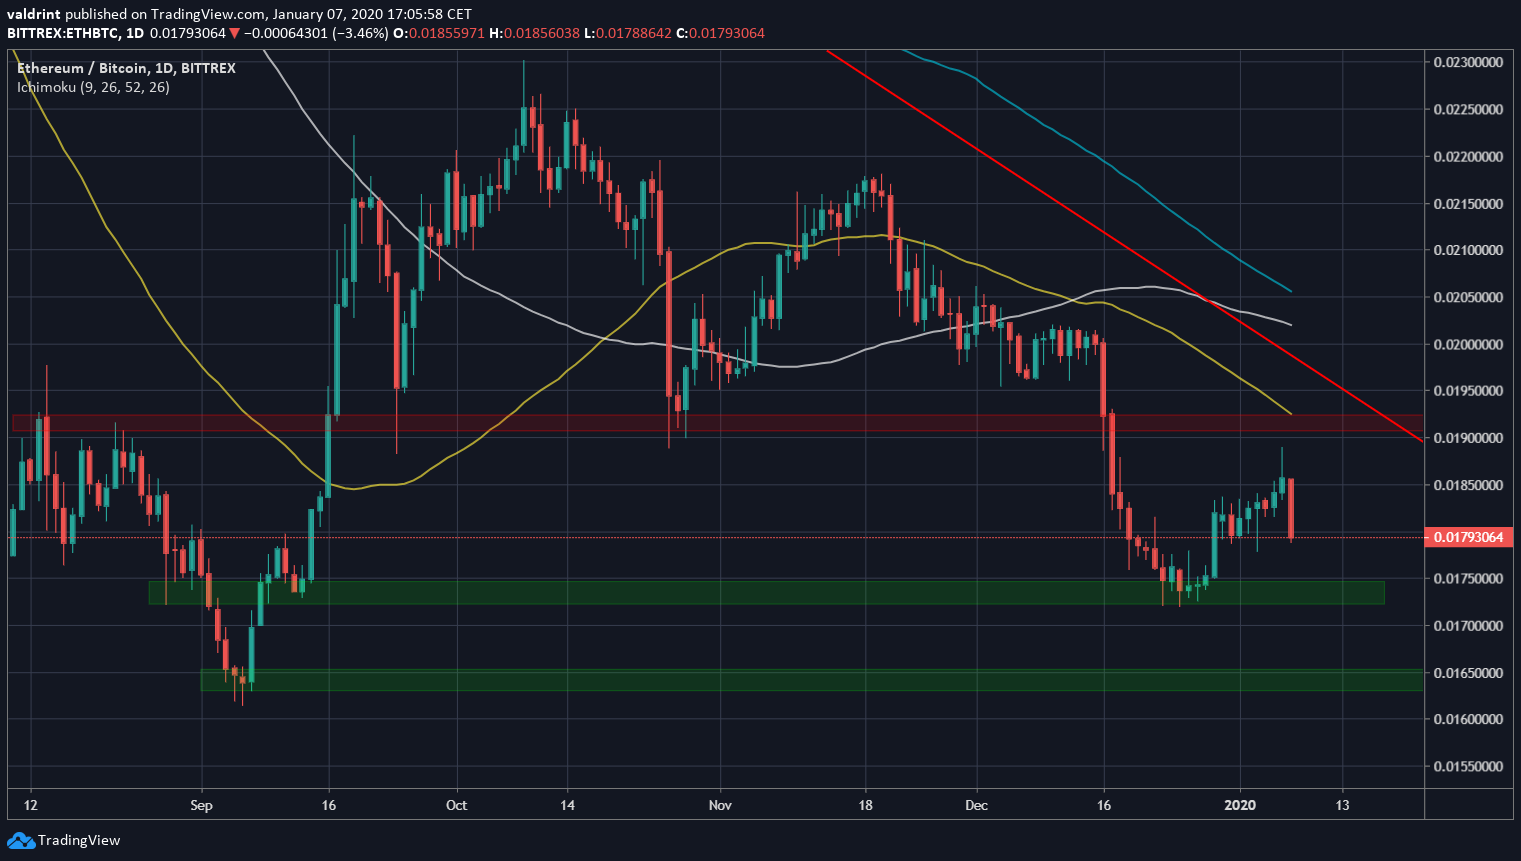
This makes it unlikely that the price will reclaim this level, rather it could fall towards the next support area, which is found at ₿0.0164.
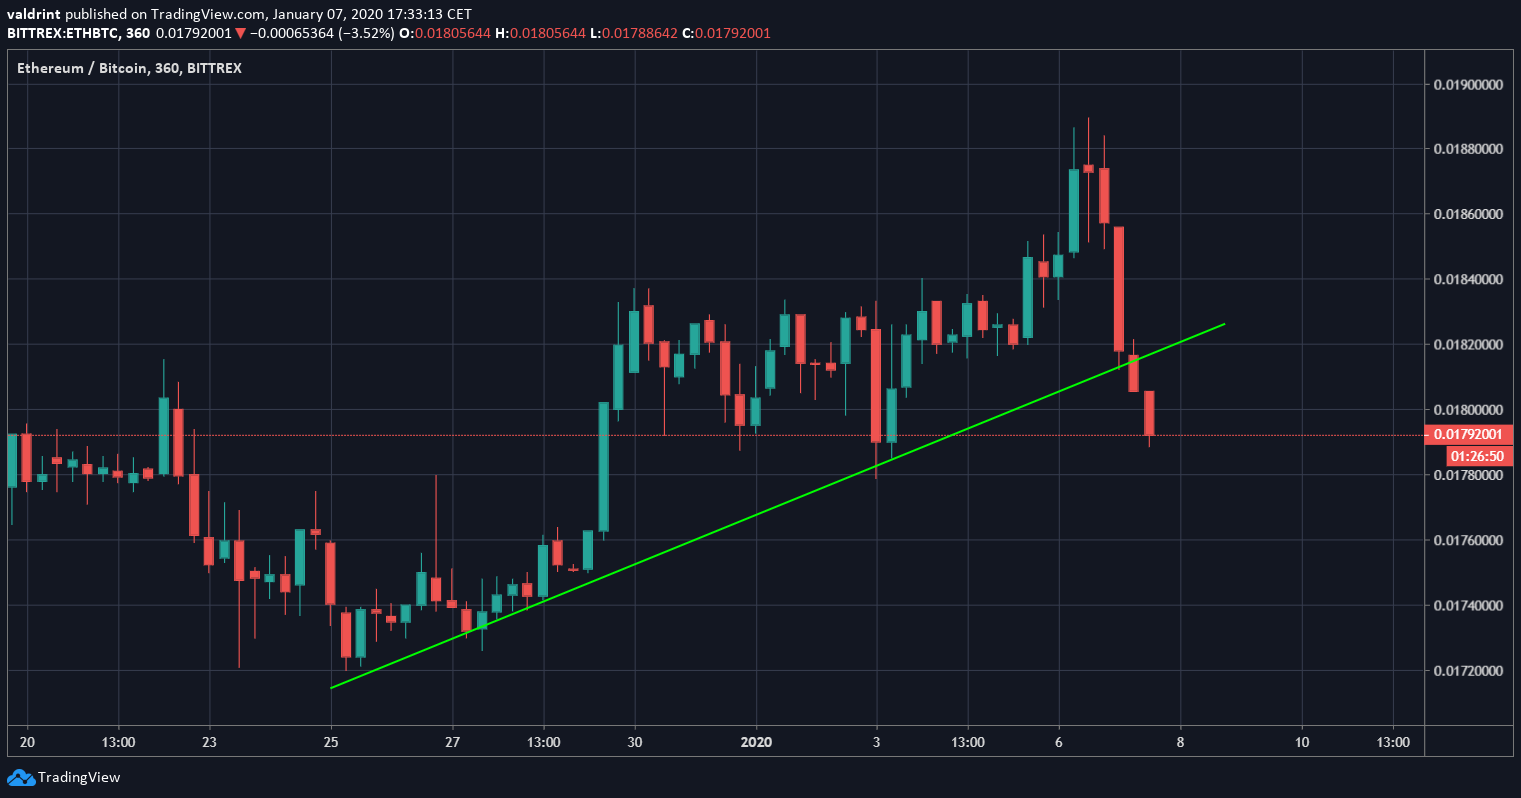
This view is also supported by the breakdown from the short-term ascending support line that had been in place since December 25.
Ethereum Descending Wedge
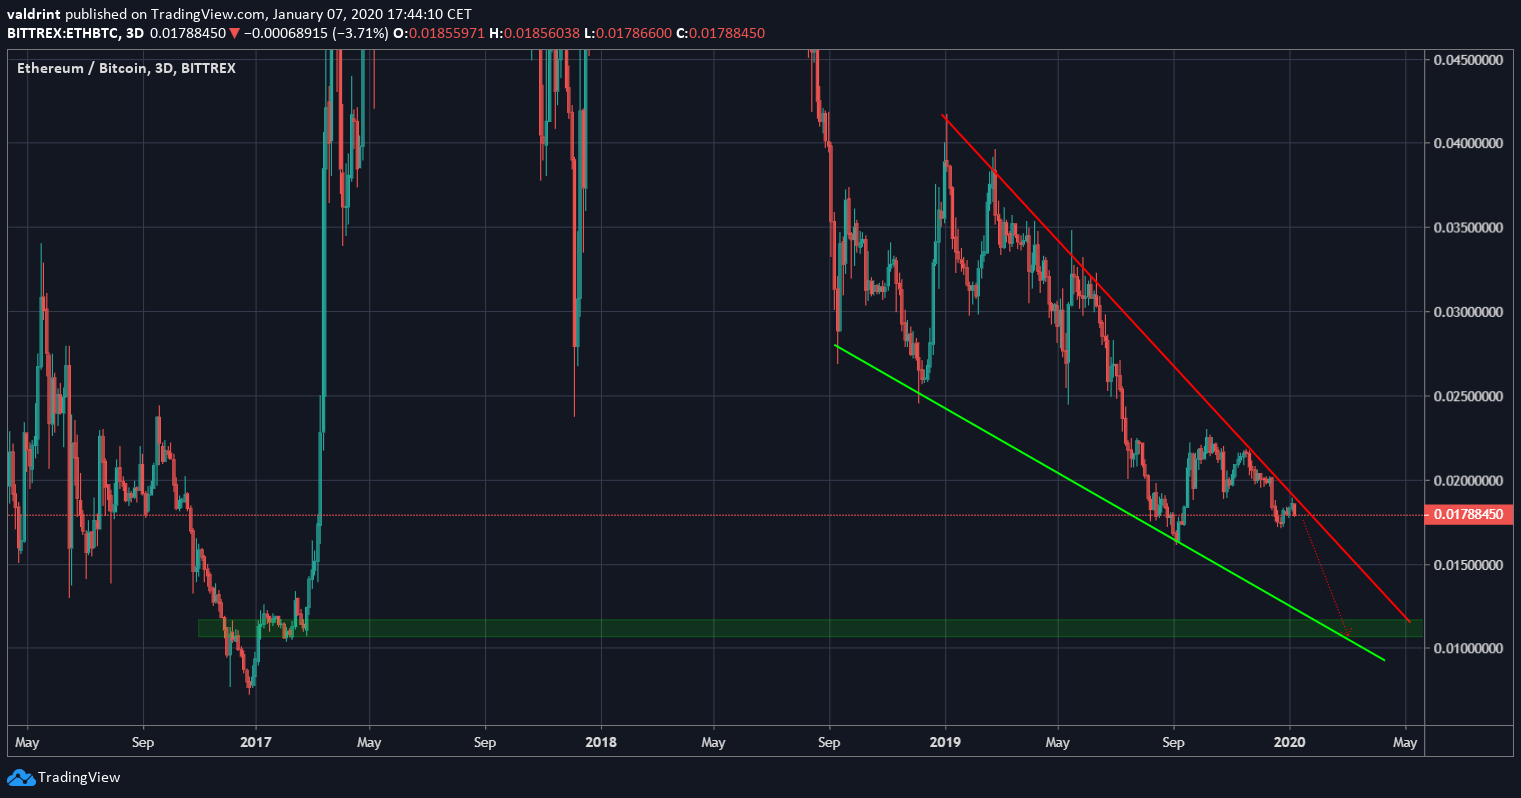
In the long-term, we can see that the price has been trading inside a descending wedge since September 2018. The wedge is a bullish pattern, making a price breakout more likely. However, the end of the pattern is not projected for quite some time, so a decrease toward the support line could occur initially before an eventual breakout.
At the current time, we cannot state for certain that the price will decrease all the way to the support line since it could make a double bottom at 0.016 and begin to increase. However, a breakout seems very unlikely.
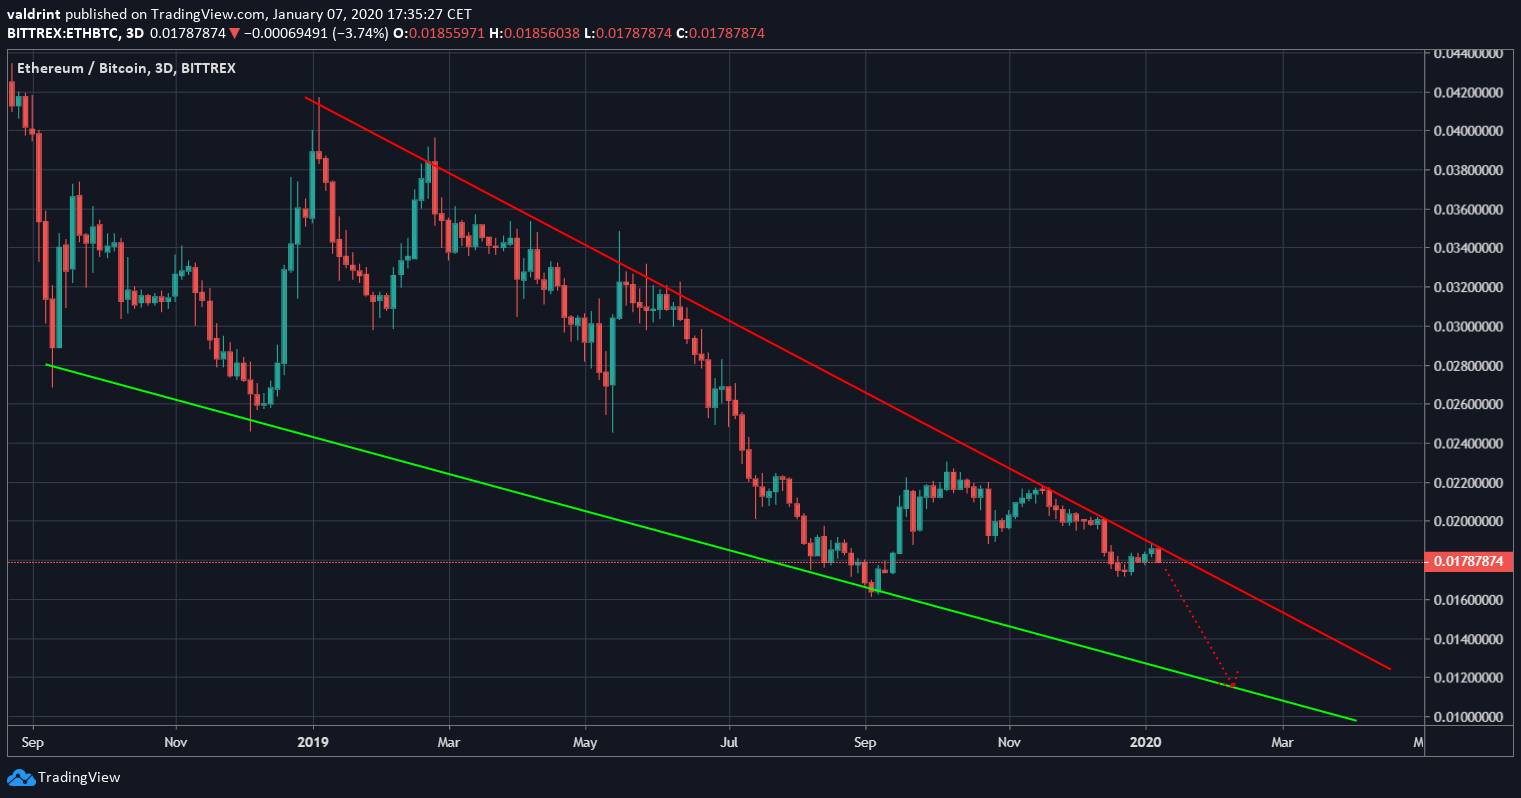
If the price continues to decrease, the next support level should be found at ₿0.011. The descending support line coincides with this level in March 2020.
To conclude, the Ethereum price is approaching a significant resistance level, which has previously acted as support. We do not believe the price will break out. Instead, it will continue to decrease until it reaches at least one of the support areas outlined above.
