The Ethereum (ETH) price is currently trading inside a minor support area and has shown numerous signs of weakness, all of which suggest that a short-term fall awaits.
Note: This is a shorter-term analysis. For a longer-term one, click here.
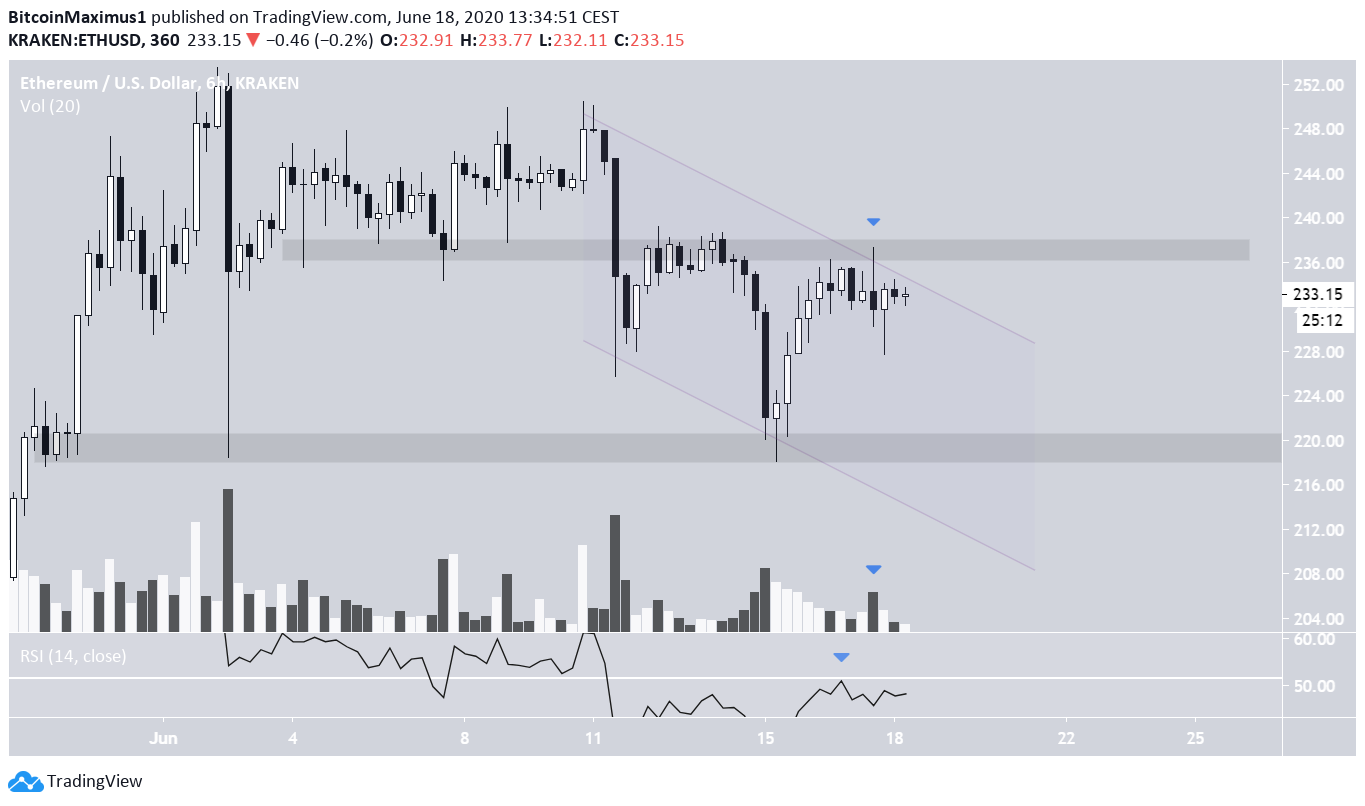
Trading Range
On the 6-hour chart, the primary resistance and support levels for Ethereum are found at $237 and $220, respectively. The price reached the resistance area earlier today but created a bearish candlestick with a long upper wick and above-average volume before falling.
Furthermore, it seems that the price is trading inside a short-term descending parallel channel, currently sitting near the resistance line. If the price declines towards the support line, it is likely to bounce ($220), considering that the area has supported the price three times already.
The possibility of this downward move taking place is also supported by the fact that the RSI was rejected by the 50 MA line and is moving downwards.
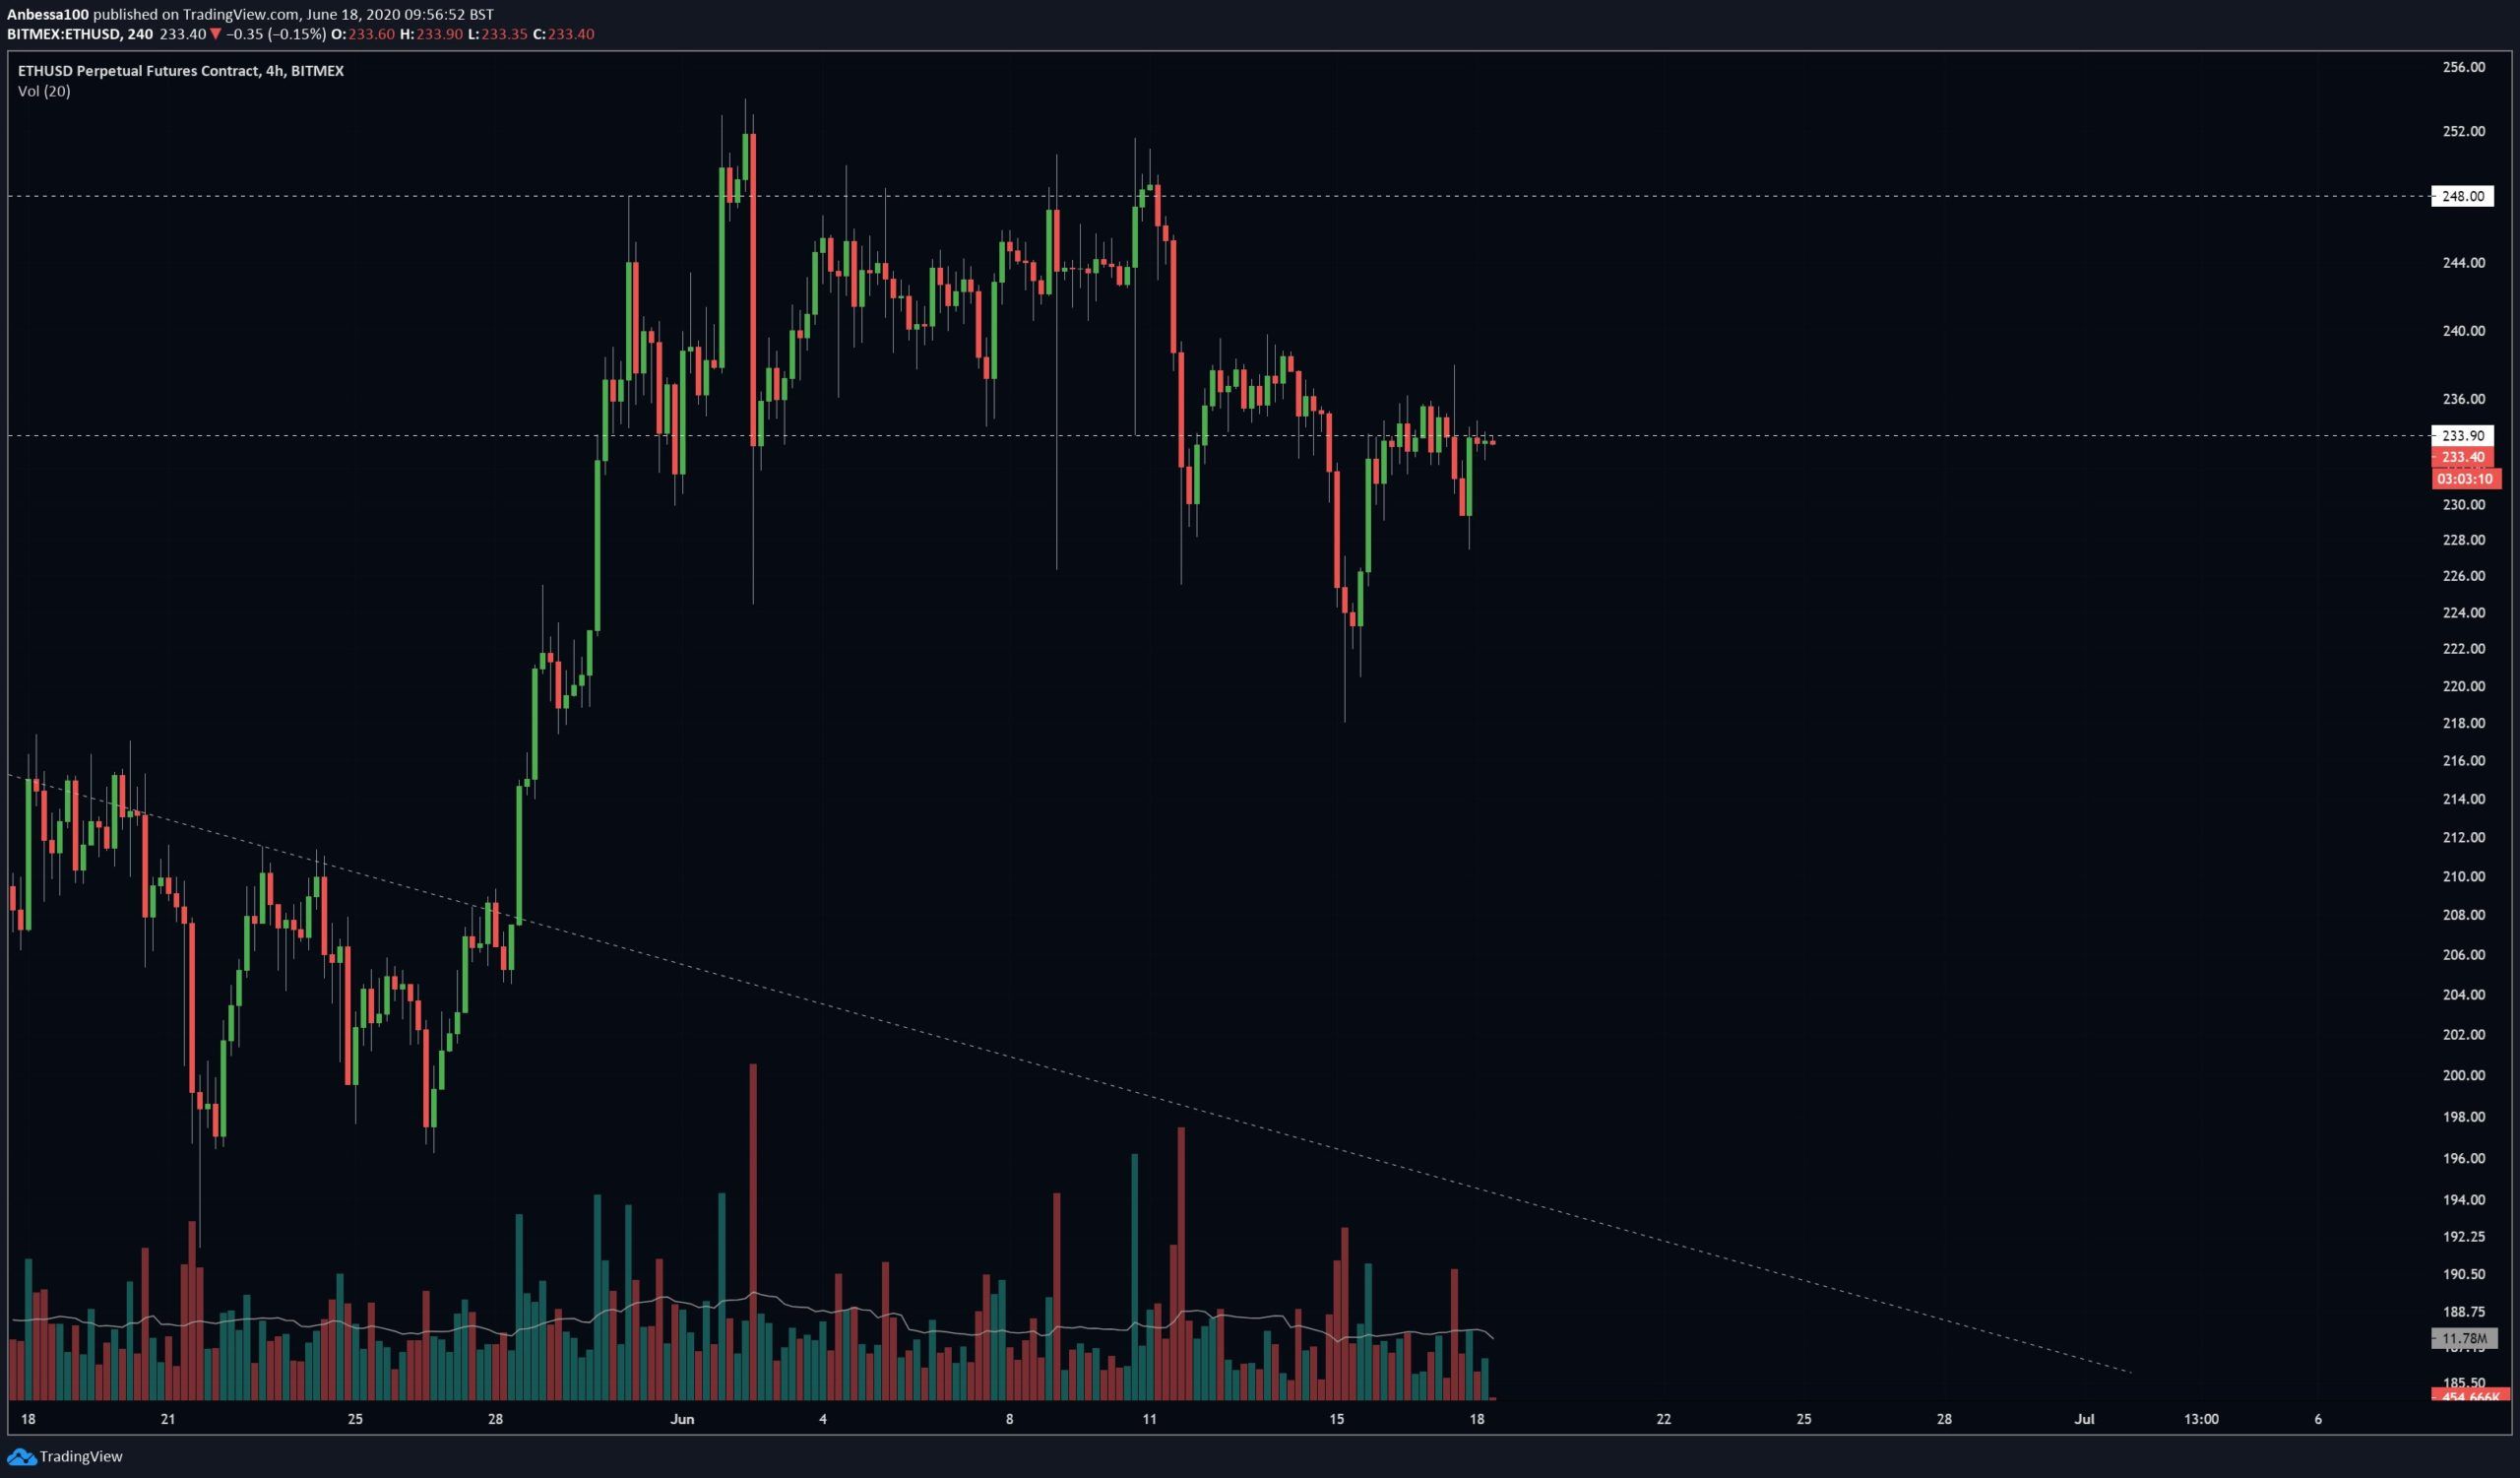
Well-known trader @Anbessa100 shares this belief, as she stated that the Ethereum price is likely to dump soon:
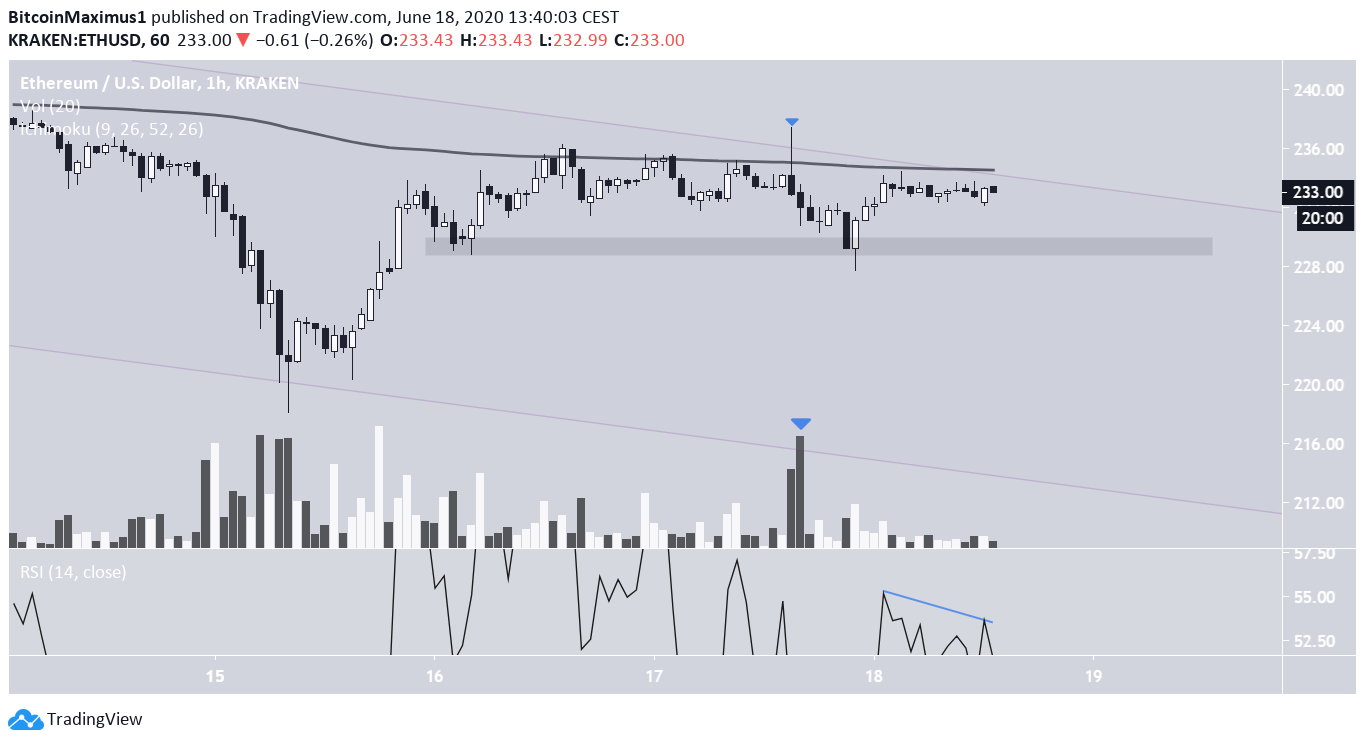
The hourly chart reveals that the price is also facing resistance from the 200-hour moving average (MA). In addition, we can see that volume has been much higher during bearish candlesticks, and that there is a slight bearish divergence in the RSI.
All signs point to the Ethereum price moving down in the coming days. If this occurs, the rate of decline is likely to accelerate if ETH loses the $229 minor support area.
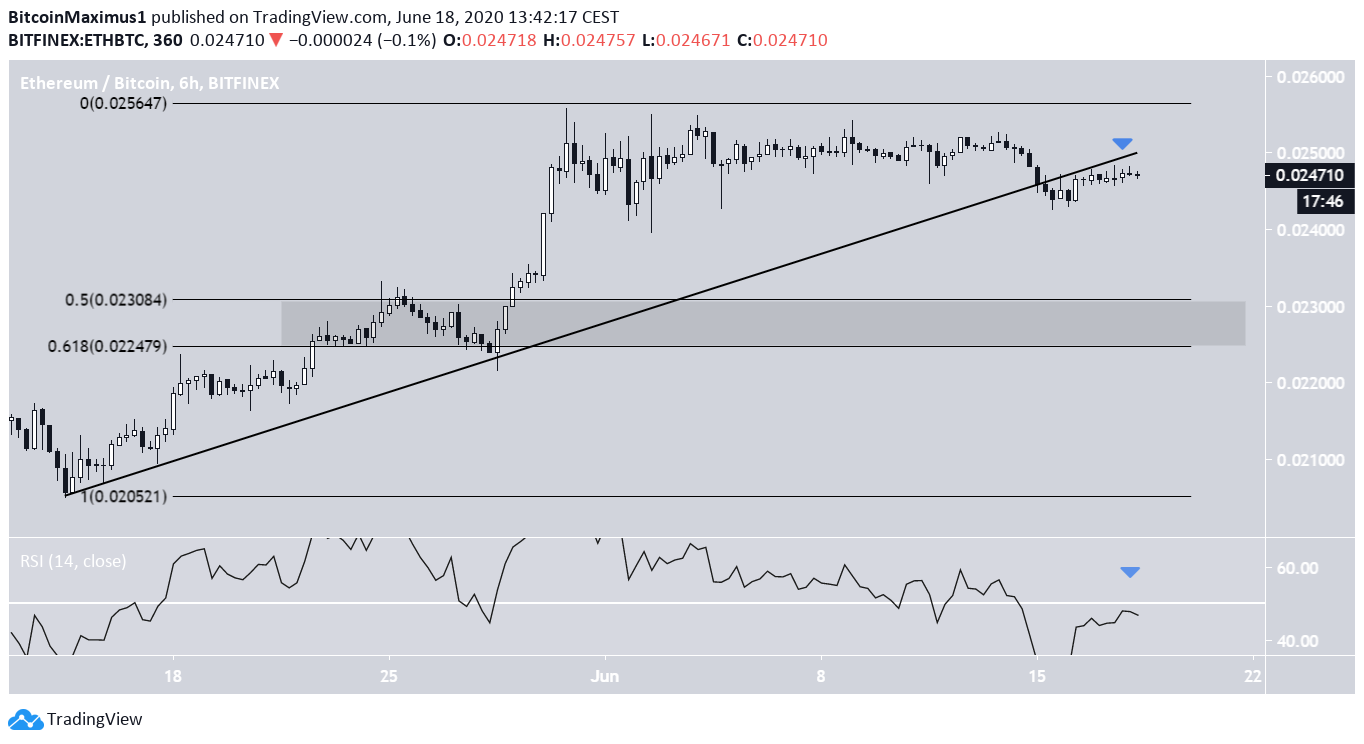
Ethereum/Bitcoin
The ETH/BTC chart also paints a bearish picture. The price has broken down from a rising support line that had been in place since May 16. It is currently in the process of validating it as resistance. Similar to ETH/USD, the RSI has been rejected by the 50 MA line and is decreasing.
If the price continues its downward movement, the closest support area is found at ₿0.0225, between the 0.5-0.618 Fib levels of this entire upward move.