
Ethereum (ETH) reached a high of $4,027 on Sept. 3, just below the current all-time high of $4,372.
While it is showing signs of weakness, it is still trading above the crucial $3,350 support area.
Long-term movement
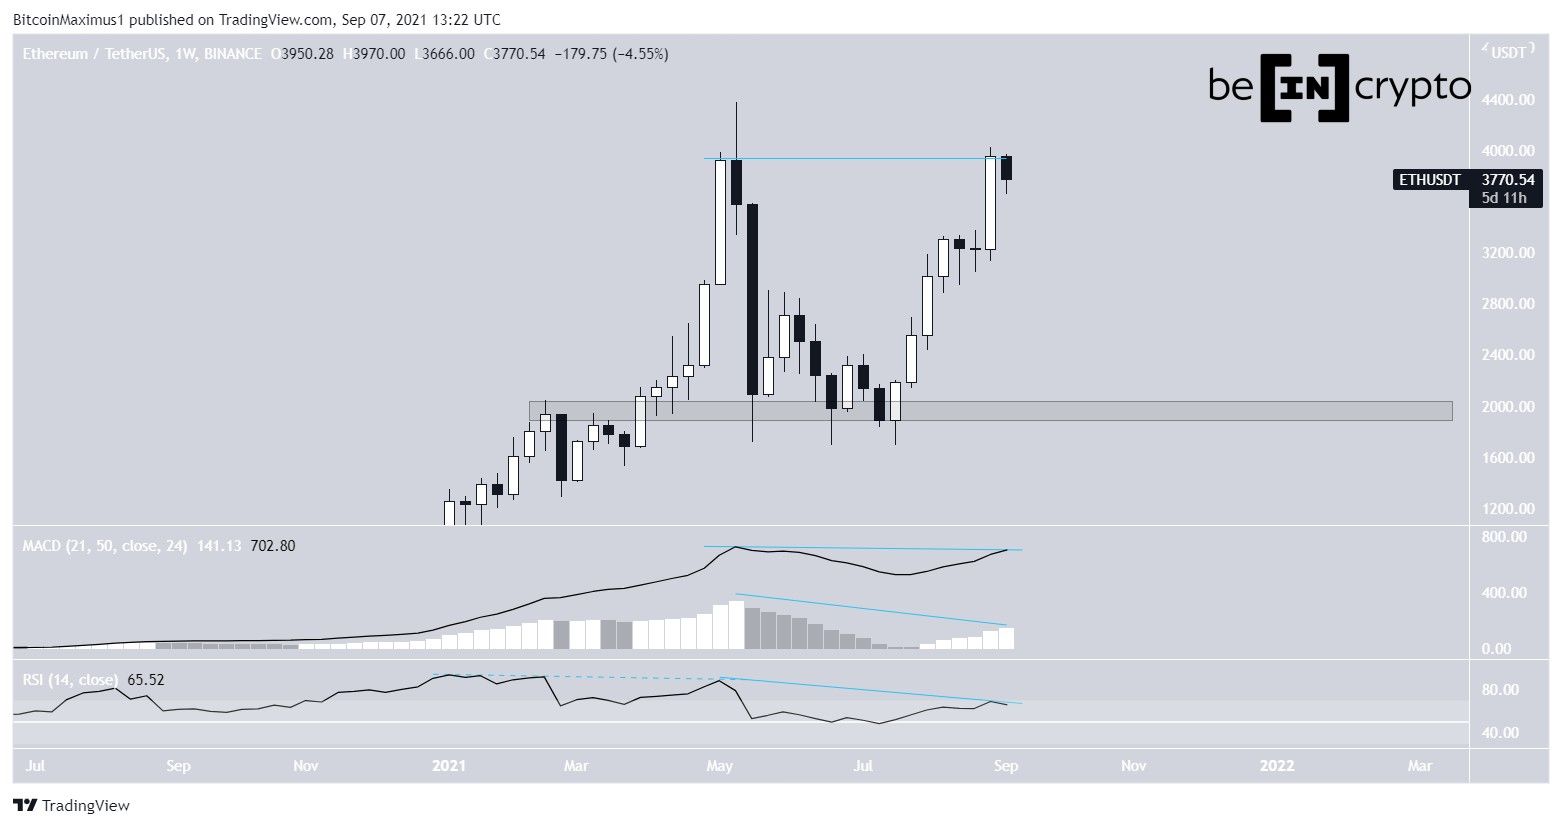
The weekly chart shows that ETH has potentially created a double top pattern. The double top is considered a bearish pattern.
Furthermore, it has been combined with bearish divergences in both the RSI and MACD. The bearish divergence in the MACD signal line is especially worrisome since it is often the catalyst for bearish trend reversals.
The closest support area is at $1,950, created by the re-test of the July lows.
New all-time high?
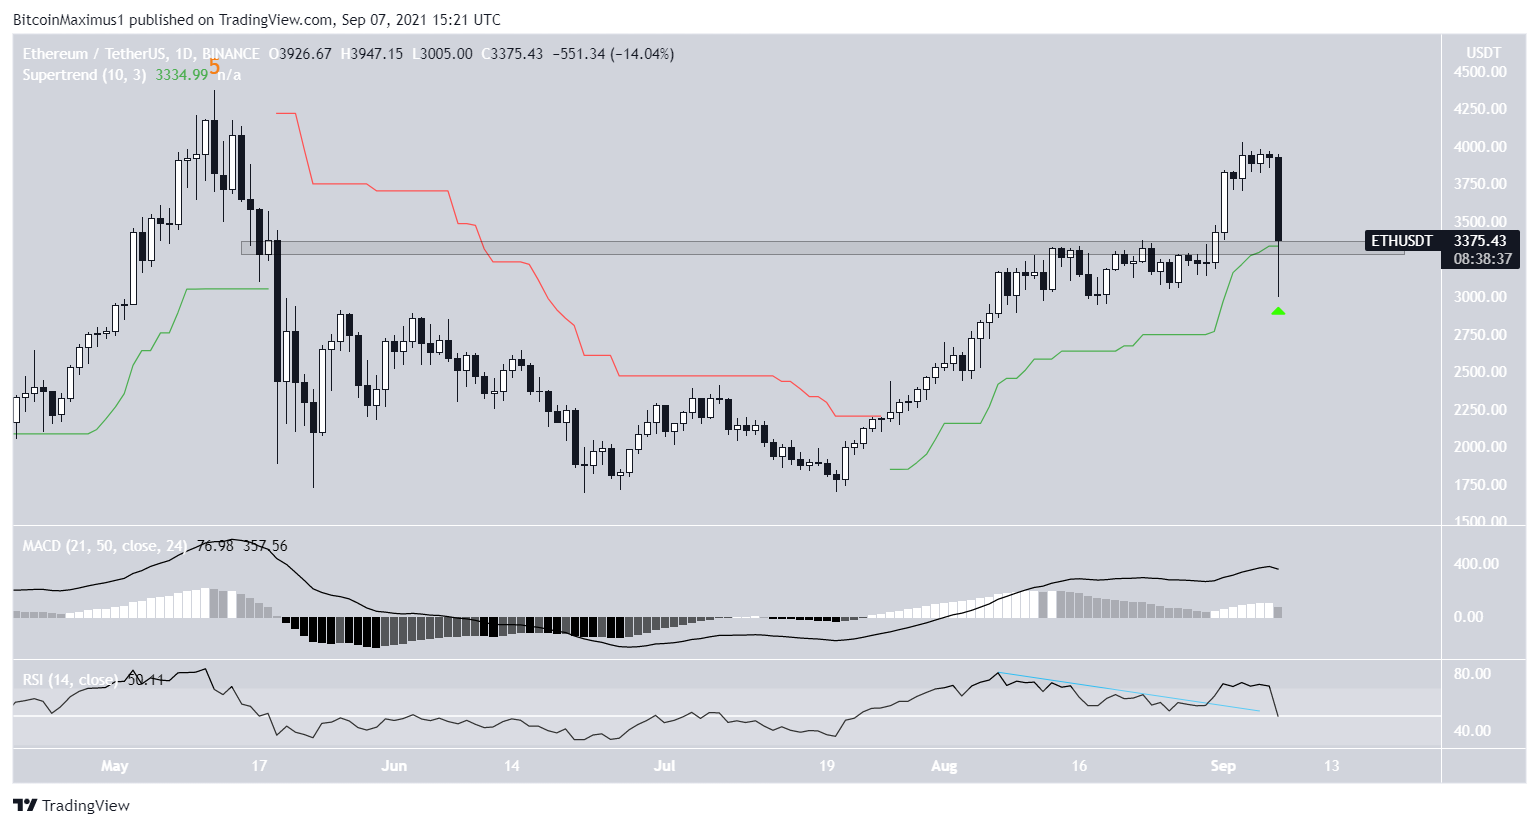
The daily chart shows that ETH struggled to move above the $3,350 resistance area in the period from Aug. 9 to Aug. 29. The area is the 0.618 Fib retracement resistance level and a horizontal resistance area.
While the RSI initially generated bearish divergence (blue), its trendline broke on Aug. 31, when ETH managed to break out above the area. On Sept. 4, it reached a high of $4,027, slightly below the all-time high price of $4,372.
While the token has been decreasing since, with the rate of decrease accelerating on Sept. 7. Despite the drop, ETH managed to hold on above the $3,350 area, which is now expected to act as support. So far, ETH has bounced at the area, creating a long lower wick while also validating the supertrend line (green icon).
ETH Wave count
Cryptocurrency trader @Thetradinghubb outlined an ETH chart, stating that the token is in wave five of a bullish impulse, which will complete just above $4,000.
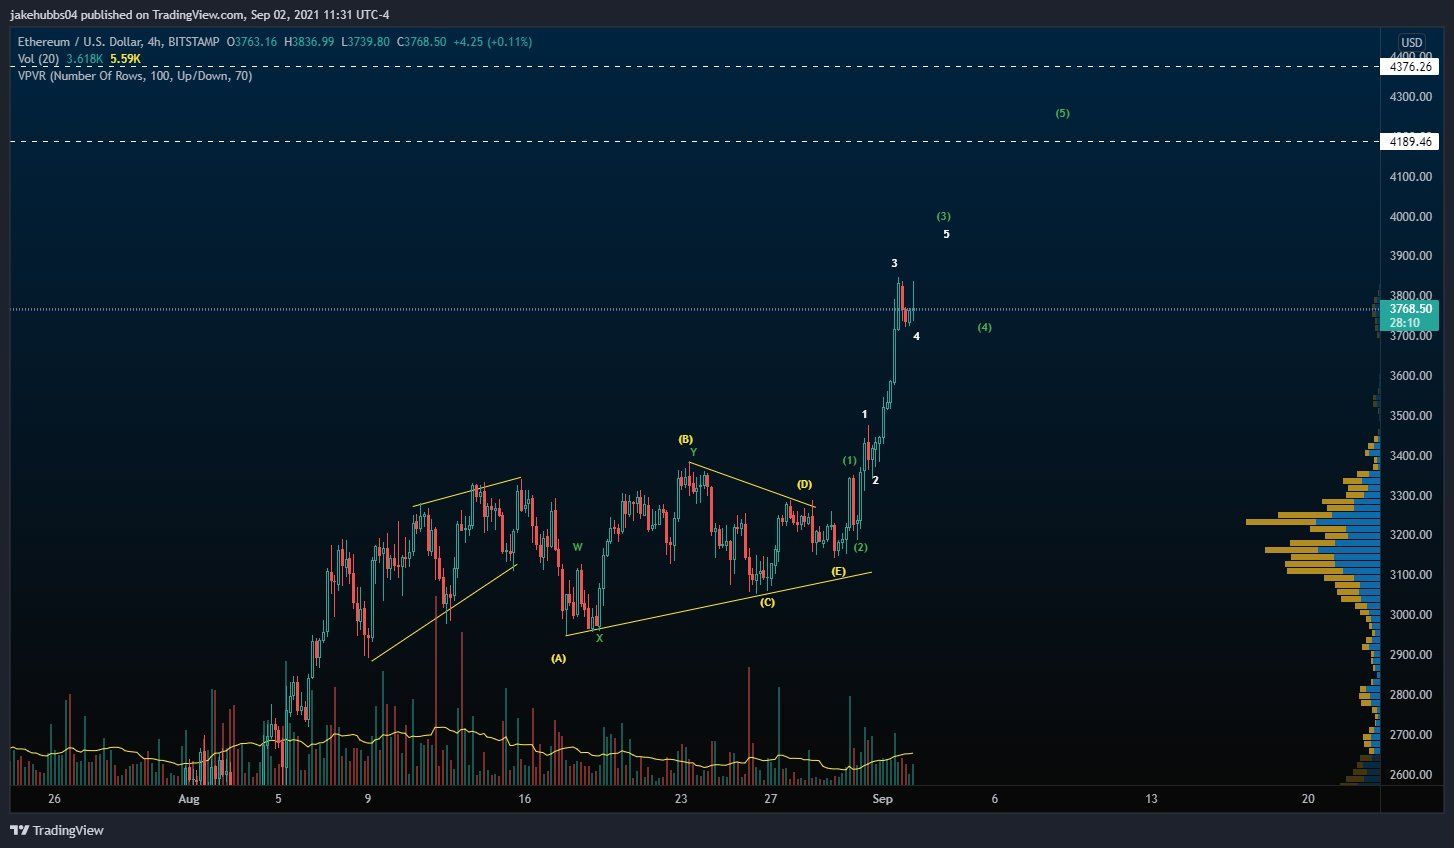
The wave count suggests that ETH is in wave five of a bullish impulse that began on June 22. The most likely target for the top of the upward movement is between $4,070 and $4,180. The target is found using the 1.61 external Fib retracement level (black) and the 0.618 length of waves 1-3 (orange).
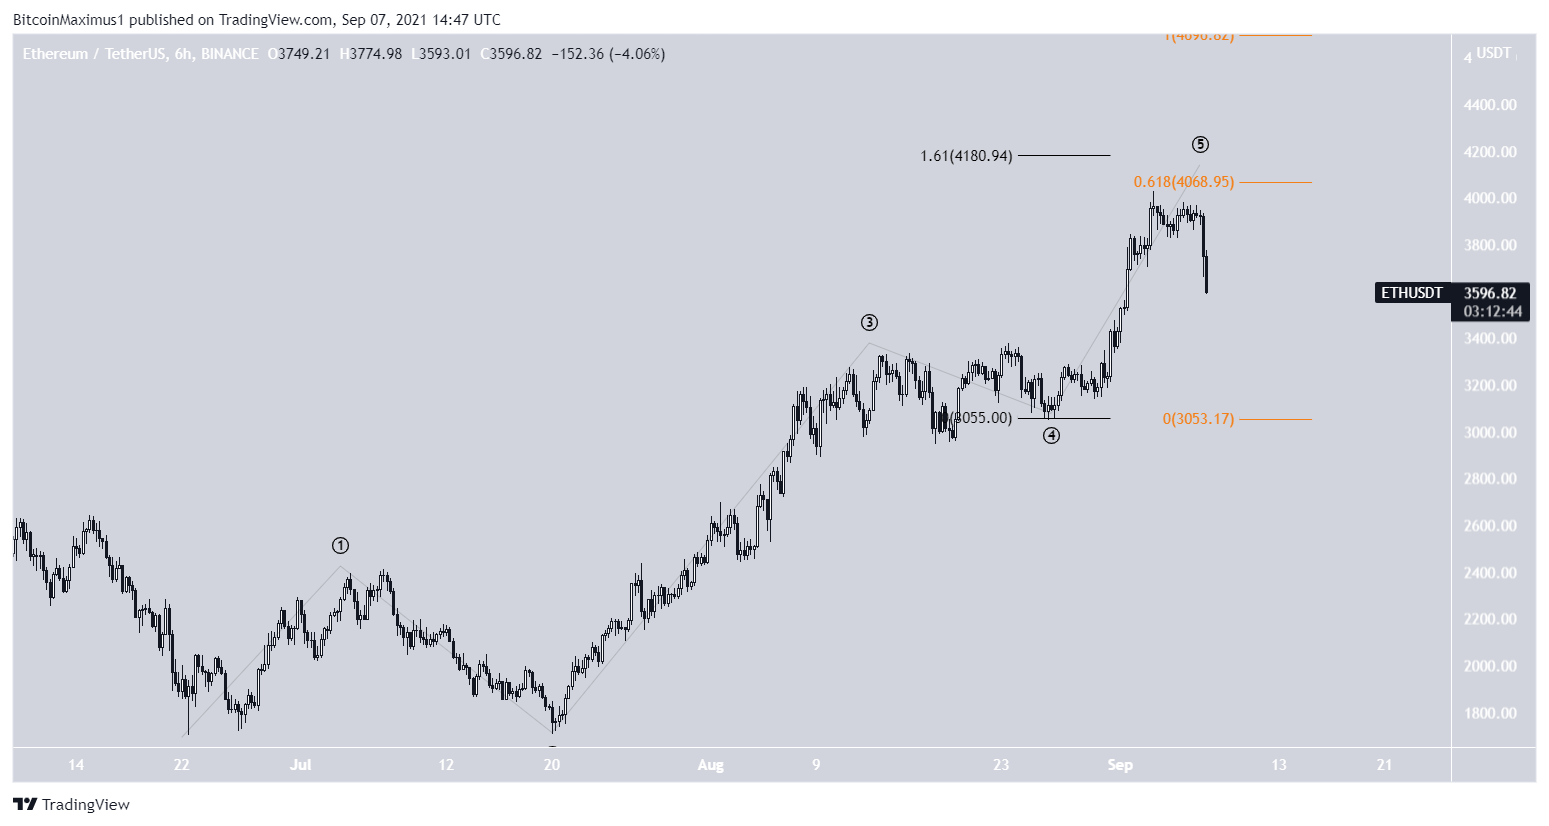
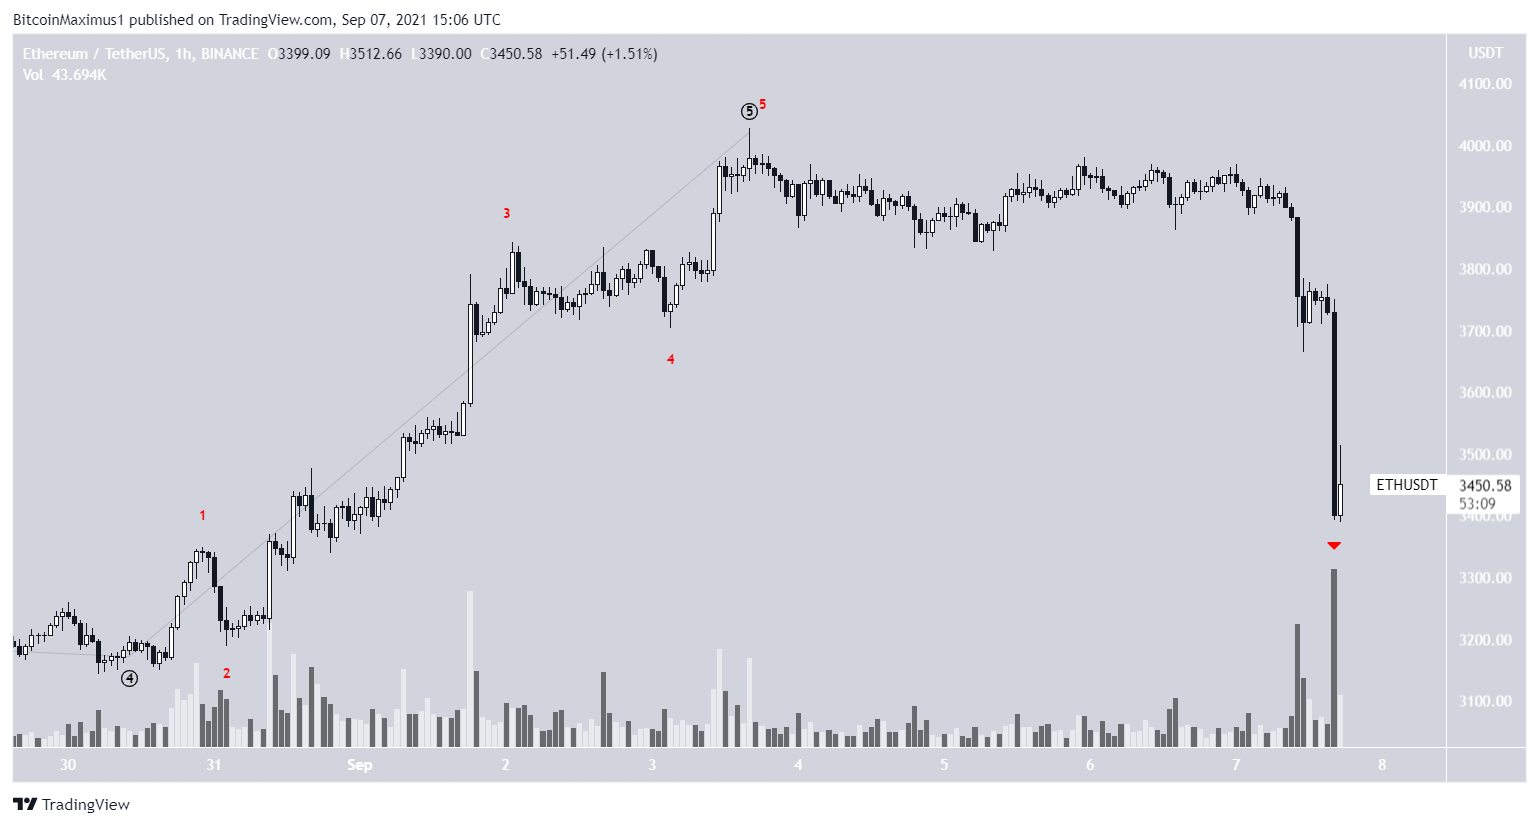
A closer look at the movement shows that its likely that the bullish impulse is complete.
There is a completed five wave sub-wave count (red) in the fifth and final wave. Furthermore, the ongoing drop looks impulsive.
Therefore, it is likely that ETH will correct in the near future.
For BeInCrypto’s latest Bitcoin (BTC) analysis, click here.
