
The EOS price has broken out from a descending resistance line but failed to move upwards afterward. Nevertheless, the short-term chart shows a bullish pattern, from which a breakout is likely.
Breakout or Fakeout?
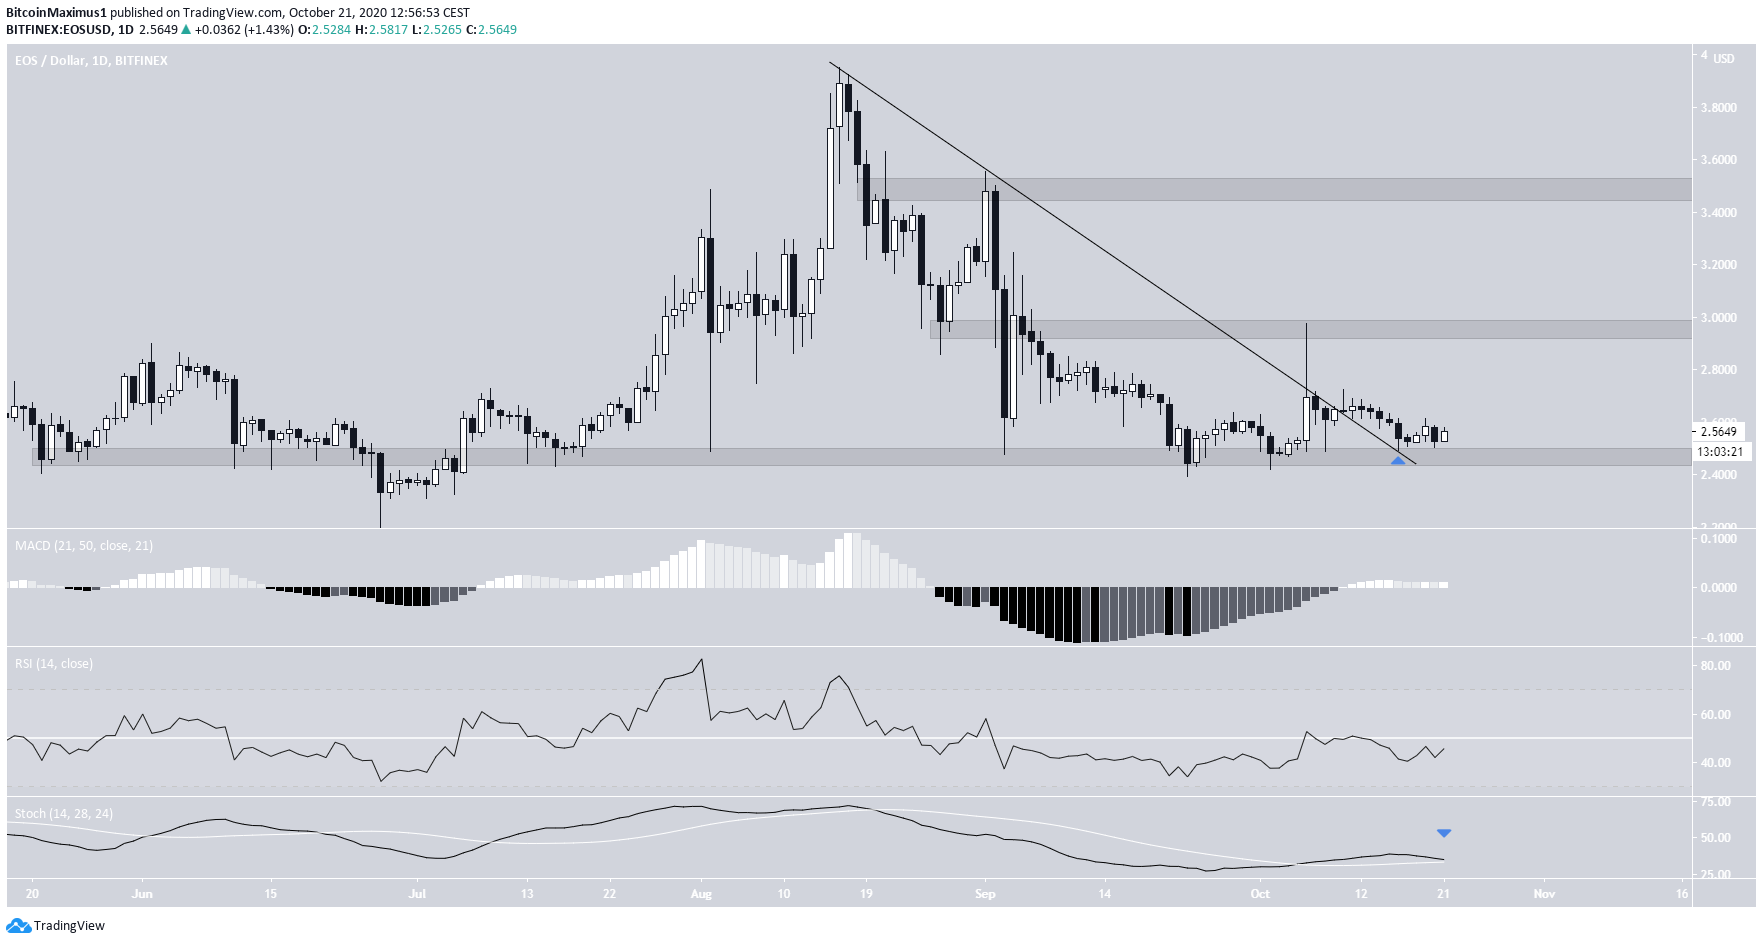
The EOS price has been falling alongside a descending resistance line since Aug 16, when it reached a high of $3.95.
On Oct. 7, the price purportedly broke out from this resistance line but created a long upper wick and fell below it afterward.
Since then, the movement resembles a weak breakout and a re-test of the line along with the $2.50 area as support. If so, the price should continue moving upwards, towards the closest resistance levels found at $2.95 and $3.50.
Technical indicators are neutral, making both a rally and a decline possible. However, as long as the price is trading above $2.50, the most likely scenario would be a rally towards the resistance level outlined.
Short-Term Breakout
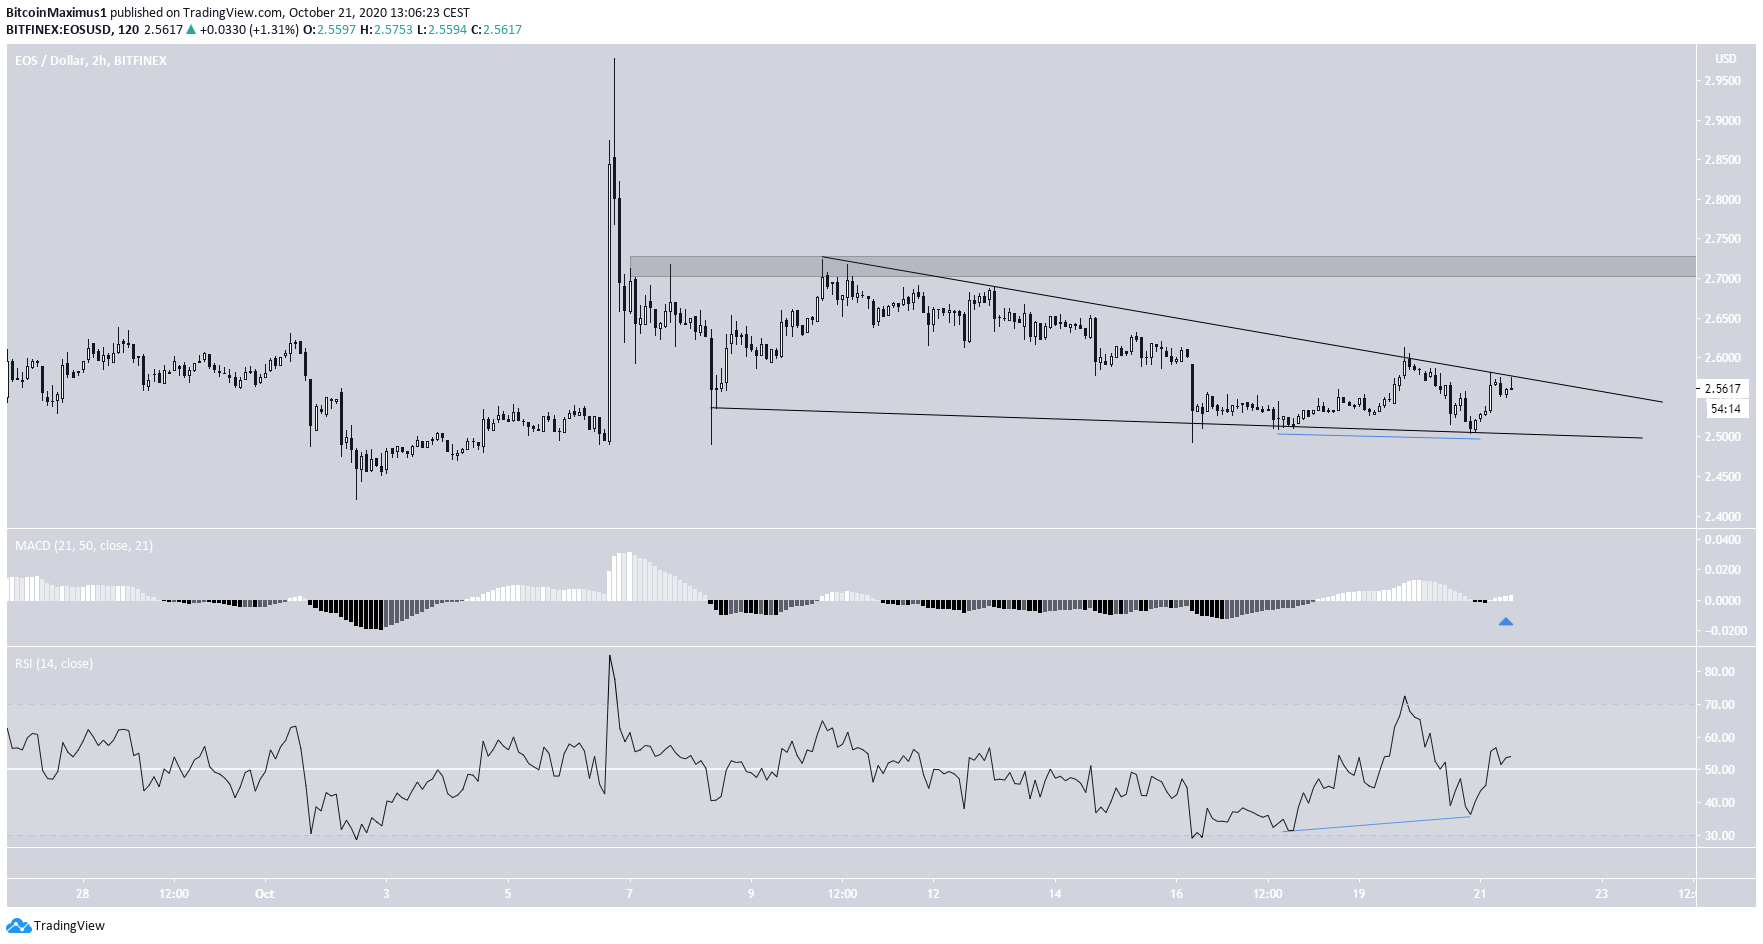
The shorter-term 2-hour chart shows that the price is possibly trading inside a descending wedge, which is considered a bullish reversal pattern.
In addition, the RSI has formed bullish divergence during the two most recent touches of the support line, and the MACD has crossed into positive territory.
A breakout from the wedge would likely take the price to $2.72, halfway to the previously mentioned resistance area at $2.95.
On the other hand, a breakdown from the wedge would invalidate this bullish possibility.
EOS/BTC
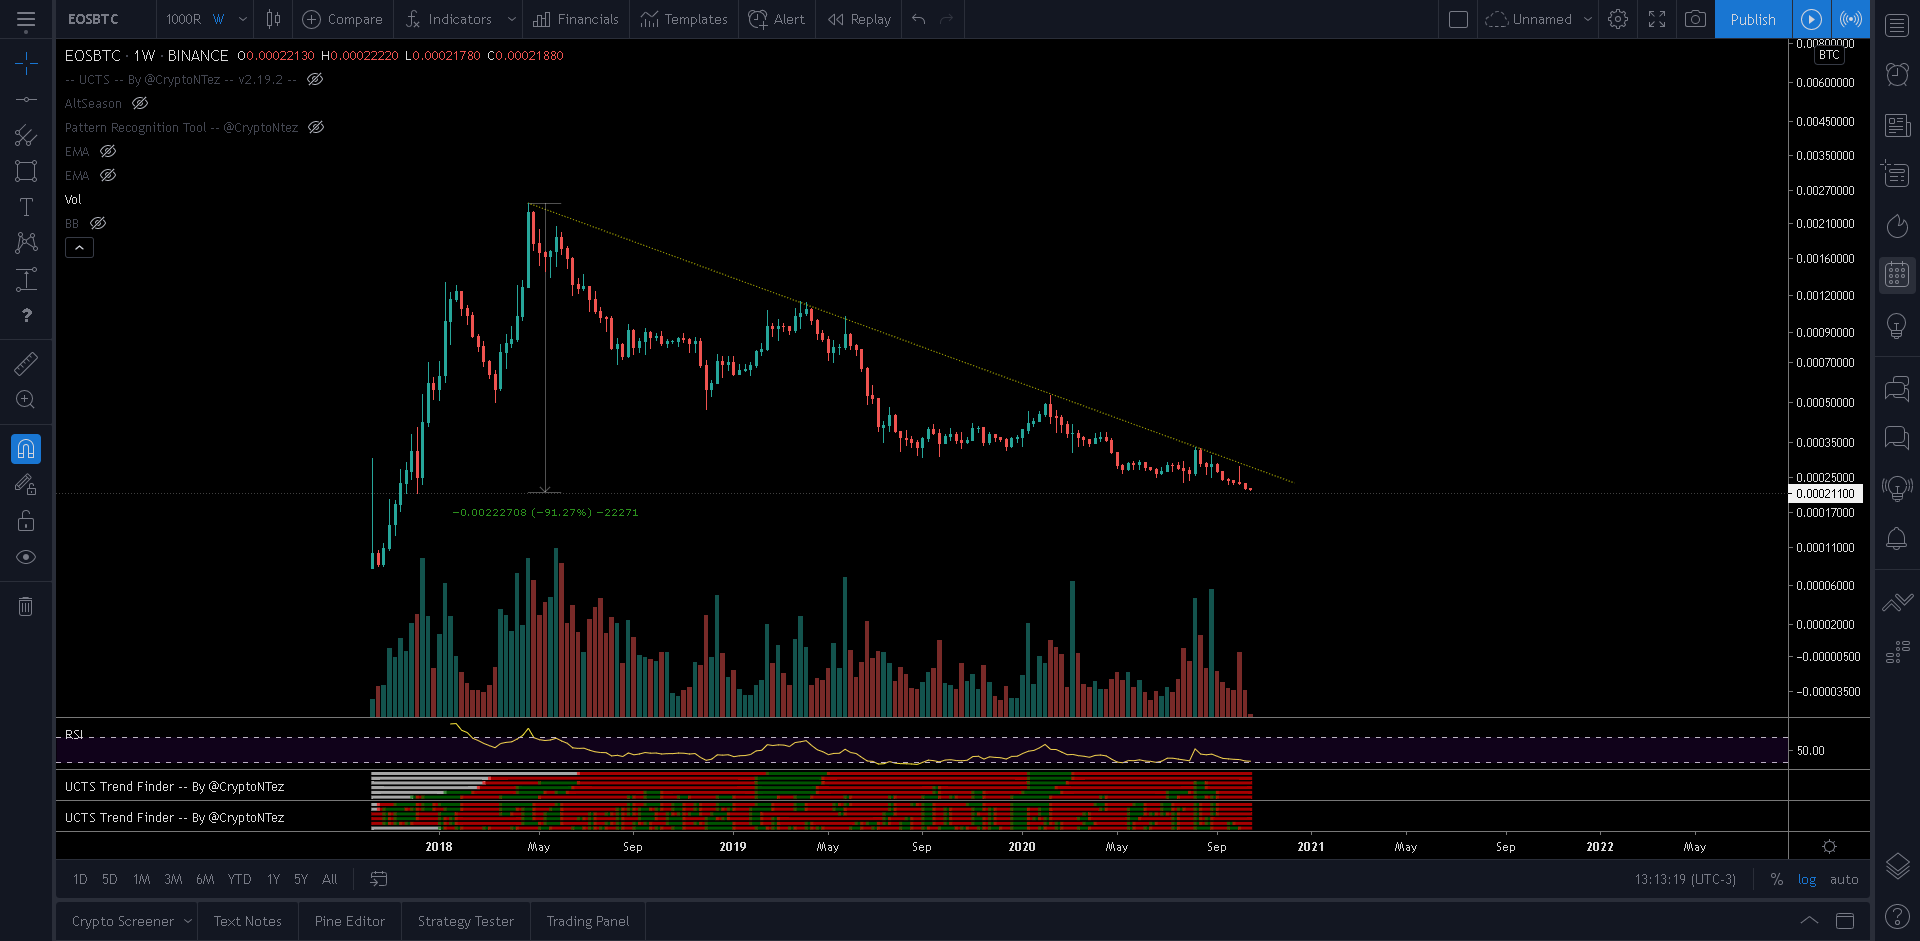
Cryptocurrency trader @CryptoNTez outlined an EOS/BTC chart that shows that the price has lost 91% of its value since reaching an all-time high in Dec 2017.
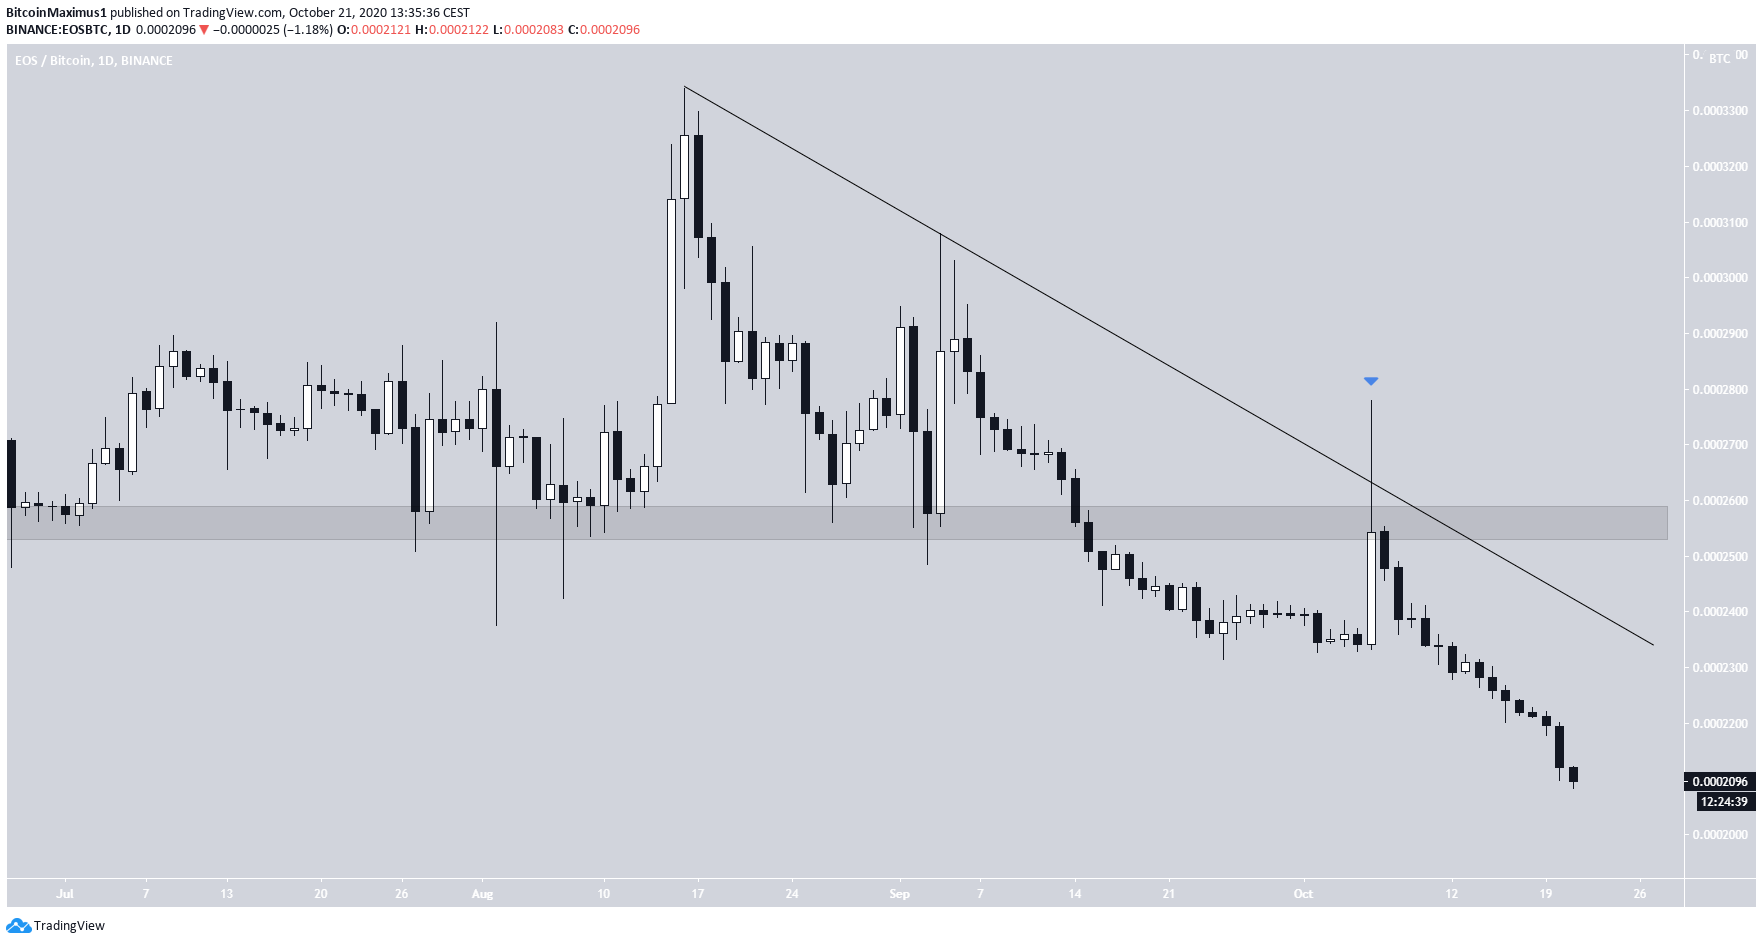
Despite the considerable fall, it seems that there is no clear reversal level for EOS. The price has fallen below the 33,000 satoshi support level and validated it as resistance afterward.
While there is a minor support level near the current price at 21,000 satoshis, it seems possible that the price will decline all the way down to 8000 satoshis, the 2017 lows.
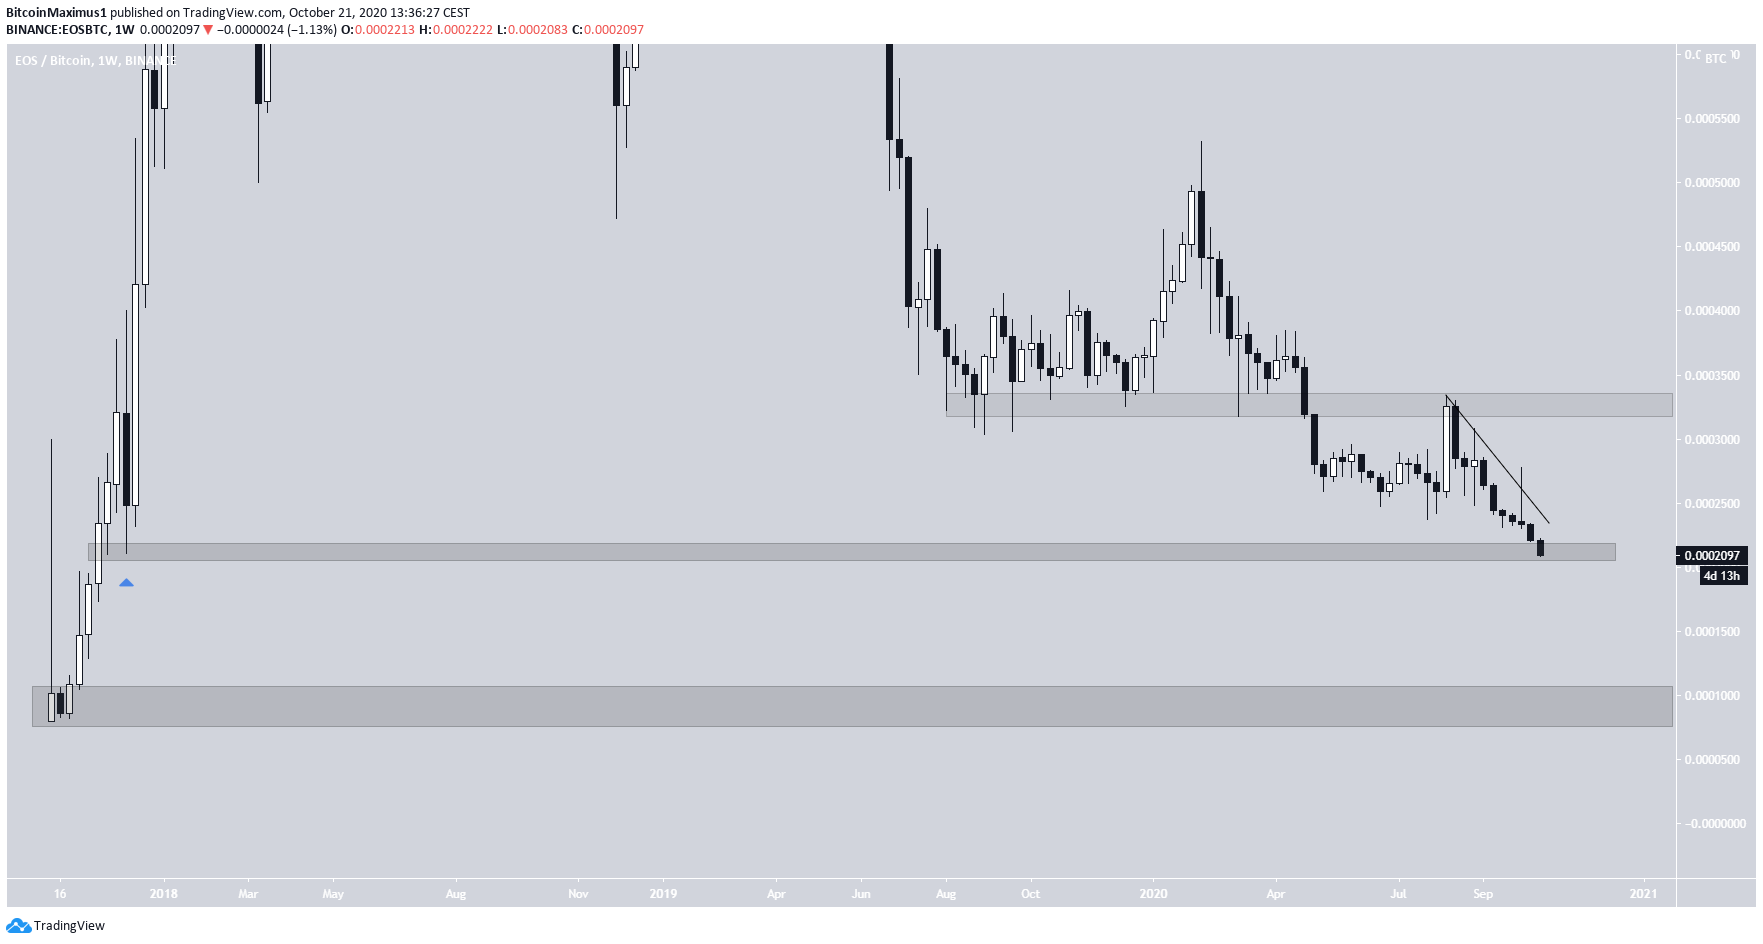
Similar to the EOS/USD pair, EOS/BTC was also following a descending resistance line. However, the Oct 8 pump failed to initiate a breakout, and the price has been falling considerably since.
Therefore, the outlook for EOS/BTC is significantly more bearish than for EOS/USD.
For BeInCrypto’s previous Bitcoin analysis, click here!
Disclaimer: Cryptocurrency trading carries a high level of risk and may not be suitable for all investors. The views expressed in this article do not reflect those of BeInCrypto.
