The DOGE/USD price has bounced on the support line of a bullish pattern and seems poised to break out. On the other hand, the DOGE/BTC pair is stuck in a consolidation pattern.
Well-known cryptocurrency trader @Mesawine1 notes that the Dogecoin (DOGE) price is trading inside a rising channel and will soon break out. He gave a target of $0.0032 for the ensuing move, which is 25% above the current price.
Taking its friggin time, but PA is nearing the apex of the ascending triangle it’s in. Hopefully #bitcoin can behave for a couple more days for #doge to pop.
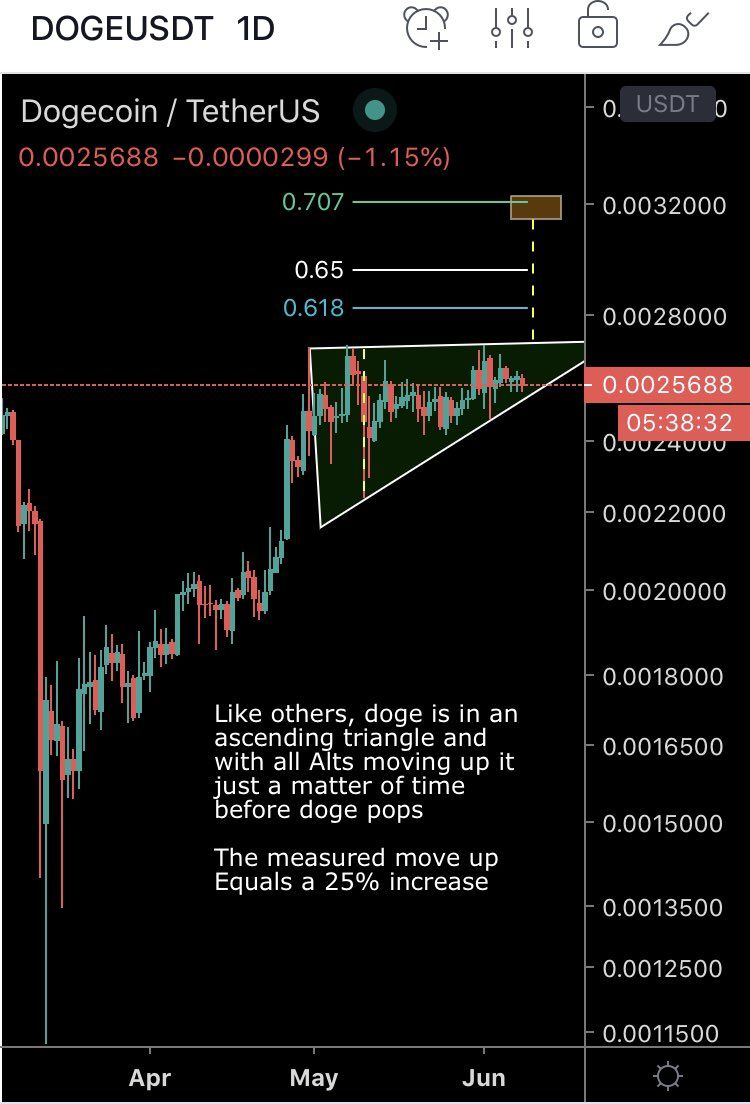
Will the price successfully reach this target? Continue reading below in order to find out.
Ascending Triangle
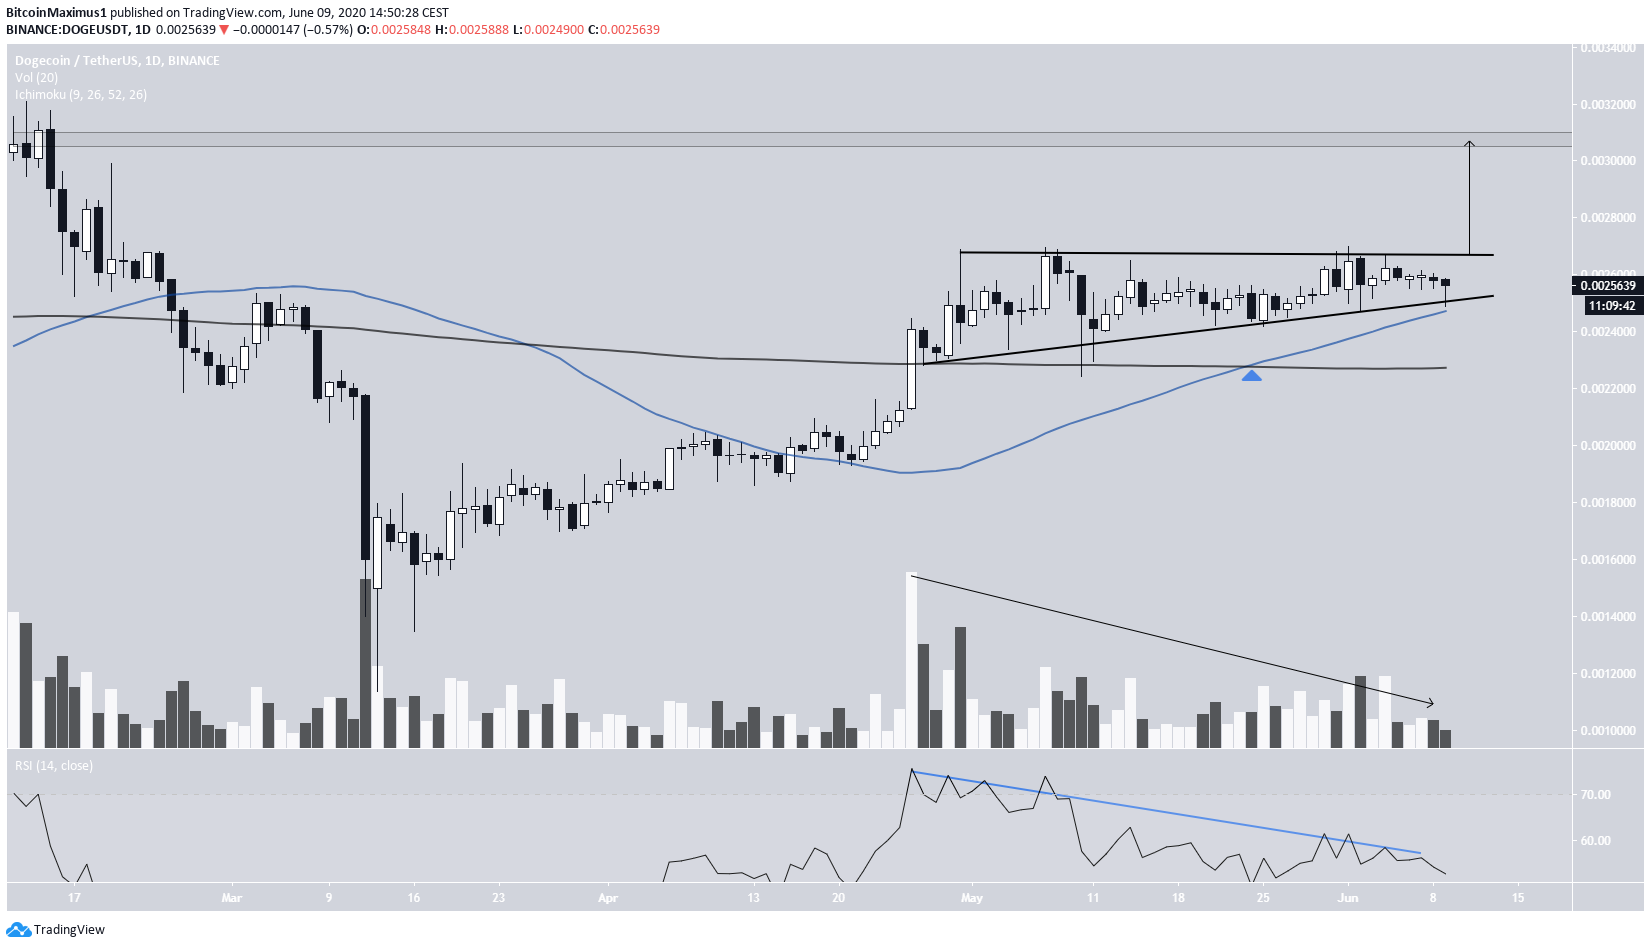
The ascending triangle outlined in the tweet has been in place since April 26, with the resistance line at $0.00267. Both the resistance and support lines have been validated numerous times, increasing the importance of the pattern.
Besides the bullish pattern, the ascending triangle was also formed after a significant upward move that has been in place since March 13. On March 29, a bullish engulfing candlestick formed on the back of substantial volume, which has been steadily decreasing since, as is common in continuation patterns.
Furthermore, the 50 and 200-day moving averages (MA) have formed a bullish cross, and the former is providing price support.
However, there is considerable bearish divergence on the RSI, casting some doubt as to the possibility of the breakout.
If the price breaks out, a rally that travels the entire height of the pattern will take DOGE to $0.00305.
DOGE/BTC
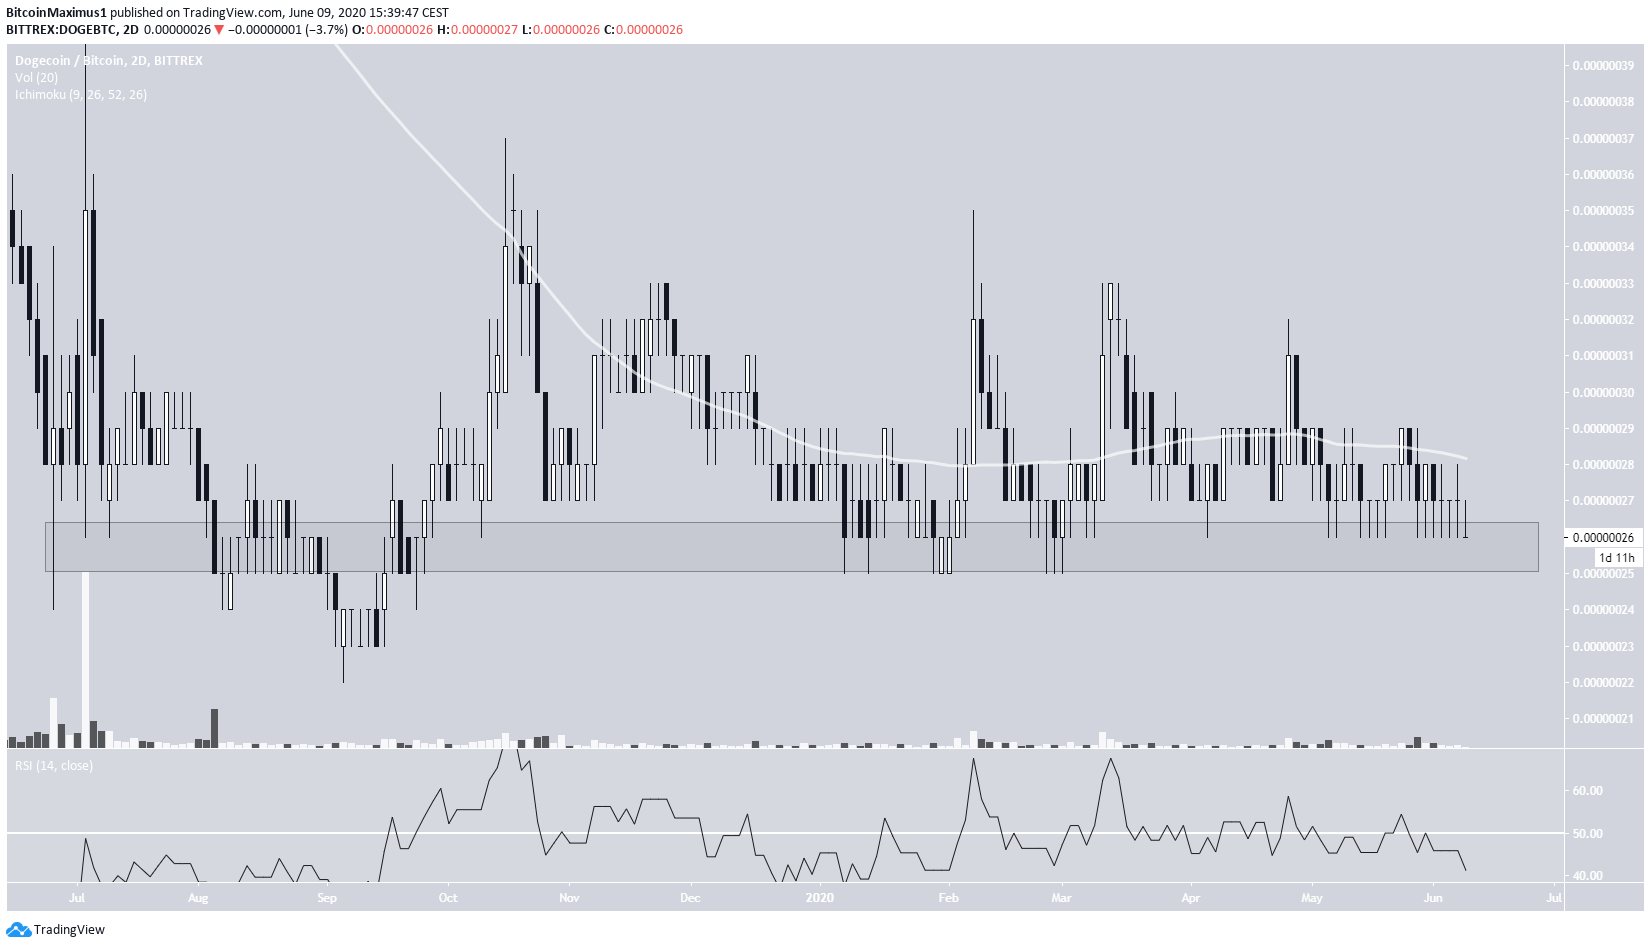
The DOGE/BTC picture is not nearly as clear. The price has been trading above the 26 satoshi support area since July 2019.
The price action and technical indicators give a textbook consolidation period:
- First, volume has been almost non-existent.
- Second, the RSI has been moving freely above and below the 50 MA.
- Third, the price itself has been moving freely above and below the 200-day MA.
Therefore, it is unclear where the price will go next. If DOGE/USD does happen to break out, it will likely drag the DOGE/BTC price upwards. However, there is no clear confirmation from the DOGE/BTC chart.