
The BTC price began the week of March 23 by increasing considerably, reaching a high of $6,957 on March 25. However, the higher prices could not be sustained and the price dropped to close the week at $5,881.
The weekly candlestick turned out to be an inverted hammer, which can be read as bearish due to the fact that it is transpiring in a downward trend.
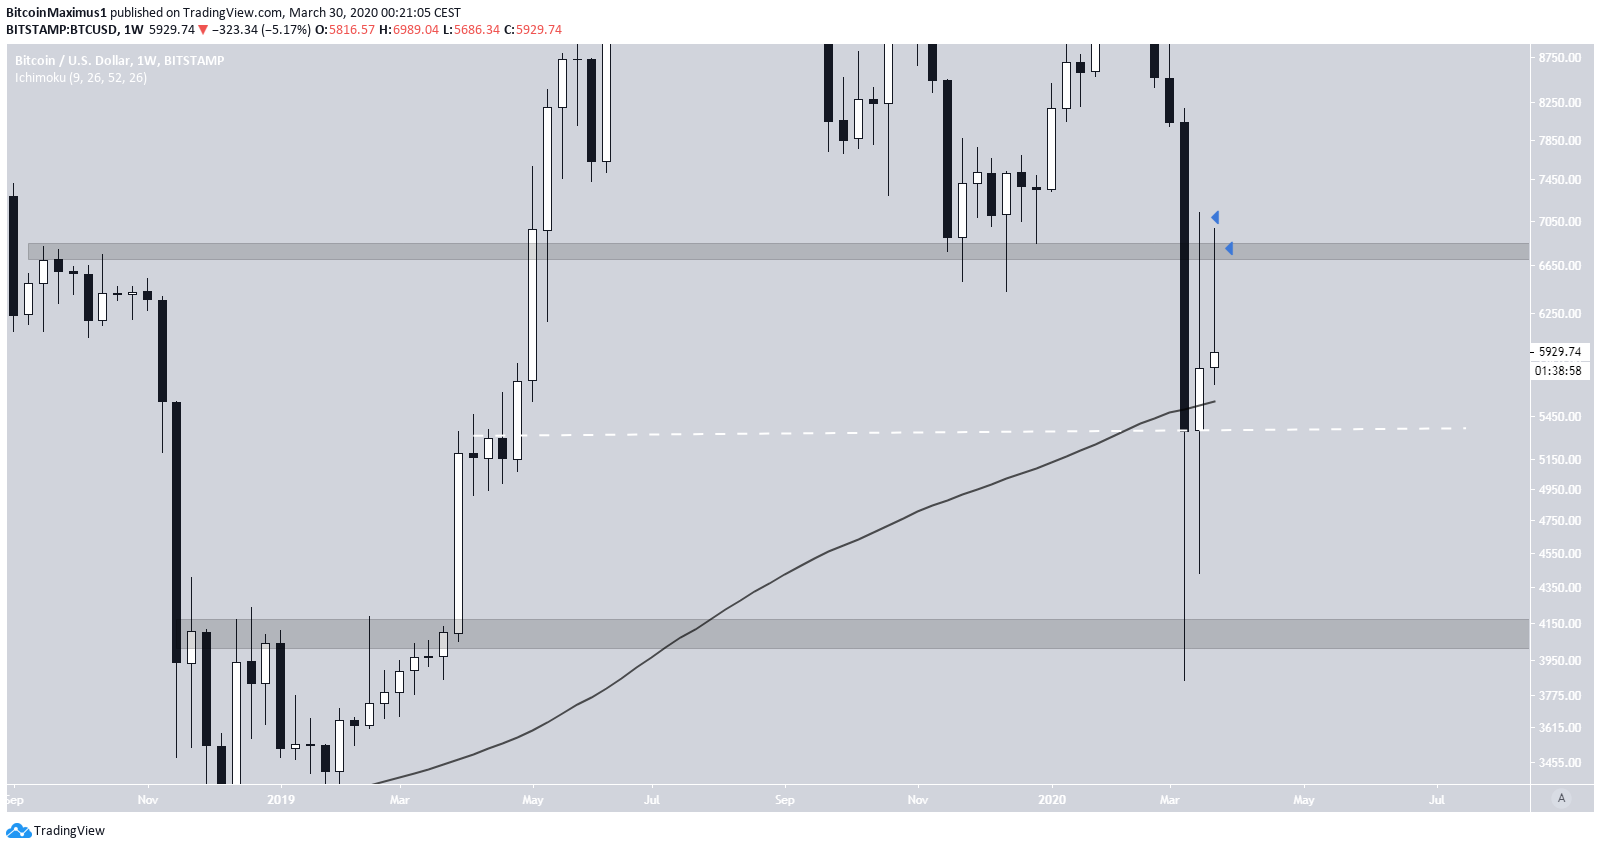
Bitcoin Weekly Candlestick
Last week’s candlestick closed as an inverted hammer. Considering its position relative to the longer-term movement, this candlestick can be considered bearish.
The price has created two successive long upper-wicks, a sign of resistance and heavy selling pressure. In addition, the wicks are present right at the $6,900 area, which is an important support area turned resistance. Until the price is successful in breaking through it, the price movement can be considered bearish.
In the weekly time-frame, the closest support area is found at $5,300, a level also supported by the 200-week moving average (MA). A breakdown below this area could trigger a very rapid price decrease due to the lack of support all the way to $4,000.
While the weekly close above the 200-week MA is bullish, all other signs point to a bearish high time-frame bias.
Short-Term Outlook
In the short-term, the price has broken down from an ascending support line it had been following since reaching a low of $3,850 on March 13. The price broke down on March 28 and has been decreasing since. Even though the breakdown has been relatively gradual, there has been virtually no upward retracement.
There are two main support areas, found at $5,750 and $5,050, the price is currently very close to the first level.
While it is possible that the price reverses at this level and moves upwards, the lack of a trading structure, lack of bullish divergence, and bearish high time-frame outlook make it more likely that the price will eventually reach the $5,050 area.
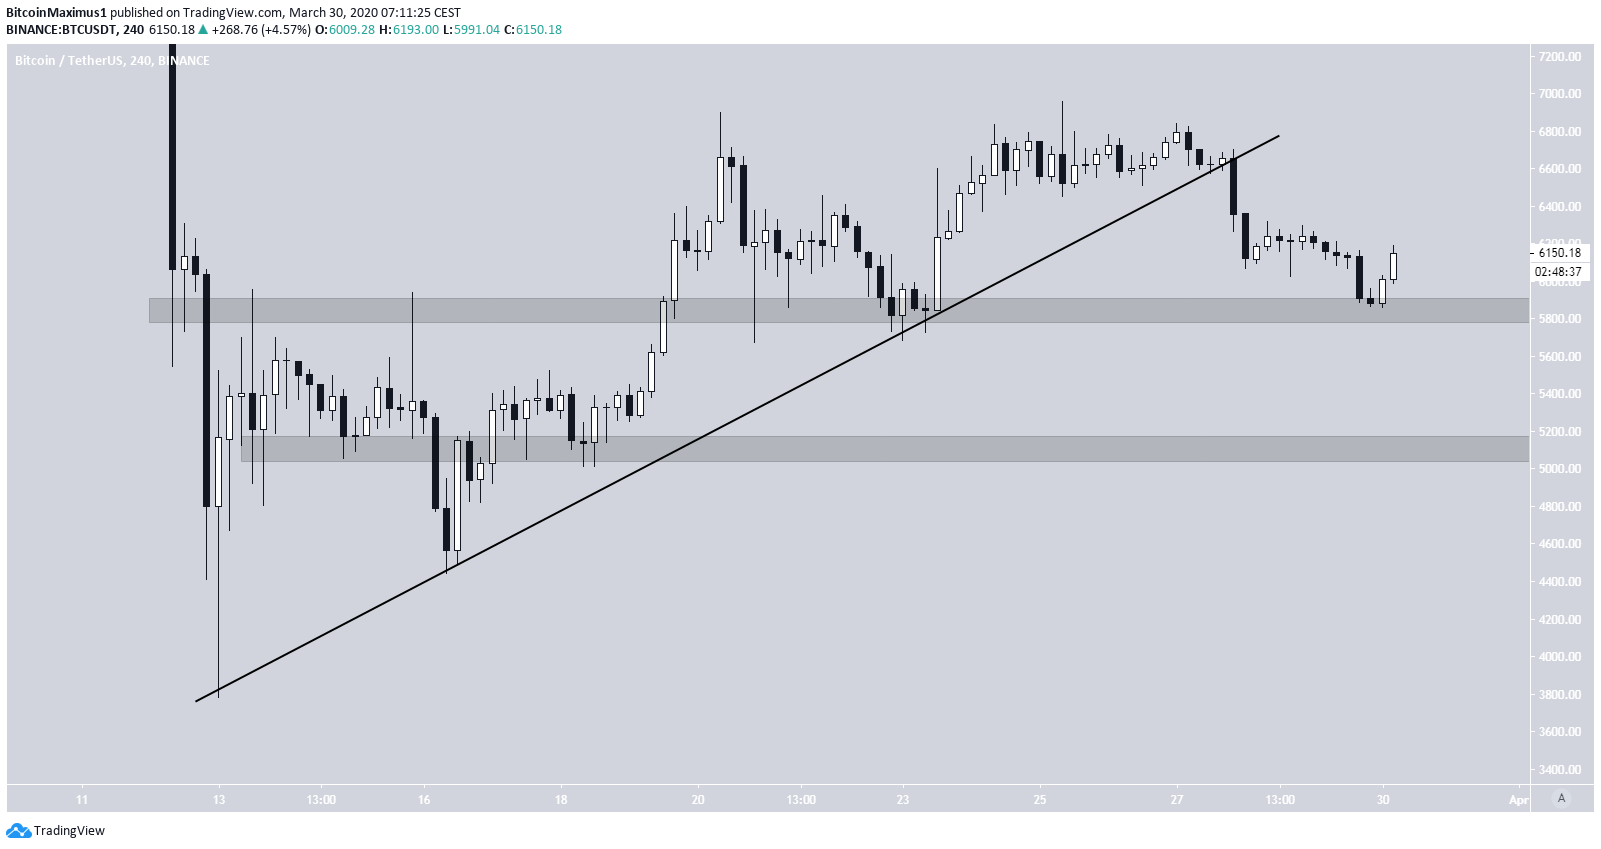
The current relief rally from the $5,800 area is not expected to be a long-term movement, rather an upward relief-bounce prior to the price reaching the $5,050 support.
To conclude, the BTC price has been rejected by the $6,900 resistance area and created a second long weekly upper-wick in a row. The price has broken down below an ascending support line that was in place for 15 days and is expected to decrease at least until it reaches the support levels outlined above.
For those interested in BeInCrypto’s previous Bitcoin analysis, click here.
