


During the week of March 9-16, the BTC price decreased sharply, falling below several significant support levels.
Bitcoin (BTC) Price Highlights
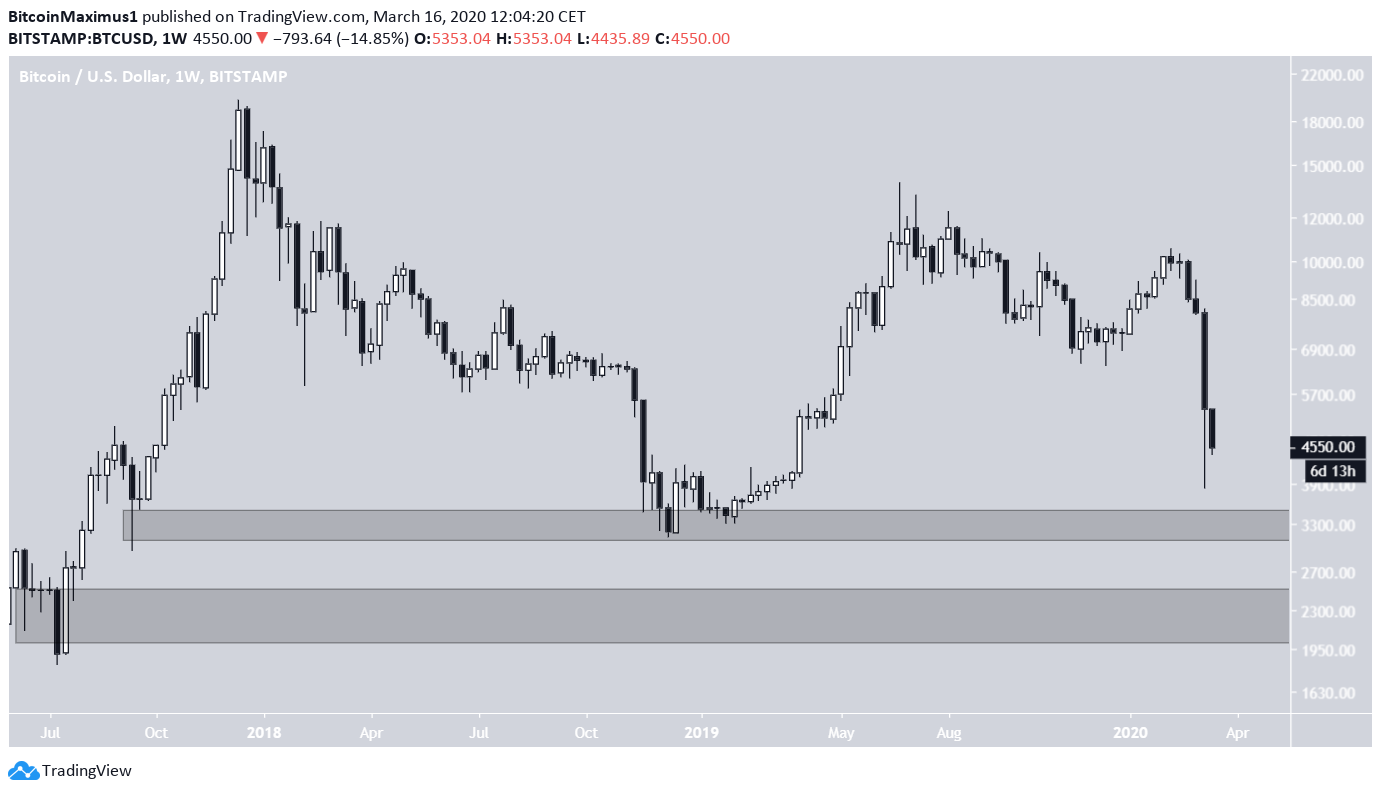
- There is support at $2,000-$2,500 and $3,000-$3,500.
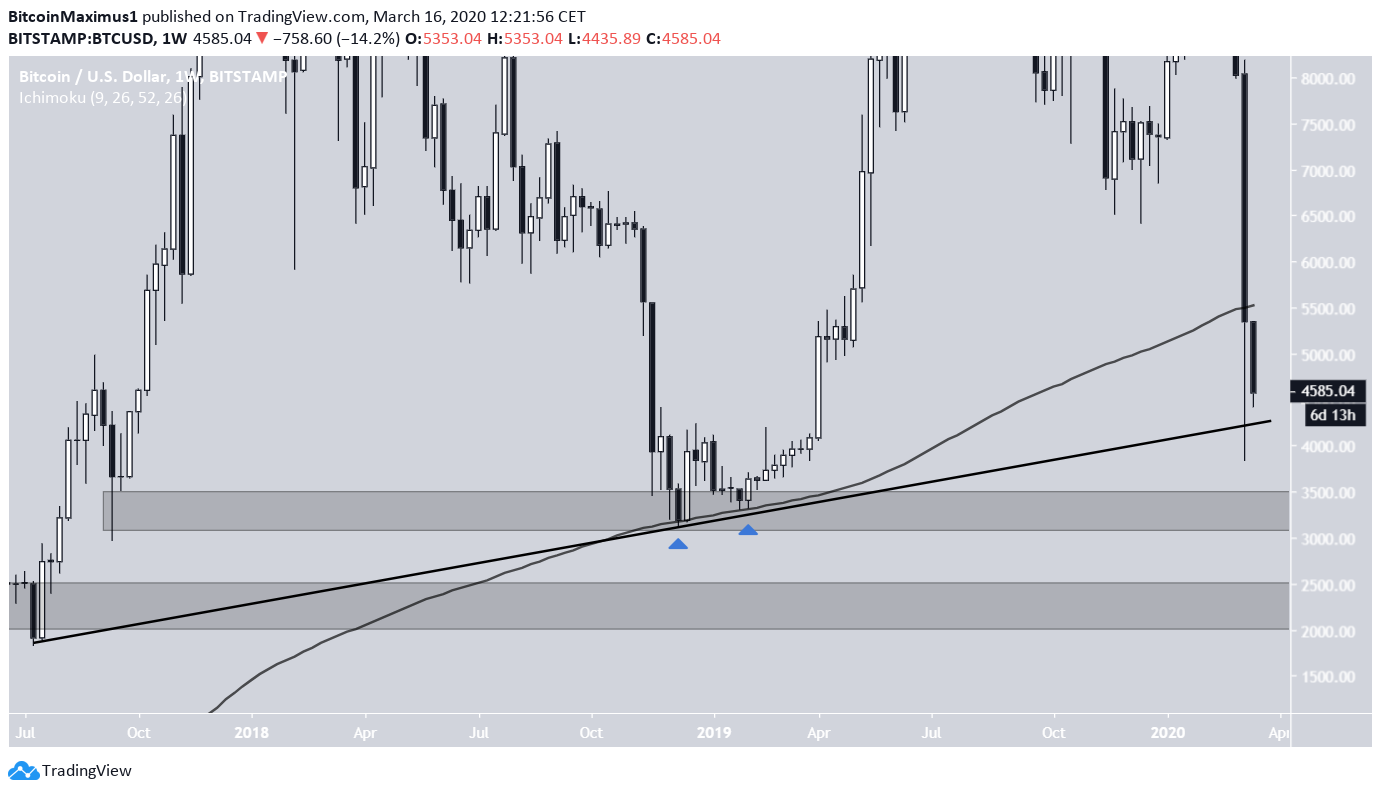
- The price has decreased below its 200-week moving average (MA).
- BTC is possibly following an ascending support line.
- The weekly RSI is almost at its lowest ever level.
Bitcoin and altcoin trader @TheEuroSniper tweeted a BTC chart stating that he has buy orders set in the $2,000-$2,500 area and he is waiting for the price to drop to his target.
My spot buys are in Grey. pic.twitter.com/bkBWwHDLLb
— €uroSniper (@TheEuroSniper) March 16, 2020
Will the Bitcoin price reach the target, or will it reverse prior to doing so? Continue reading below if you are interested in finding out.
Support Area
There are two main support areas, which are very similarly created. Both of the them initially generated a long lower wick before the price revisited the area, using it as a spring for the ensuing upward movement.
The $2,000-$2,500 area was reached for the last time during the lows of July 2017, prior to the entire upward move that led to the all-time high. The price initially reached the area in June, creating a long lower wick. The price bounced afterward and began a six-month long upward trend.
The $3,000-$3,500 area acted as support in late September 2019, creating a long lower wick that acted as a spring. Afterward, the price revisited the same level in December 2018, accumulating slowly before beginning the move that lead to a high of $13,764 in June 2019.
Therefore, these are the two main areas that could be able to provide a reversal to the current price decrease.
Technical Indicators
Technical indicators give conflicting verdicts but highlight two strong support level above the given target of $2,000-$2,500.
Firstly, we can see that during the December 2018 bottom, besides the $3,000-$3,500 support area, the price bounced on both the 200-week moving average (MA) and this possible ascending support line that the price has been following since July 2017, when it created the lows that give us the $2,000-$2,500 area. Currently, the price has lost the MA support but still has the ascending support line.
In addition, the weekly RSI is almost at the same level (30) as in December 2018, even though the price is higher, potentially creating hidden bullish divergence. The lowest ever RSI value was 26, recorded in January 2015. Such an oversold weekly RSI value often indicates that a reversal is nearing.
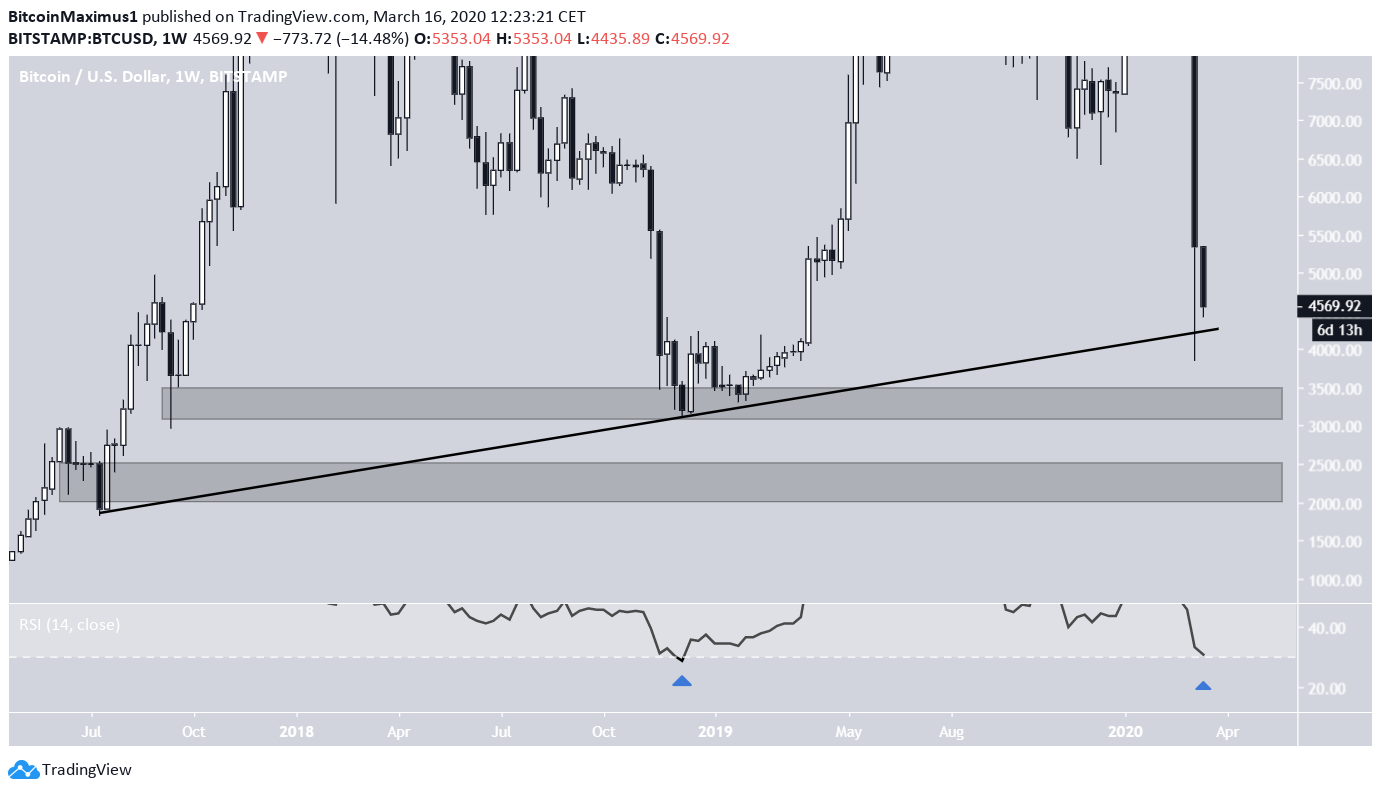
To conclude, the BTC price has reached a long-term ascending support line and bounced weakly. While we are not rejecting the possibility that the price will decrease all the way to the target at $2,000-$2,500, there are two significant support levels above it that could reverse the price. Even if the price gets there, it is likely to bounce and retest the $6,000 resistance before doing so.


