


On May 11, Bitcoin’s attempt at moving higher was rejected by the $9,150 resistance level. However, the price has reversed its trend once more and is in the process of making another attempt at breaking this resistance area.
Since the rapid decrease on May 10, which caused BTC to briefly reach a low of $8,117, the price has been gradually increasing.
Bitcoin was rejected sharply at $9,150, which is both the 0.618 Fibonacci level of the entire decrease and the 200-hour moving average (MA). However, after dropping all the way to $8,200, the price has reversed its trend and gathered strength in order to make another attempt at moving higher.
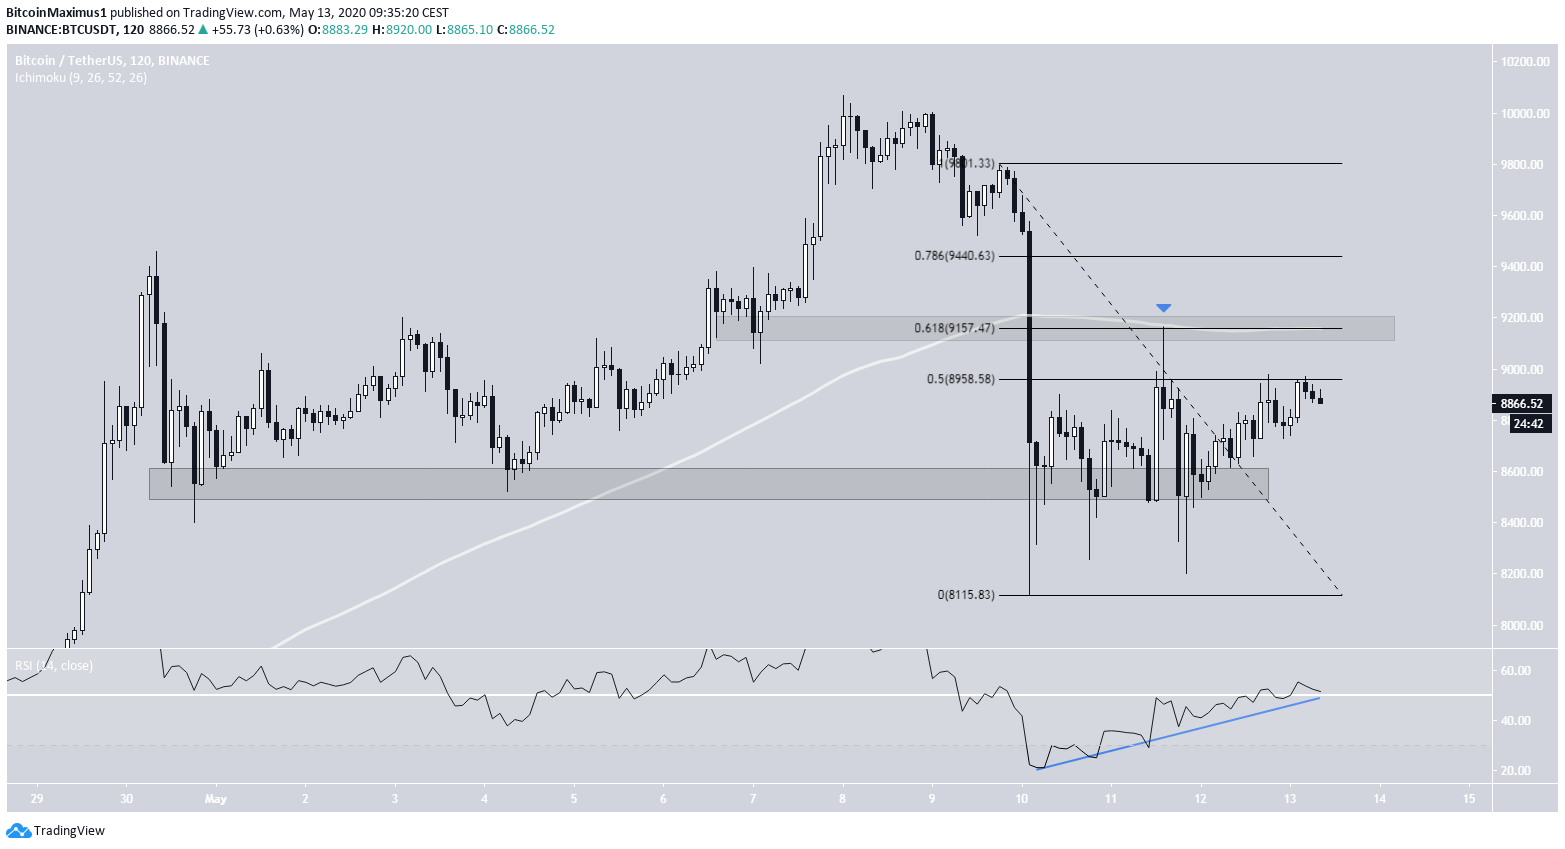
The RSI has been generating bullish divergence and has moved above 50, a sign that the price is expected to move higher. If it does so, it is likely to reach the 0.786 Fib level at $9,450. This would still be considered a retracement in response to the decrease rather than the beginning of a new upward move.
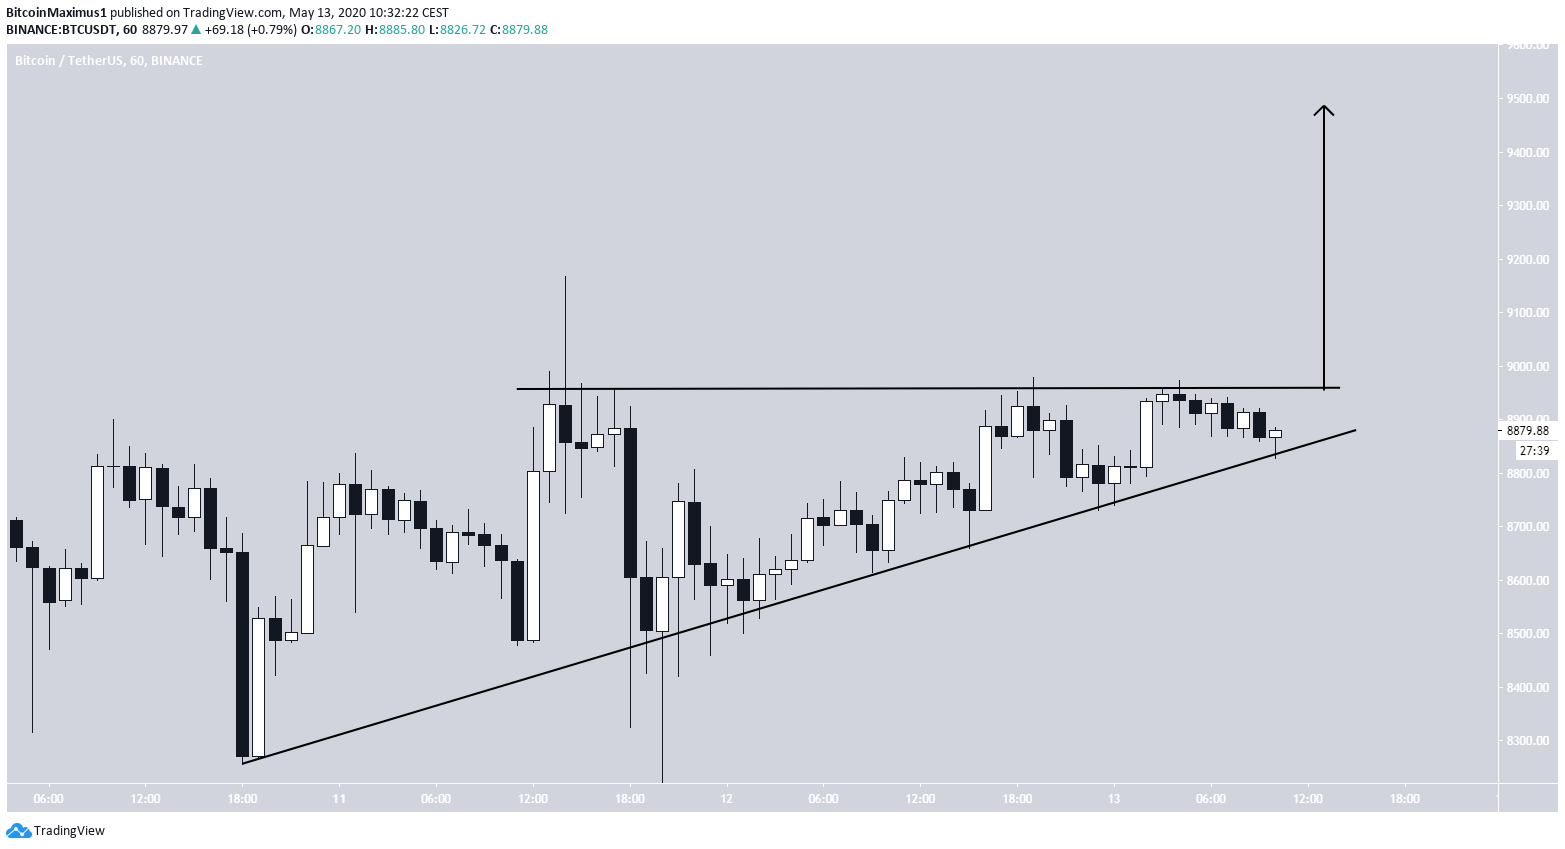
Lower time-frames also support this possibility since they show that an ascending triangle has been created. This is known as a bullish pattern that makes it more likely that the price will break out.
A movement that travels the entire height of the pattern would take the price all the way to the next resistance area at $9,450.
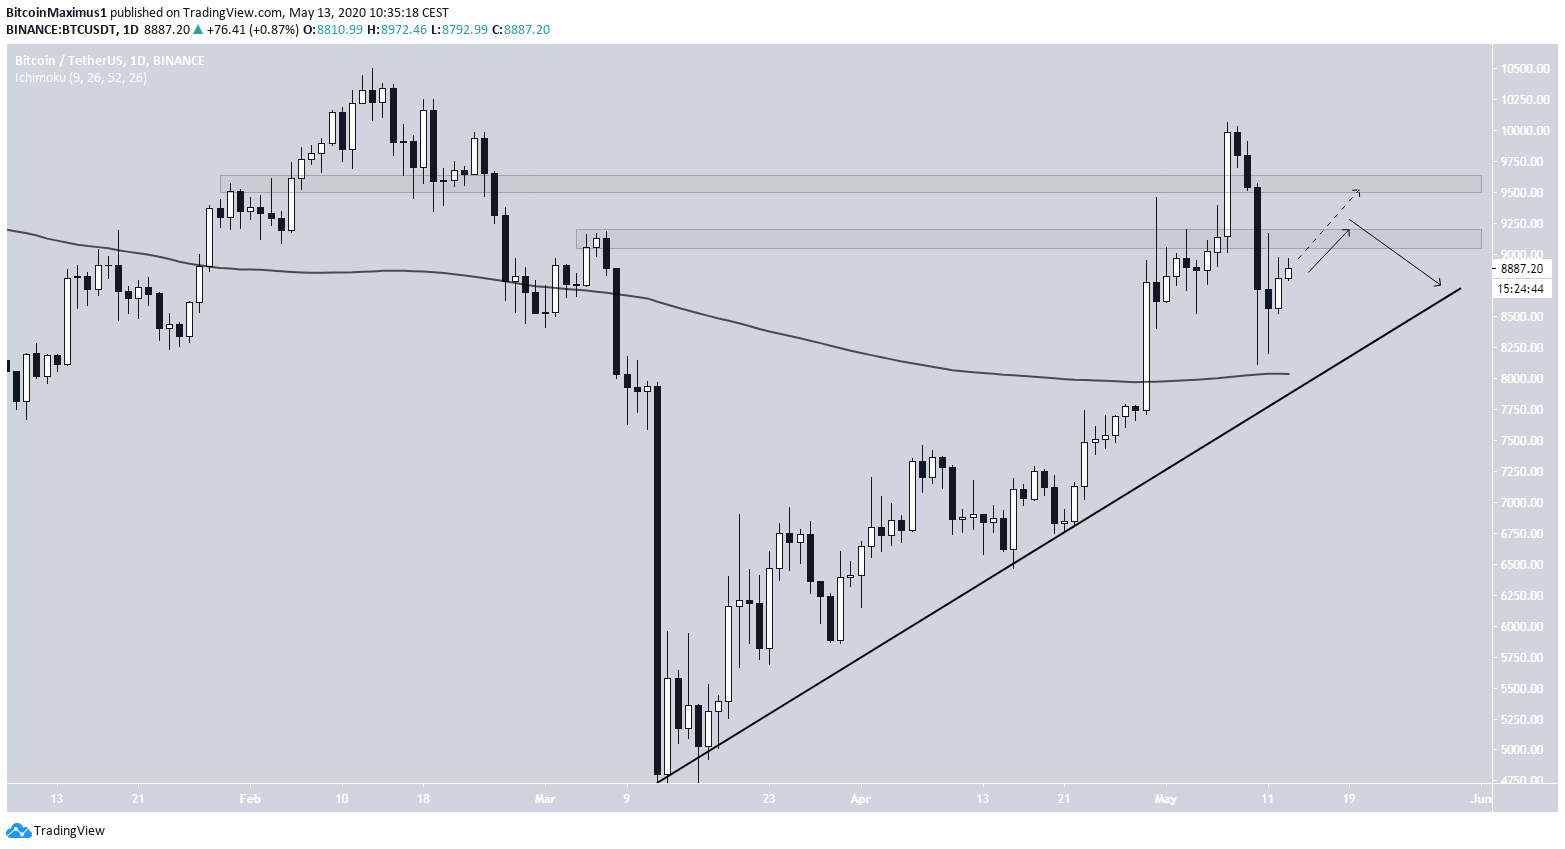
Bitcoin’s Ascending Support Line
In the longer-term, we can see that the Bitcoin price has been following an ascending support line since reaching a bottom on March 13.
A very interesting takeaway is that the previous movements above two major resistance levels found at $9,000 and $9,500, and the subsequent failure to sustain these higher prices, are now likely to act as resistance.
Therefore, the Bitcoin price is expected to increase to around $9,500 before returning to validate the ascending support line and possibly the 200-day MA.
To conclude, the Bitcoin price seems to be gathering strength. Another upward move above the current resistance level is likely to take the price to $9,450, after which a corrective period is expected.
For those interested in BeInCrypto’s previous Bitcoin analysis, click here.


