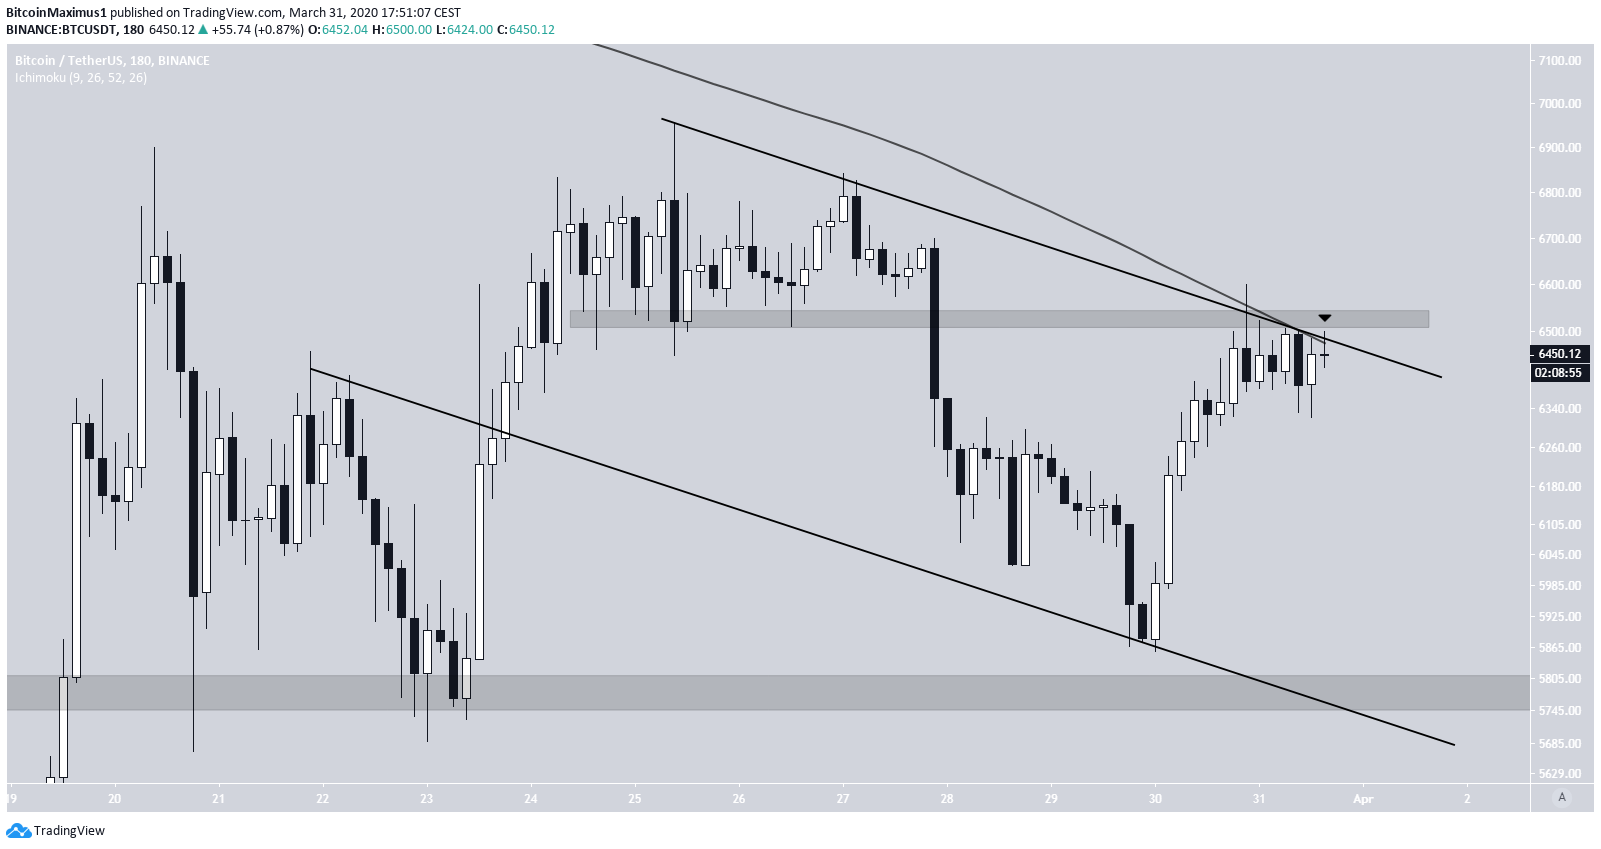
On March 30, the BTC price reached a low of $5,857. It has been rapidly increasing since. However, the rally has stalled at $6,500, and while the price has made numerous attempts at breaking out, they have all been ultimately unsuccessful.
However, since breaking down from its previous pattern on March 25, the BTC price is not clearly following a trading structure. Well-known trader @CryptoNewton took a stab at outlining one when he tweeted a BTC chart with the caption, “send it home.” Judging by the descending channel he has drawn, this suggests that the price is likely to head lower.
Let’s take a closer look at the BTC price movement and determine if it is more likely to move upward or downward.$BTC send it home https://t.co/6TEYUoiEUG pic.twitter.com/vH9hGuEt9U
— 👑 Shelby 👑 (@CryptoNewton) March 31, 2020
Descending Channel
At the time of writing, the BTC price was trading very close to a confluence of resistance levels:- The $6,500 resistance area.
- The 25-day moving average (MA).
- The descending resistance line of the channel.

Short-Term Movement
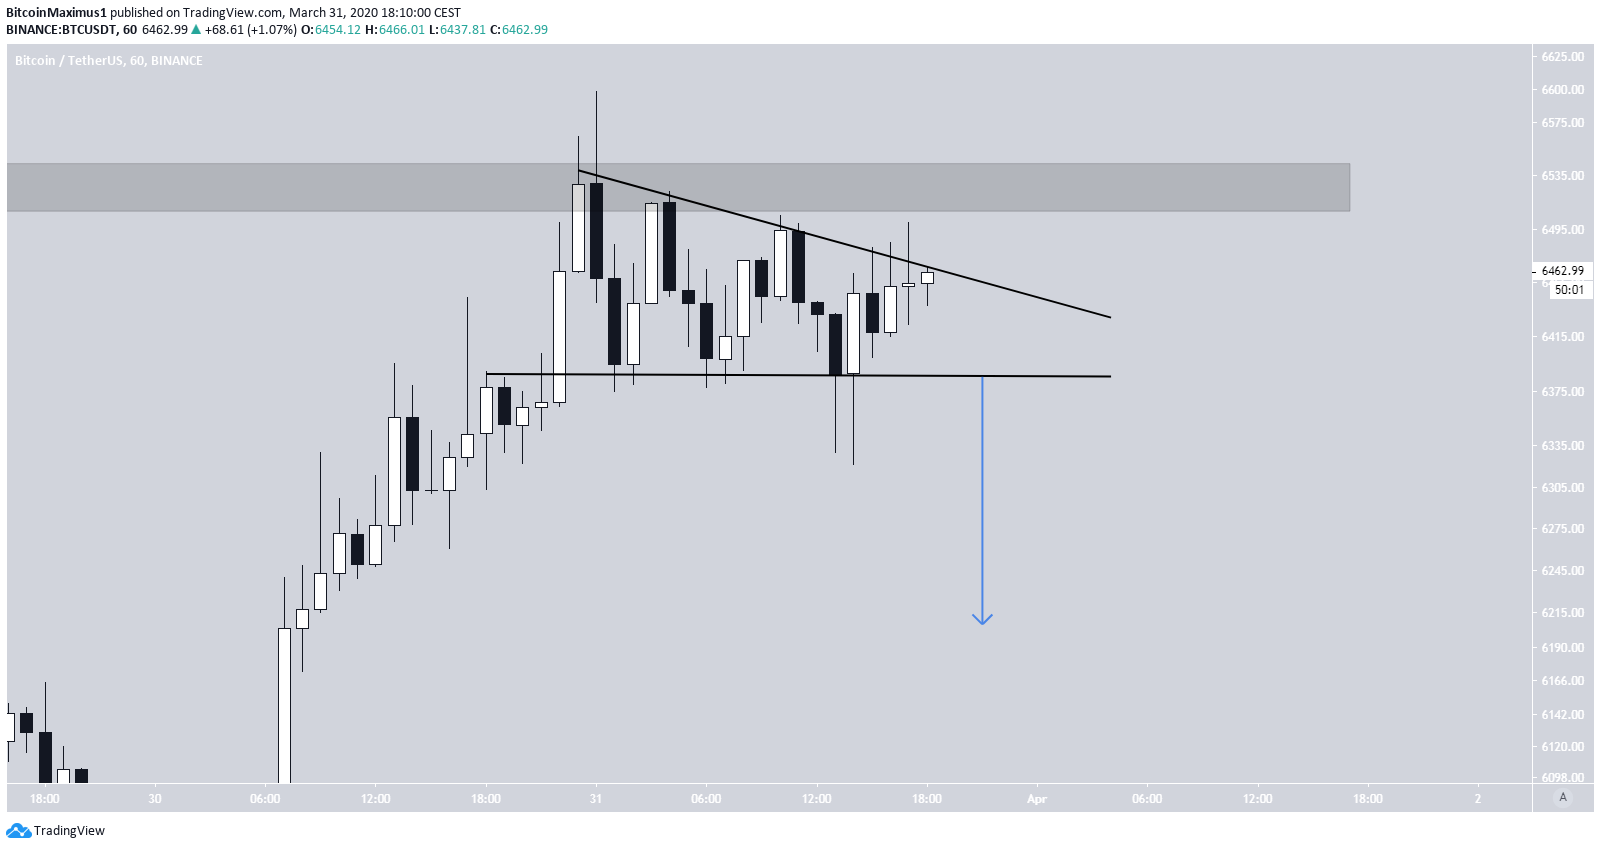
In the short-term, it looks as though the price is trading inside a descending triangle. A breakdown from this pattern that travels the entire height of the triangle would take the price all the way down to $6,200, making this an intermediate target if this decrease transpires.
Disclaimer
In line with the Trust Project guidelines, this price analysis article is for informational purposes only and should not be considered financial or investment advice. BeInCrypto is committed to accurate, unbiased reporting, but market conditions are subject to change without notice. Always conduct your own research and consult with a professional before making any financial decisions. Please note that our Terms and Conditions, Privacy Policy, and Disclaimers have been updated.

Valdrin Tahiri
Valdrin discovered cryptocurrencies while he was getting his MSc in Financial Markets from the Barcelona School of Economics. Shortly after graduating, he began writing for several different cryptocurrency related websites as a freelancer before eventually taking on the role of BeInCrypto's Senior Analyst.
(I do not have a discord and will not contact you first there. Beware of scammers)
READ FULL BIO
Sponsored
Sponsored
