


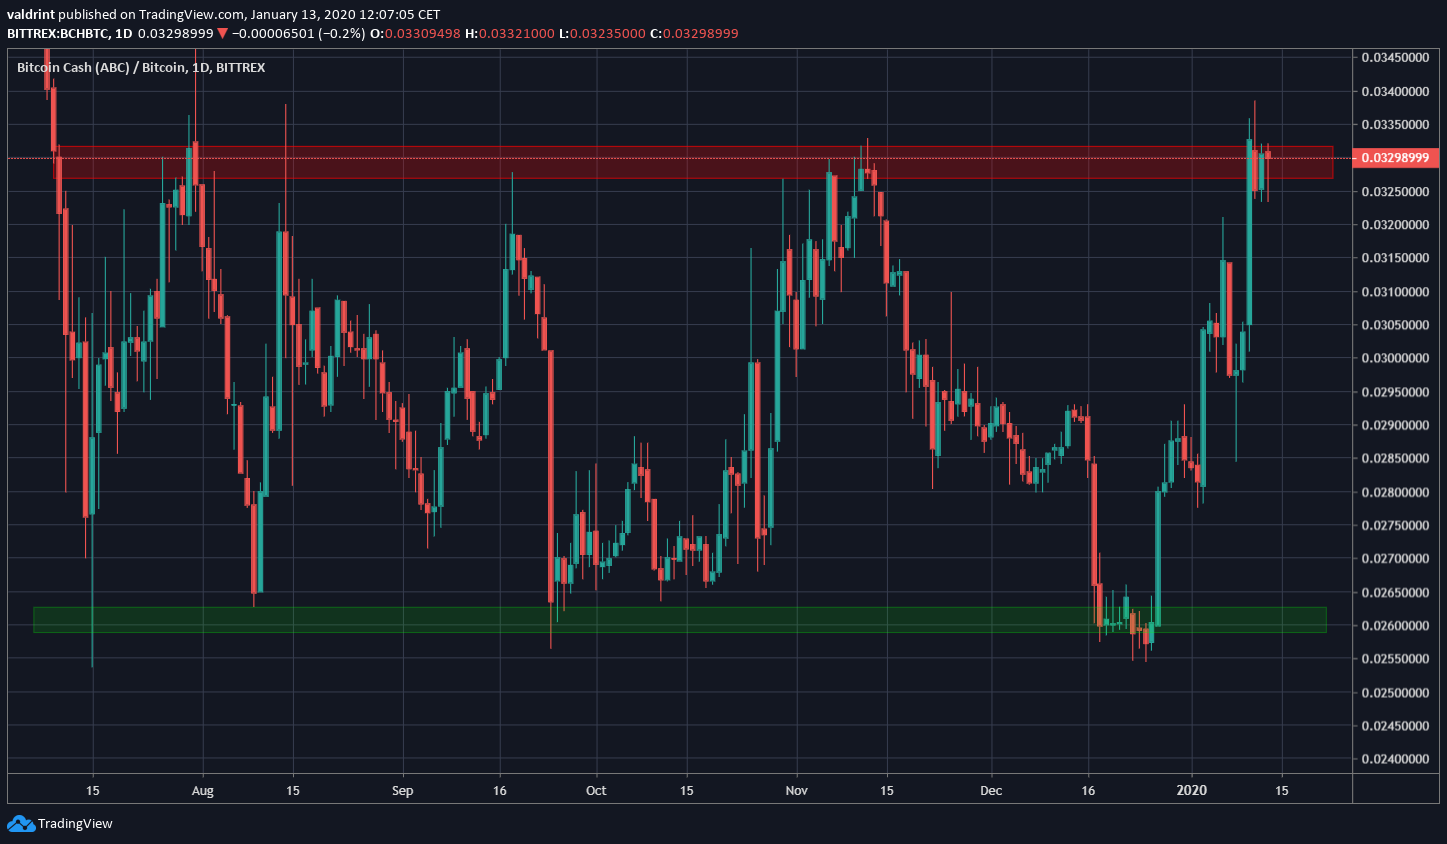
In the period from December 26 to January 10, the Bitcoin Cash (BCH) price increased by 30 percent, reaching the resistance of the trading range inside — which it has been trading inside for the past six months.
However, the bullish momentum has stalled since and the BCH price has been consolidating inside this resistance area, failing to break out above it.
Trader @imBagsy outlined a BCH price chart, giving four reasons why he is bullish. The reasons are:
- Proximity to halving.
- Fourth touch of the resistance area.
- Significant bullish divergence.
- Growing in volume.
To expand my bullish thought process:
1) Halving coming up (May 24th)
2) 4th tap of horizontal resistance
3) Massive bullish divergences on HTF
4) Volume growingI'm prepared for a pullback into 0.031 with additional bids. pic.twitter.com/0v4iDzYvsI
— Bagsy (@Bagsy) January 12, 2020
Bitcoin Cash Trading Range
The BCH price has been trading in a range between ₿0.026 and ₿0.033 for the past 187 days, since July 9. It reached the support area on December 26 and began a bullish move that transpired in three upward intervals, taking it to the resistance area on January 10.
We stated that the Bitcoin Cash price will reach this resistance area in our previous analysis and discussed the possibility of the price breaking out.
Current Breakout
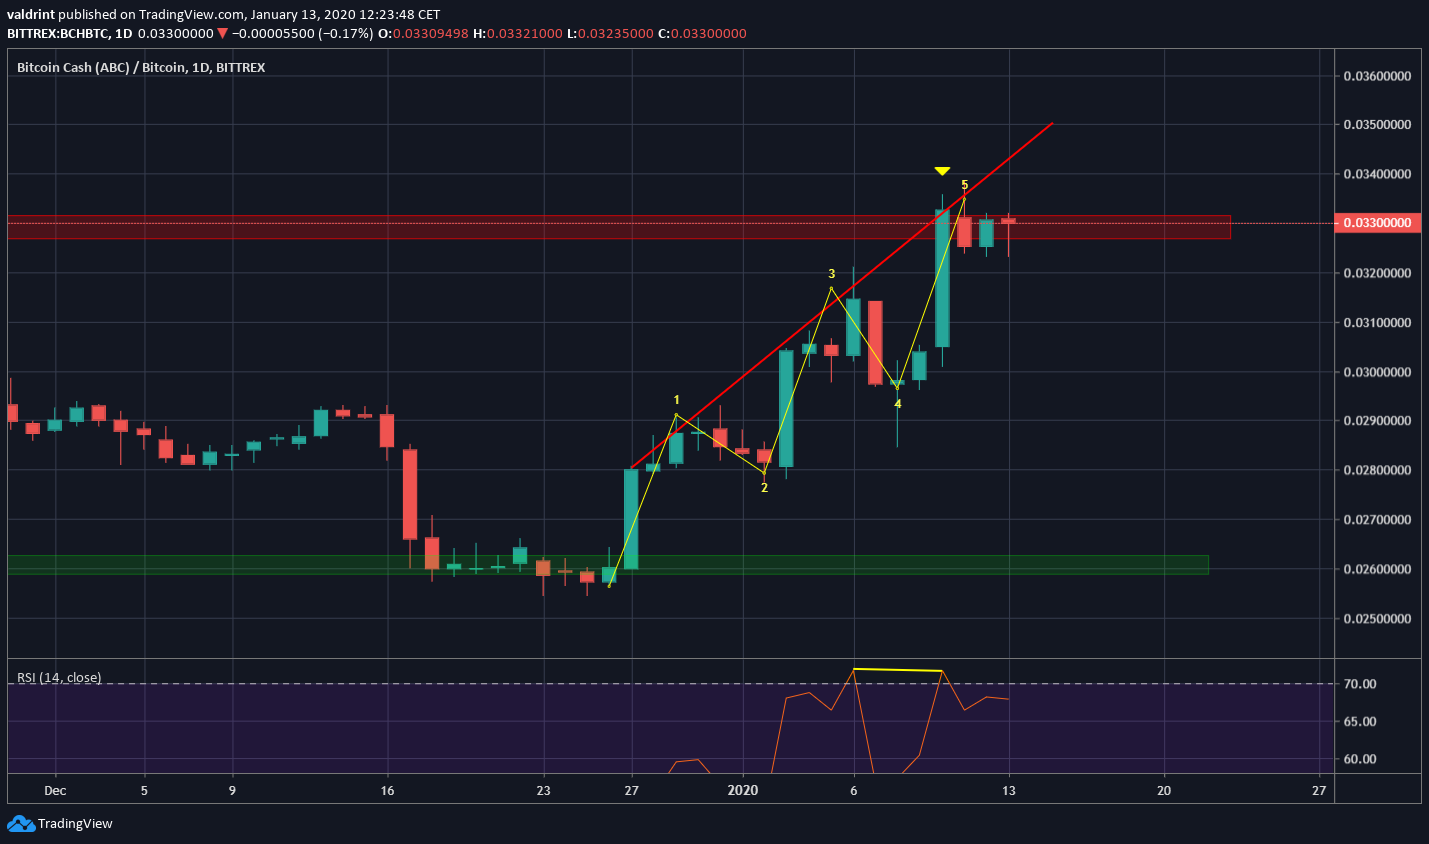
The upward move beginning on December 26 has transpired in five waves, three of which have been upward while two of them corrective. The most common price action after this type of upward movement is an A-B-C correction. The possibility of correction is strengthened due to a variety of factors such as the ascending resistance line, horizontal resistance area, and bearish divergence in the daily RSI.
However, the January 10 candlestick was a bullish engulfing and the price has not created any reversal candlesticks since. In addition, even if a correction transpired, it will likely be a short-term retracement inside a longer-term upward move.
Therefore, attempting to initiate a short at the current level would be counter-trend trading, since we believe the longer-term trend is bullish.
Nevertheless, we will still outline this possibility. The area which is expected to offer support after this hypothetical correction is found at ₿0.03. So, the BCH price could increase to a maximum of ₿0.035 before correction to our support area. The creation of a bearish candlestick, such as the shooting star, would confirm that the price will reverse.
On the other hand, an increase above ₿0.035 would likely mean that the price has broken out and will continue increasing without experiencing a retracement.
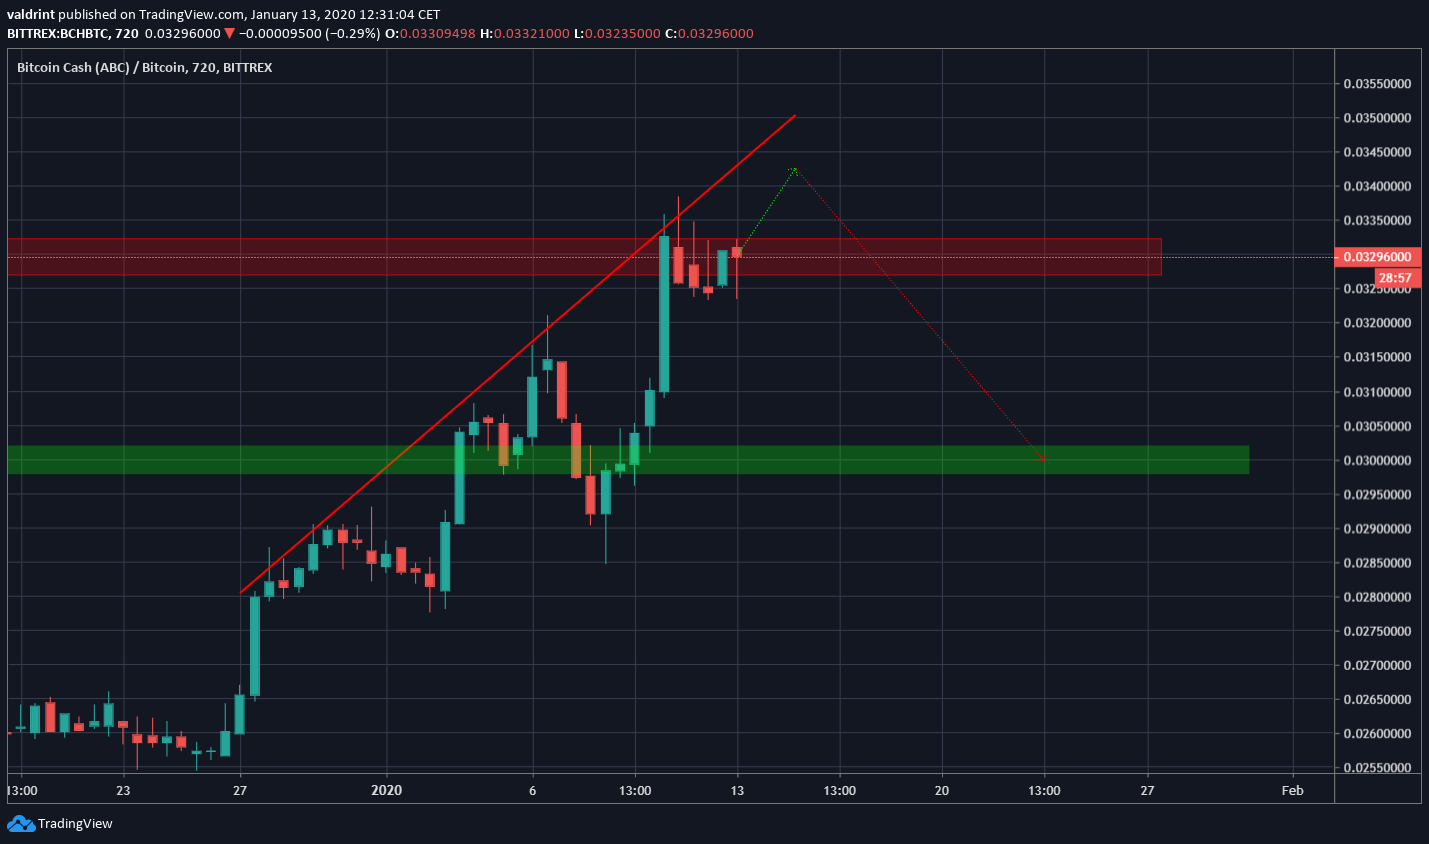
To conclude, the BCH price has reached a significant resistance area. We believe the price will eventually break out and head towards ₿0.065. Prior to the breakout, we are not discounting the possibility of a short-term correction towards ₿0.03.
