
On March 25, the Bitcoin dominance rate reached a high of 67.99%, well into an important resistance level. However, it was rejected sharply and has been decreasing ever since.
A falling BTC dominance rate indicates that altcoins are surging or decreasing at a slower rate than Bitcoin. Recently, we have seen several altcoins surge upwards. In order to determine if this is an occurrence in the wider altcoin market, stocks and BTC trader @FeraSY1 outlined a Bitcoin dominance chart which shows that the price has broken down below a long-term ascending support line. He suggests that this will have a positive effect on the price of altcoins, which are expected to go up.
#Bitcoin Dominance HTF Structure
We Can say obviously that #BTC Dominance has broken 2 years uptrend + successful bearish Retest of this Major uptrend
Next Key Levels are 61/53/50 %What does it mean? This has Direct #Bullish impact on Alts
Mainly Majors & Mid Caps Vs. Bitcoin pic.twitter.com/PbiopPnKwQ— Crypto Feras (@CryptoFeras) April 8, 2020
Below, we will take a look at the Bitcoin dominance rate chart in different time-frames in order to determine if the rate is likely to fall and its impact on the price of altcoins.
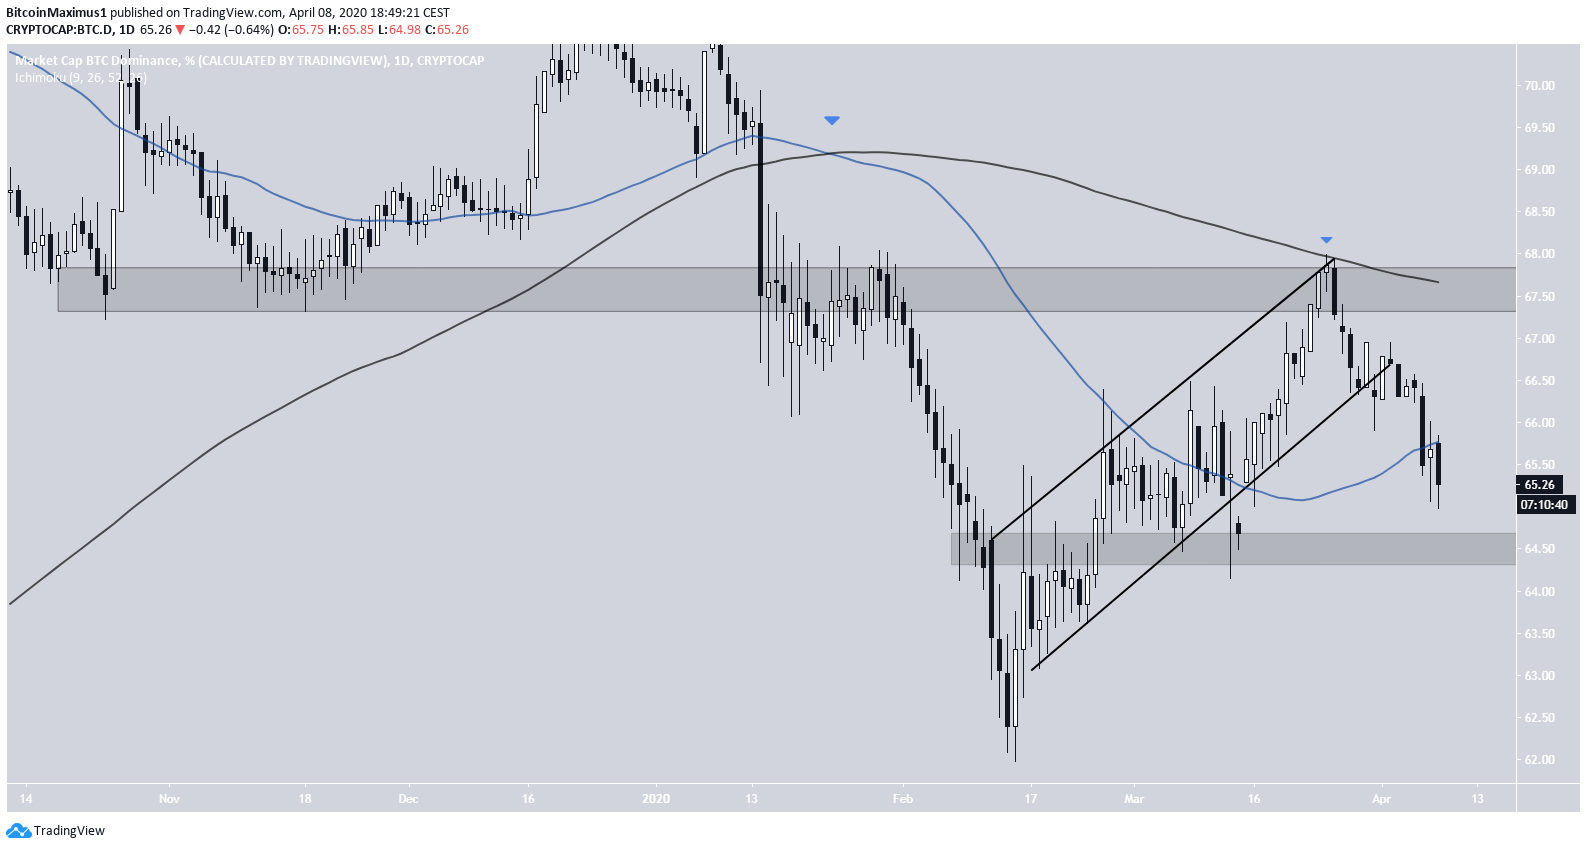
Rejection From Resistance
The Bitcoin dominance rate had been increasing inside an ascending channel since February 11. On March 25, the BTC dominance rate reached a high of 67.99% and decreased swiftly.
The rejection from this level was important for several reasons:
- This area acted as support throughout October/November 2019.
- After the price broke down, it turned into resistance in January 2020.
- It coincides with the 200-day moving average (MA).
Therefore, a swift rejection is indicative that the rate failed to initiate a bullish trend. Now, the rate is likely to attempt to find support at the closest level at 64.5%.
Long-Term View
The weekly chart reveals that the price has broken down from a long-term ascending support line and validated it as resistance afterwards. This view is strengthened by the fact that the rate was rejected by the 200-week MA thrice prior to the price breaking down. The final time, it created a shooting star weekly candlestick, which often indicates a trend reversal. So far, it has created three consecutive lower highs.
The most important support level is at 62.5%, which marks the wick low of Feb 10-17. If the rate decreases below it, it could fall all the way to 52.5%, levels not seen since April 2019.
Previously, the rate traded inside this range from September 2018 to April 2019, a period which was very profitable for altcoins. If the price falls within this range once more, it is possible that it would have a similar effect.
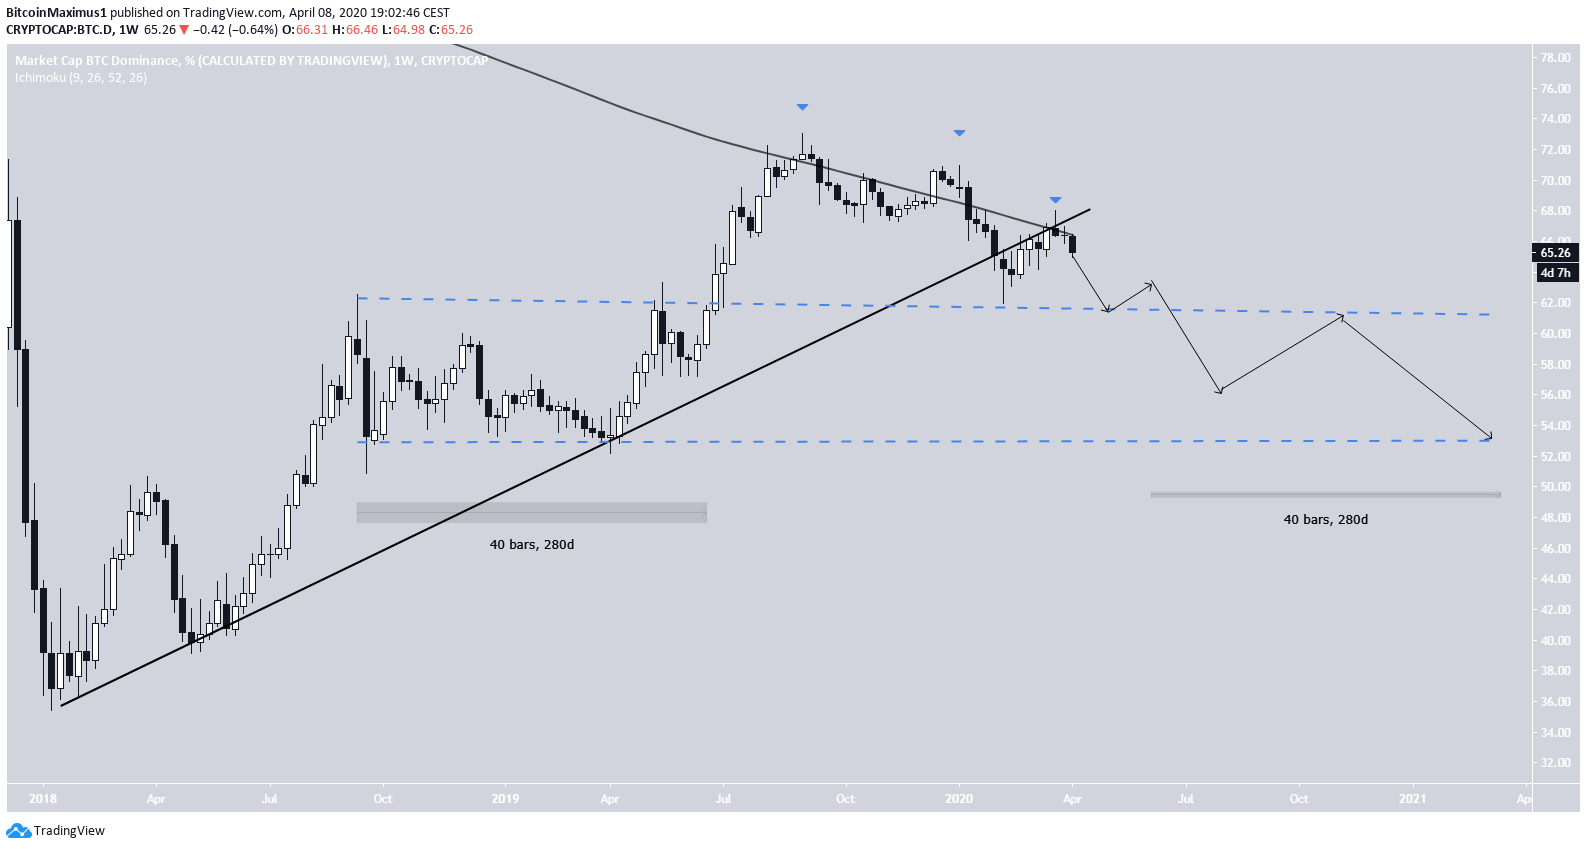
To conclude, the Bitcoin dominance rate has broken down below a very significant ascending support line and validated it as resistance afterwards. The strength of the rejection indicates that the rate could drop further, possibly falling inside the 52.5-62.5% channel.
