
Cardano (ADA) has been falling since May 16 but is still trading above the horizontal support area at $1.
Despite the bullish re-test, technical indicators in multiple time-frames are firmly bearish.
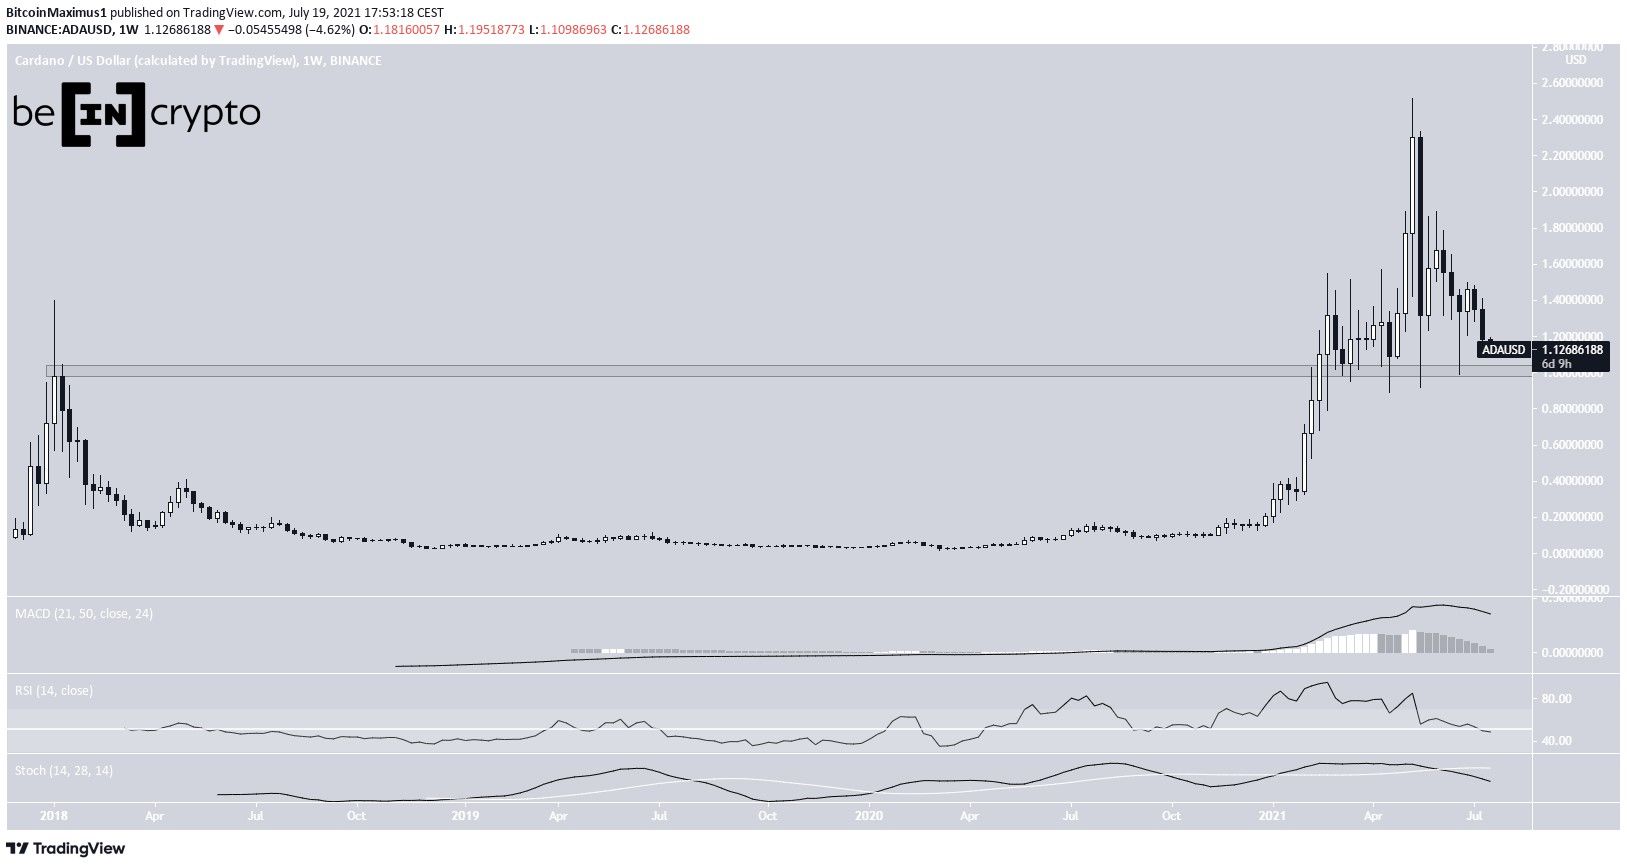
Long-term ADA structure
ADA has been moving downwards since reaching a high of $2.51 on May 16. So far, it has dropped to a low on $1.01, doing so on May 19. The token bounced immediately, creating a long lower wick.
The bounce served to validate the $1 area as support. This is an important area since it previously acted as resistance during the 2018 all-time high.
Despite still being above support, technical indicators are firmly bearish. The MACD is decreasing, nearly crossing into negative territory. The RSI is below 50 and the Stochastic oscillator has made a bearish cross.
Therefore, it is likely that the long-term trend is still bearish.
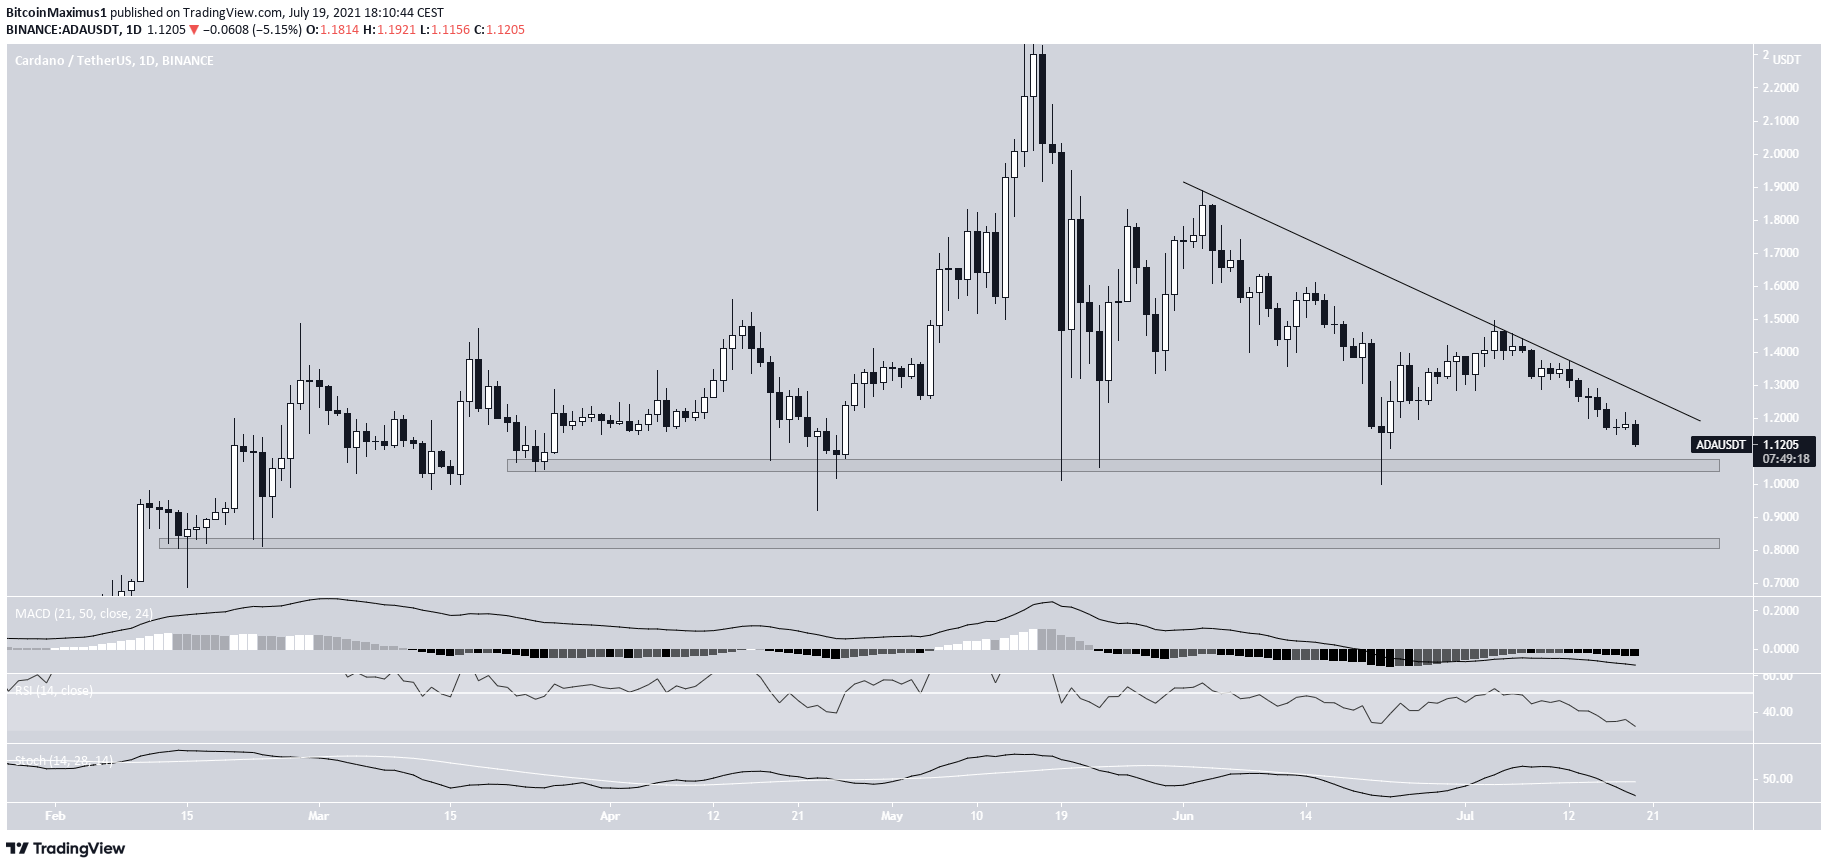
Current structure
The daily chart does not provide a clearly discernible structure. It seems that ADA is following a descending resistance line, and there is a potential horizontal support level at $1.05, close to the previously outlined long-term support.
Combined with the descending resistance line, it creates a descending triangle, which is considered a bearish pattern. In addition to this, technical indicators in the daily time-frame are bearish, providing nearly identical readings to those in the weekly time-frame.
If a breakdown occurs, the next support area would be at $0.82.
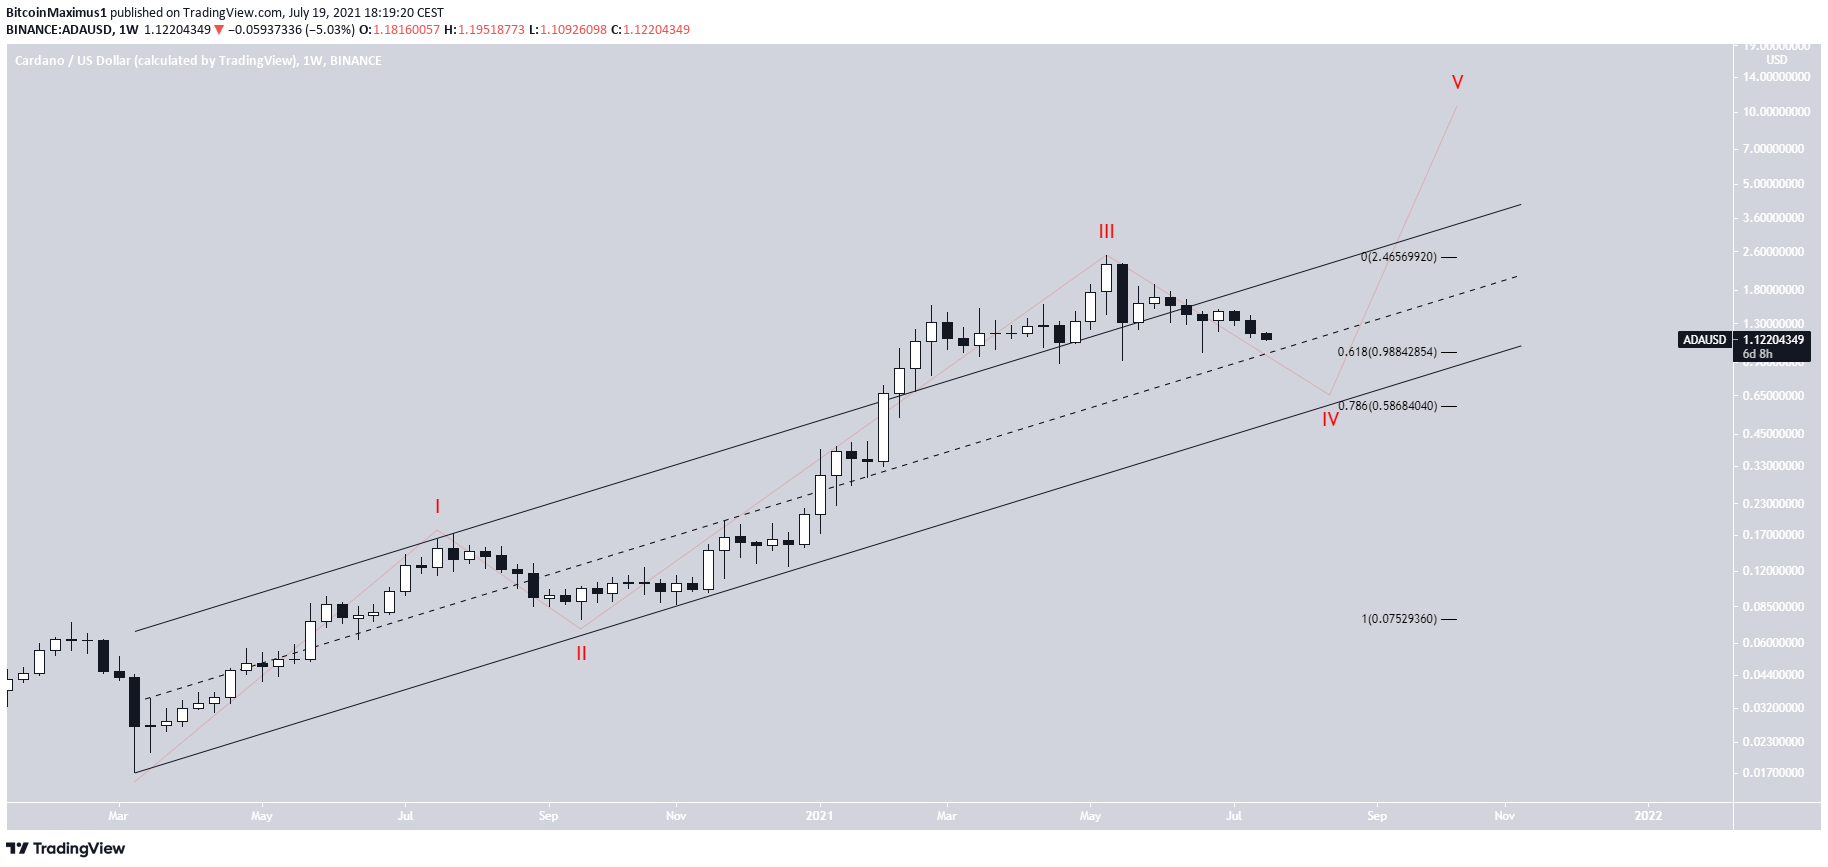
Wave count
Cryptocurrency trader @Mesawine1 outlined an ADA chart, stating that another drop is expected, which would complete wave four.
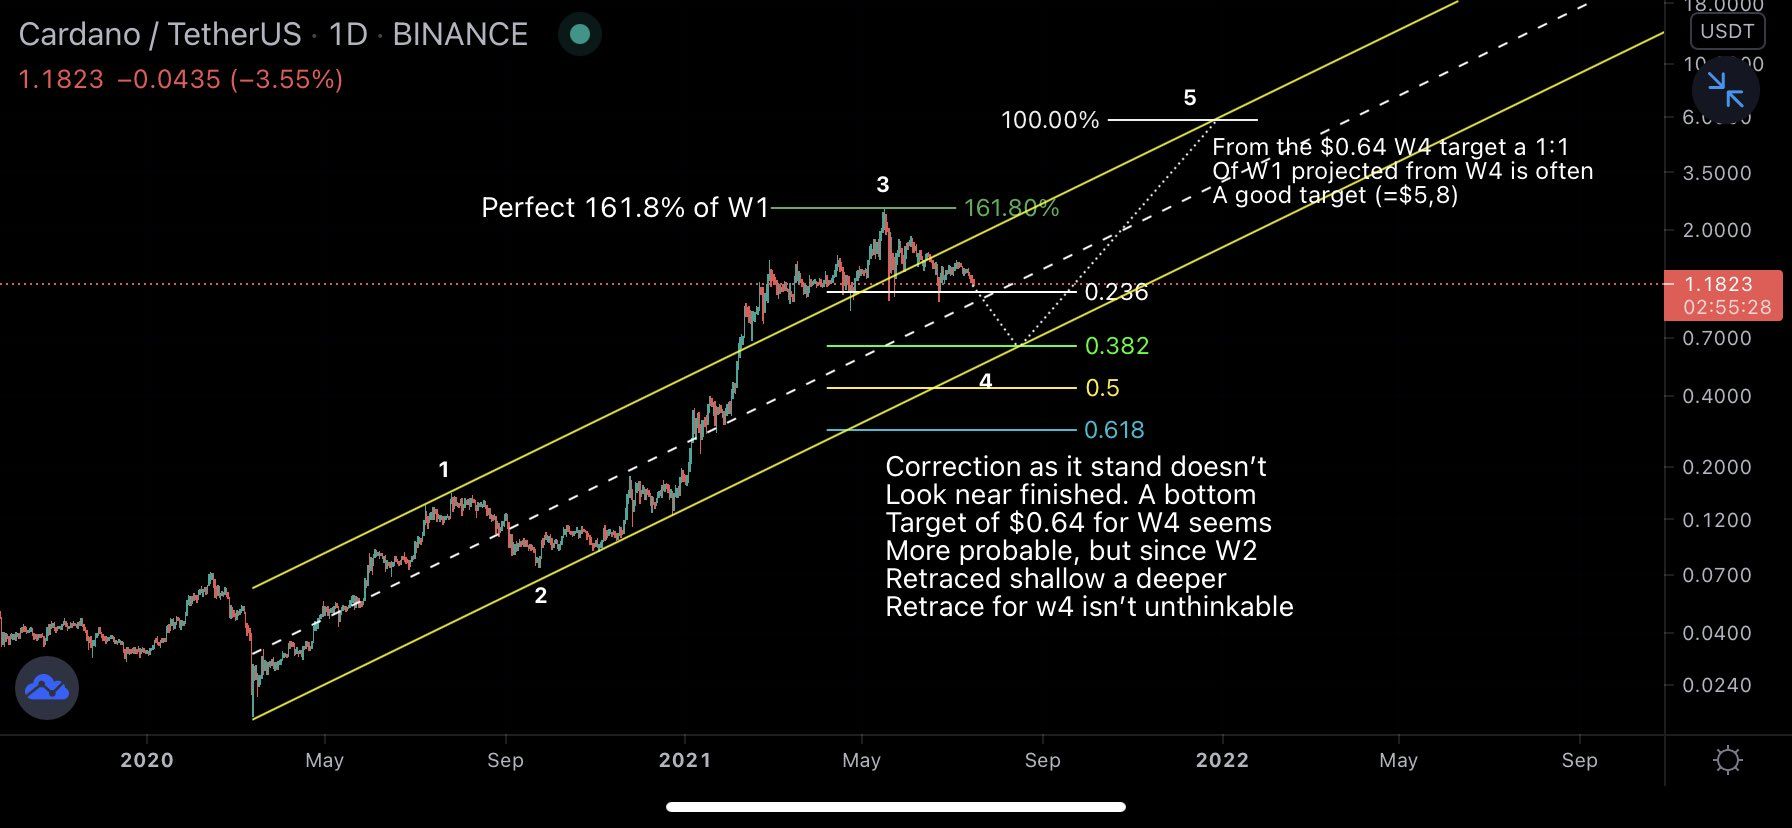
It does seem that ADA is in wave four (red) of a bullish impulse that began on March 2020. If so, it is currently completing a fourth wave pullback.
The $0.98 area is a decent level for the bottom to be made. As seen in the first section, it is a horizontal support area. In addition to this, it is the 0.618 Fib retracement support level of wave three, and it is in the middle of the parallel channel.
However, due to the bearish readings, a drop towards the $0.60 area seems more likely. This would be the 0.786 Fib retracement support level and the support line of the channel.
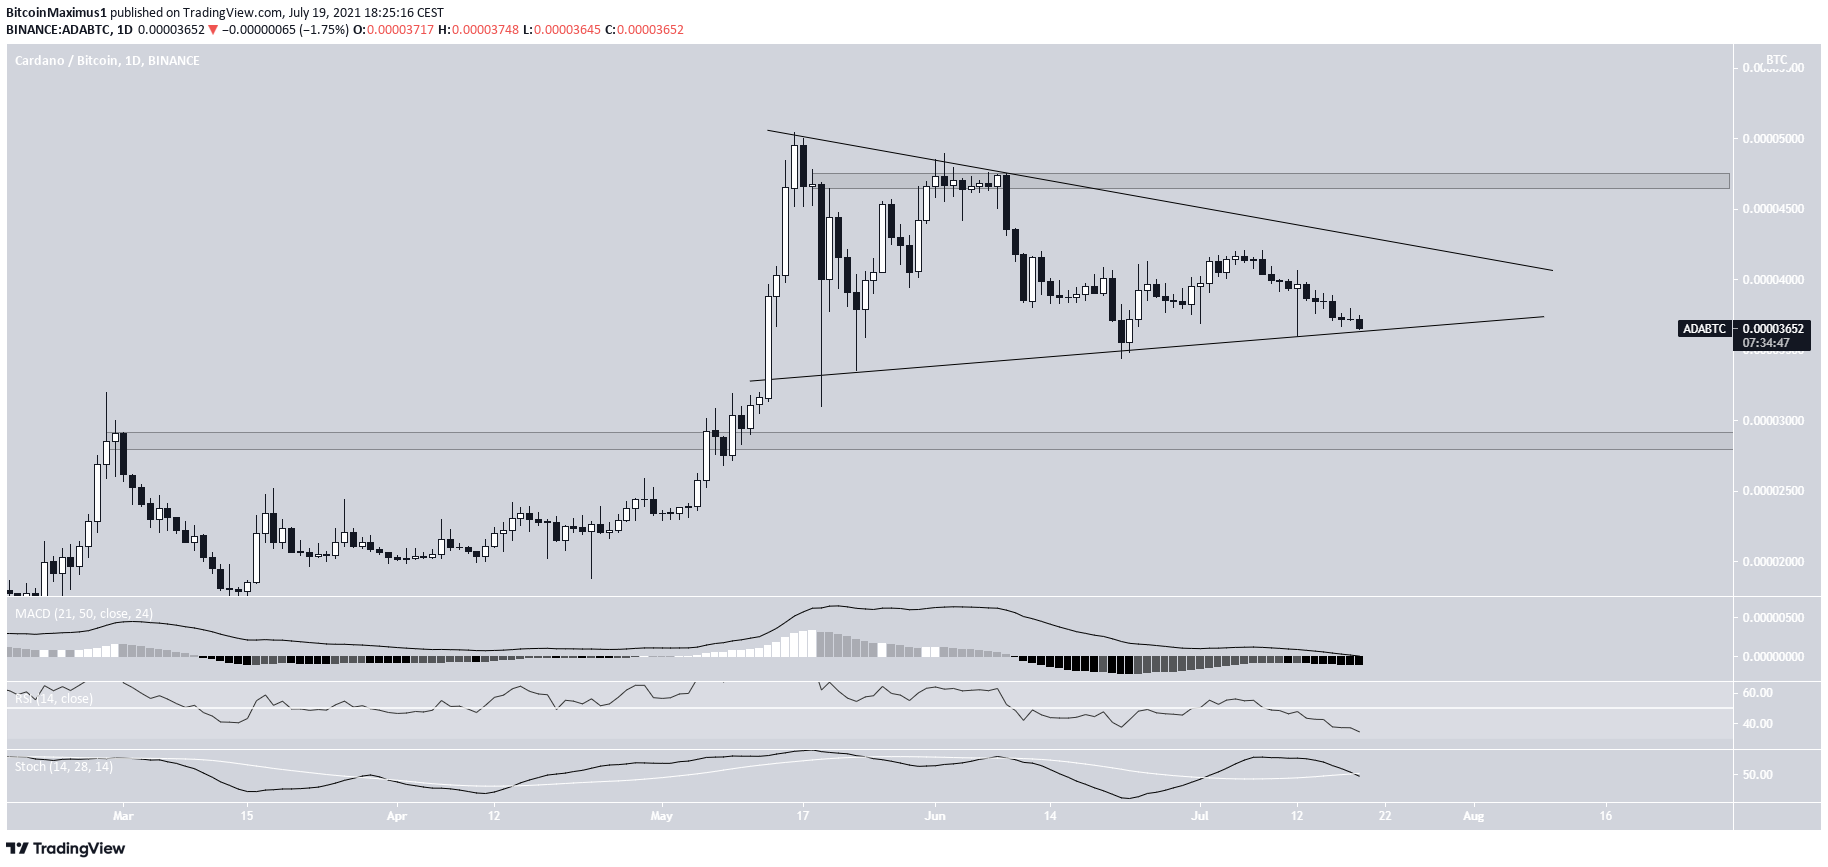
ADA/BTC
The ADA/BTC chart is slightly more bullish than its USD counterpart. While the token has been moving downwards since May 19, it is trading inside a symmetrical triangle.
Currently, it is right at the support line of the pattern. While the symmetrical triangle is considered a neutral pattern, it is coming after an upward movement. Therefore, a breakout would be more likely.
Despite this, technical indicators are bearish, providing mixed readings alongside the price action.
The closest resistance and support levels are at 4,700 and 2,850 satoshis.
For BeInCrypto’s latest bitcoin (BTC) analysis, click here.
