


The Aave (AAVE) price is currently attempting to break out above the $83 resistance area, which, if successful, would take the price towards a new all-time high.
While a short-term retracement could occur, AAVE is likely moving higher.
AAVE Approaches All-Time High
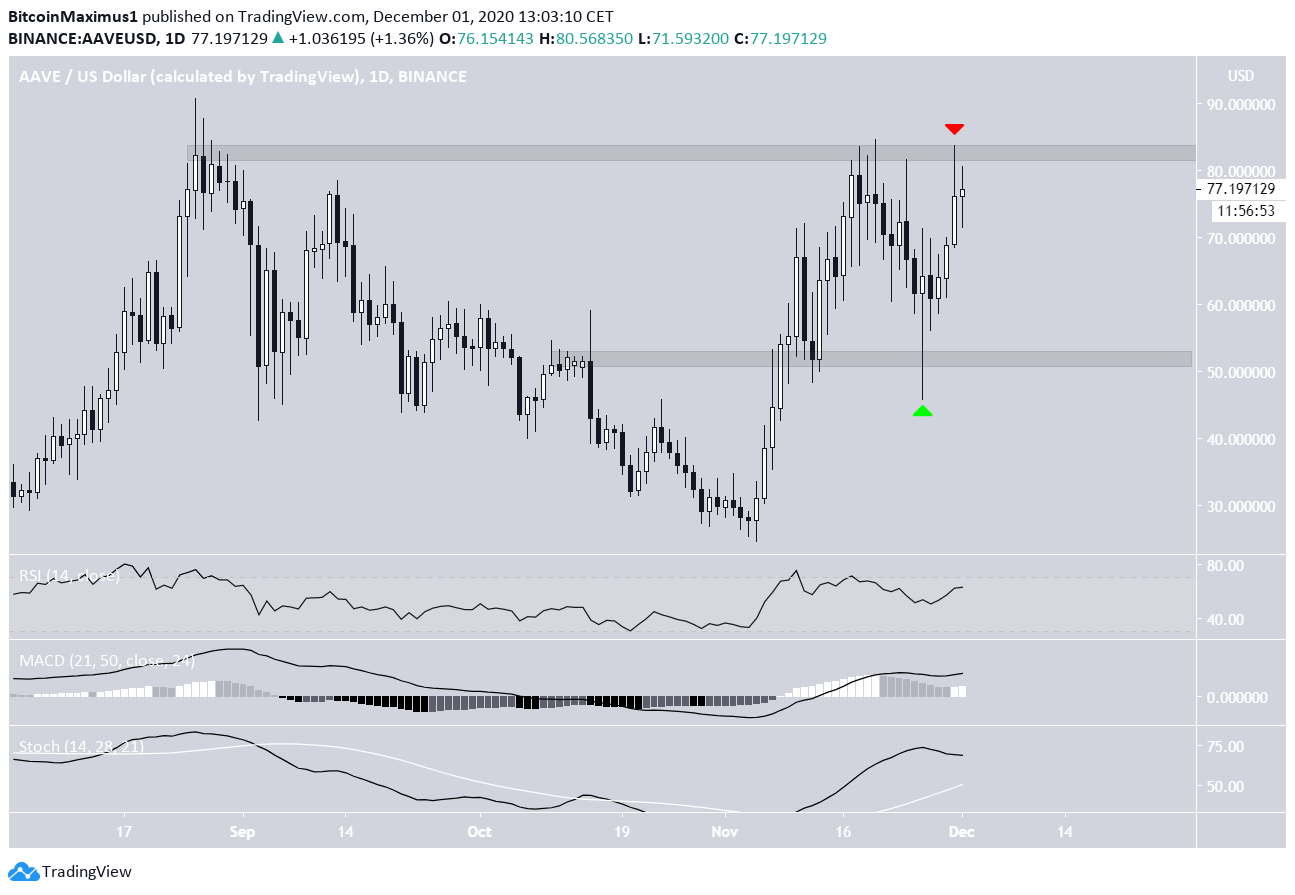
The AAVE price has been moving upwards since it reached a low of $24.66 on Nov 5. AAVE reached a high of $84.71 on Nov. 20, barely missing its all-time high (ATH) price, before decreasing sharply.
However, the decline only served to validate the $62 area as support since the price created a very long upper wick and has been moving upward since.
Technical indicators are bullish and support the continuation of the upward move. If the price were to break out above the $83 resistance area, there is virtually no more resistance until the $90.83 high.
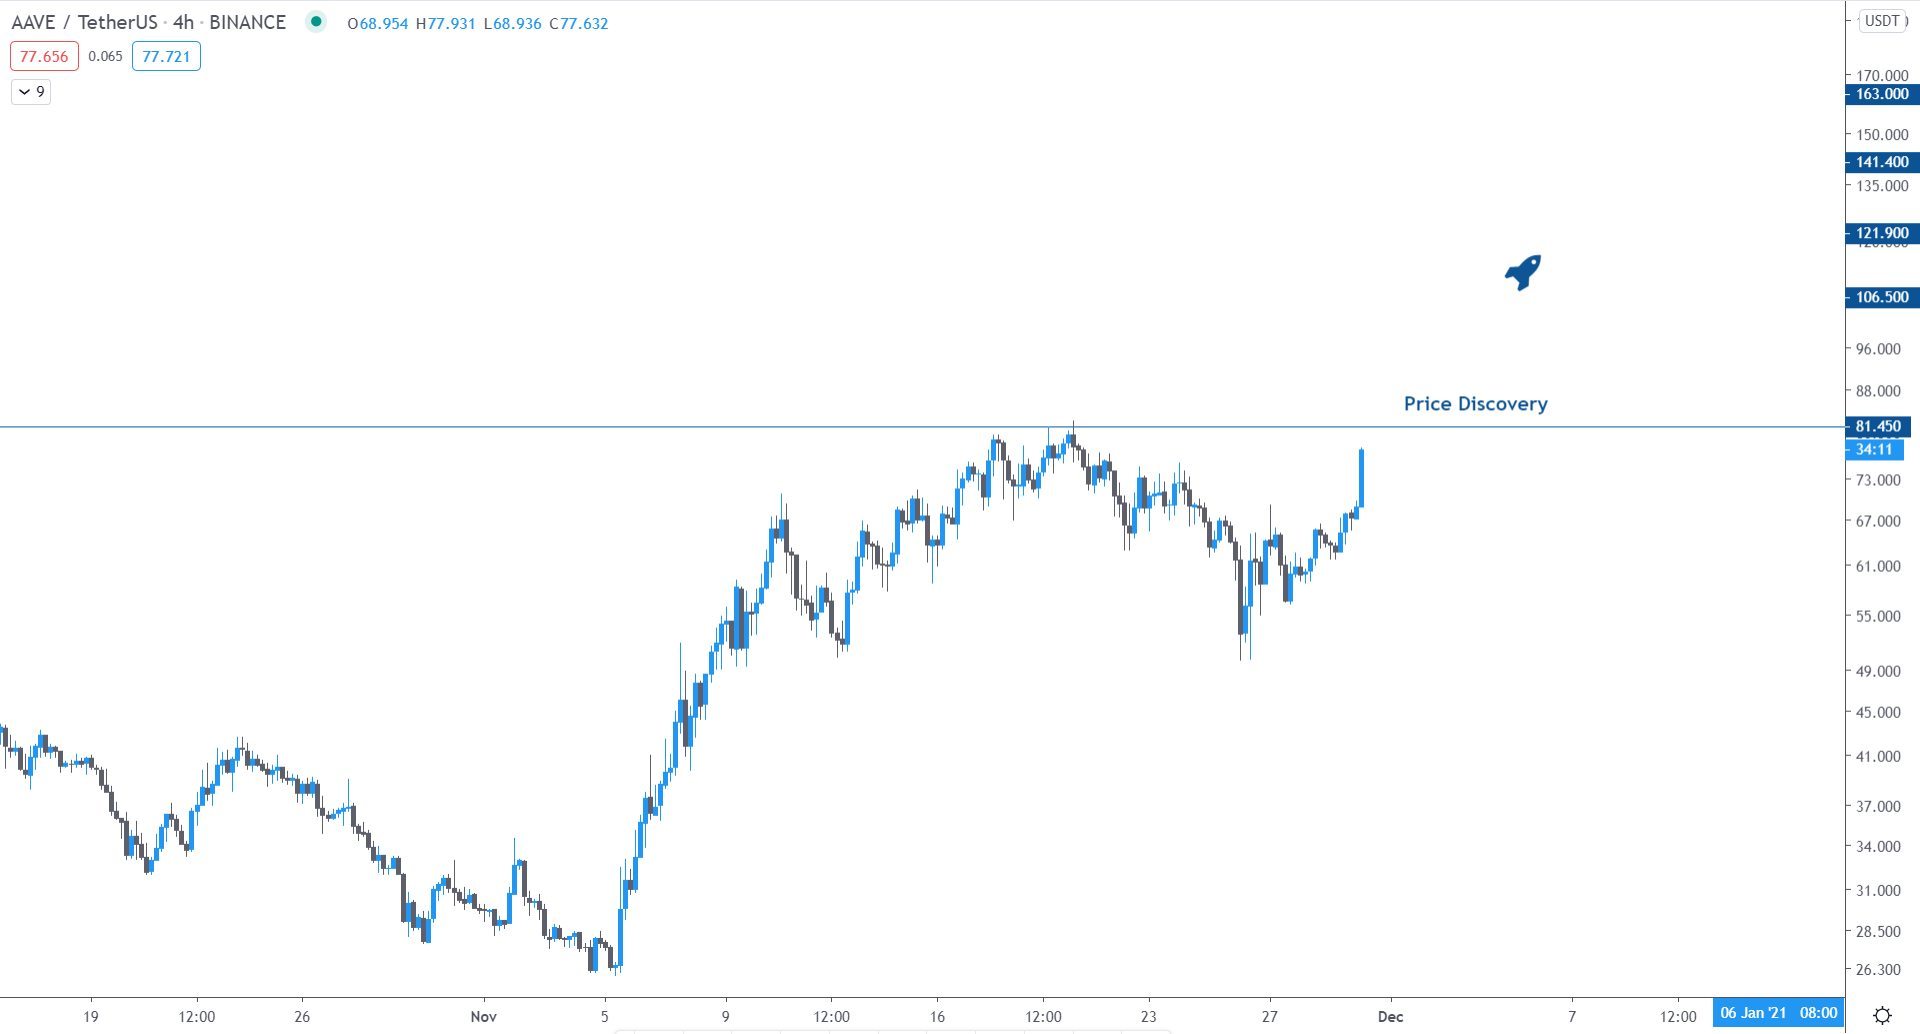
Cryptocurrency trader @TradingTank outlined an AAVE chart, stating that the price will soon reach a new all-time high.
While this is a possibility (also supported by technical indicators), the price has yet to break out above the $83 area, which is necessary for a new ATH.
Future Movement
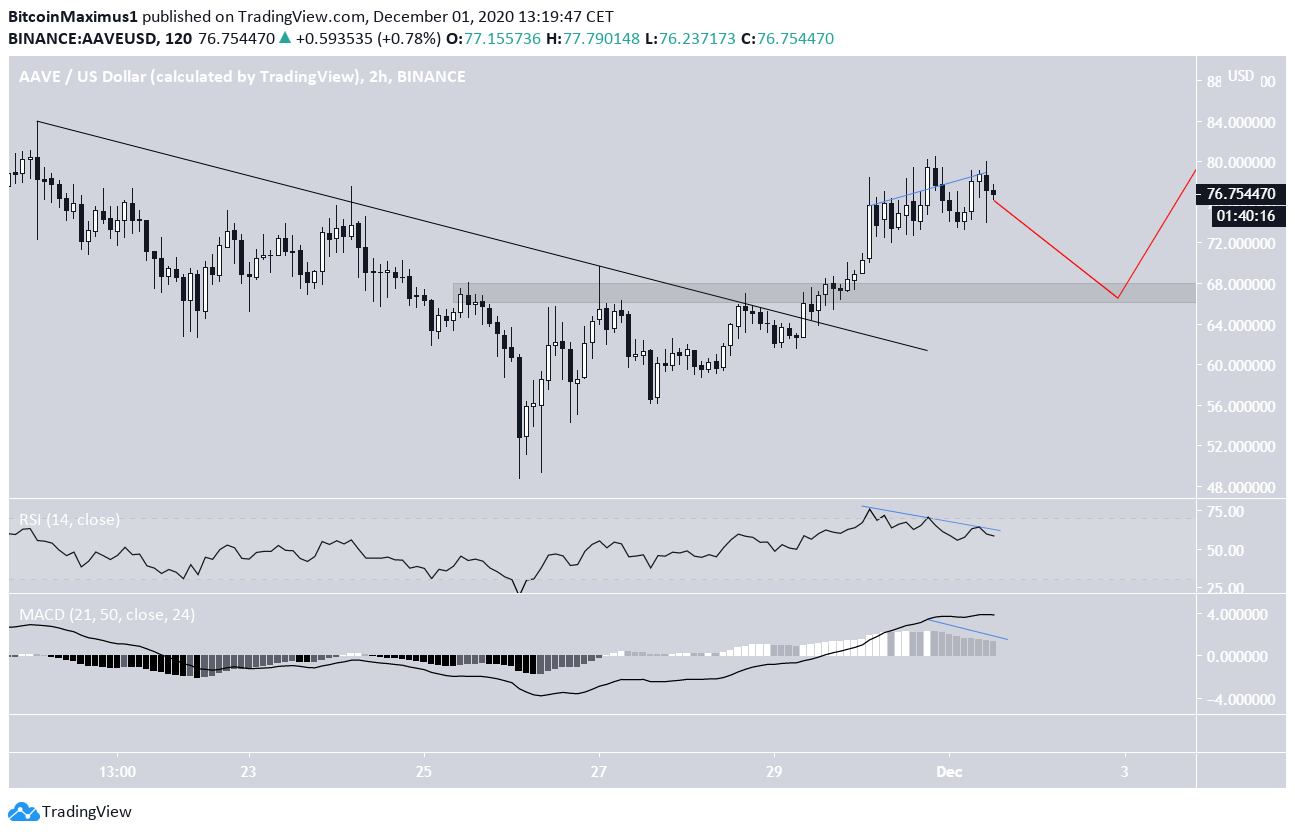
The shorter-term chart for AAVE shows that the price has broken out from a descending resistance line. However, it has formed considerable bearish divergence in both the RSI and the MACD.
Furthermore, the price has not retested the breakout level since it moved above it.
Therefore, a short-term drop towards $68 seems likely, before the price potentially could resume its upward momentum.
AAVE/BTC
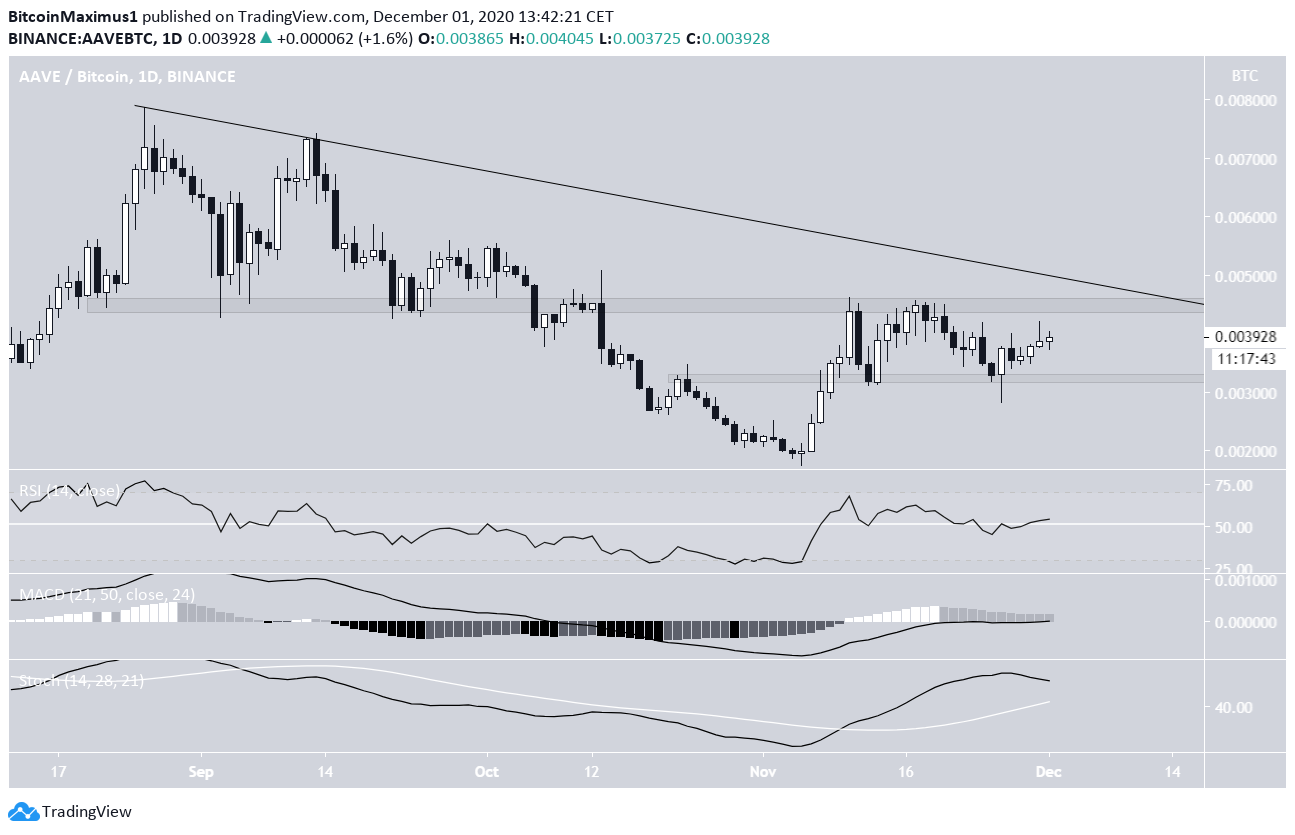
The AAVE/BTC pair shows that the price has been following a descending resistance line since it reached a high on Aug 23.
At the time of writing, the line coincides with the ₿0.0045 resistance area, increasing its significance. A breakout above this level would likely trigger a very sharp rally.
Technical indicators are bullish, supporting the possibility of a potential break out.
Therefore, after some ranging between ₿0.0045 and ₿0.0032, the AAVE price is likely to break out above this line.
Conclusion
To conclude, the outlook for both AAVE/USD and AAVE/BTC looks bullish in the long-term and neutral/bearish in the short-term. The price should eventually reach a new all-time high.
For BeInCrypto’s latest Bitcoin analysis, click here!
Disclaimer: Cryptocurrency trading carries a high level of risk and may not be suitable for all investors. The views expressed in this article do not reflect those of BeInCrypto


