
The Polygon (MATIC) price has reclaimed the $0.80 horizontal support area. While there is a short-term bullish pattern in place, the direction of the long-term trend is unclear.
Polygon is a platform that provides a scaling solution for the Ethereum blockchain. It aims to transform Ethereum into a multichain system, thus it can be considered an internet of blockchains.
What was previously known as Matic Network rebranded to Polygon in Feb. 2021. Similar to the Ethereum network, it uses the proof-of-stake consensus.
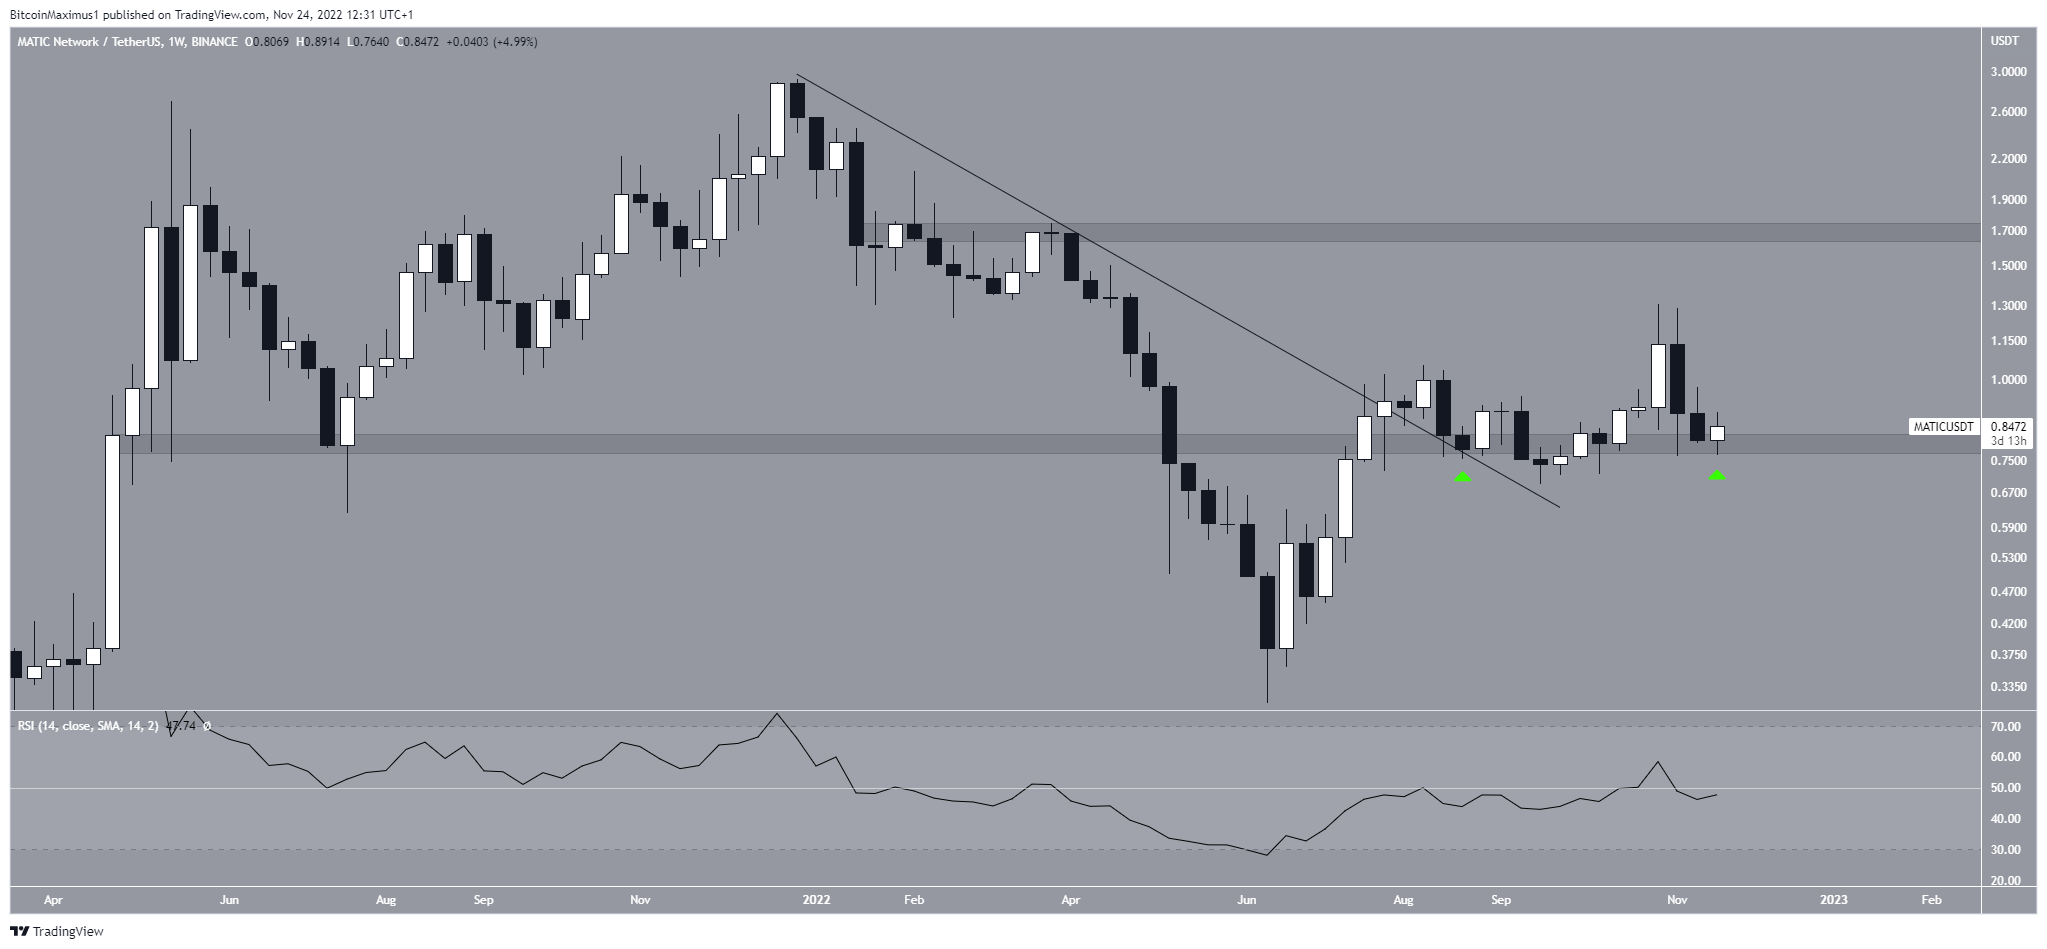
The Polygon price has decreased underneath a descending resistance line since Dec. 2021. At the time, it had just reached an all-time high price of $2.92. The downward movement ended in June 2022 with a low of $0.31.
The Polygon price has been increasing since. In July, it broke out from the descending resistance line and the $0.80 horizontal area. The area is now providing support (green icons). The closest resistance area is at $1.70.
The weekly RSI is undecided since it is right at the 50 line.
Therefore, whether the Polygon price breaks down from the $0.80 area can have massive implications for the future price. A breakdown would also cause the RSI to drop below 50, suggesting that the price forecast is bearish.
Conversely, a bounce from the $0.80 area could be the catalyst for an upward movement toward $1.70.
Polygon Price Creates Double Bottom Pattern
On Nov. 22, news broke that Magic Eden, one of the leading NFT marketplaces on Solana, would add Polygon as the third blockchain on its platform. MATIC has been moving upwards since, despite a small drop in the past 24 hours.
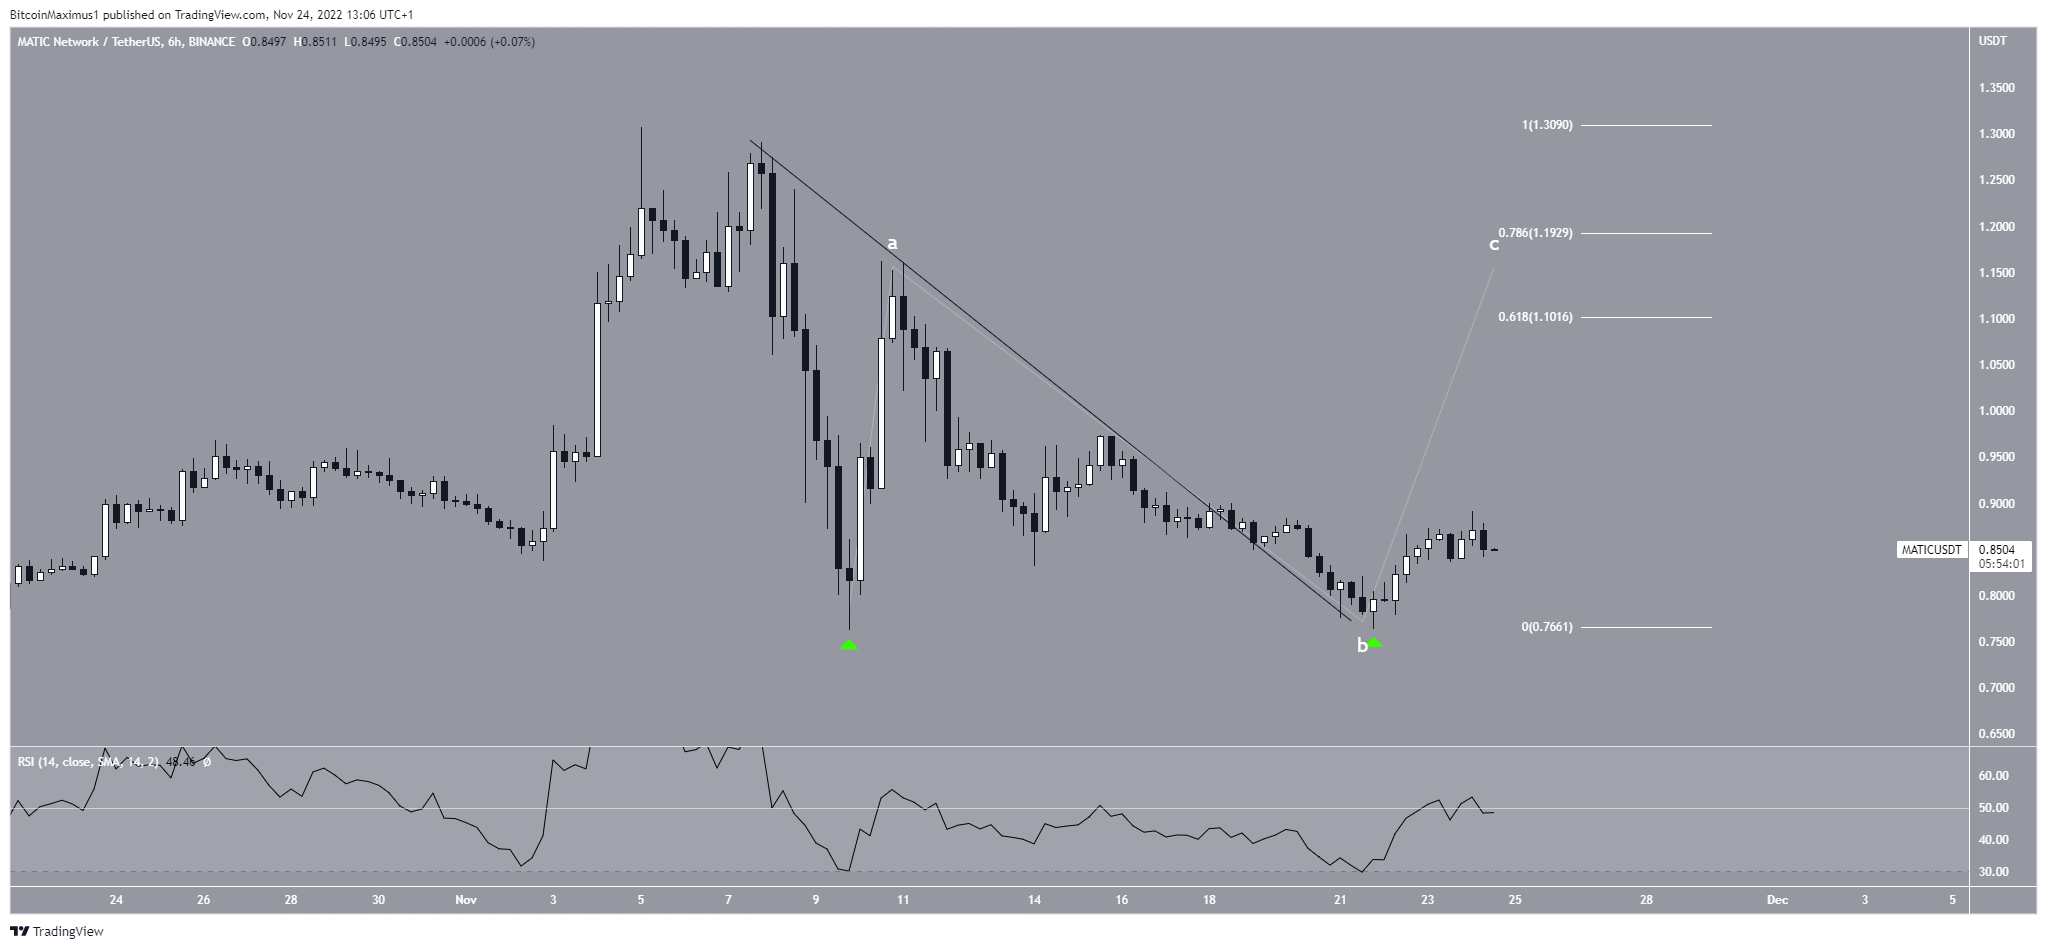
The six-hour technical analysis shows that the Polygon price created a double bottom pattern (green icons). The second bottom occurred after MATIC broke out from a short-term descending resistance line. However, the pattern was not combined with bullish divergence in the RSI, somewhat reducing its validity.
If the pattern is validated, it could lead to an increase toward the $1.10-$1.20 resistance area. This would complete the C wave of an A-B-C structure.
Conversely, a drop below the second bottom of $0.76 would invalidate this Polygon price forecast.
Why $0.80 Will Determine Trend Direction
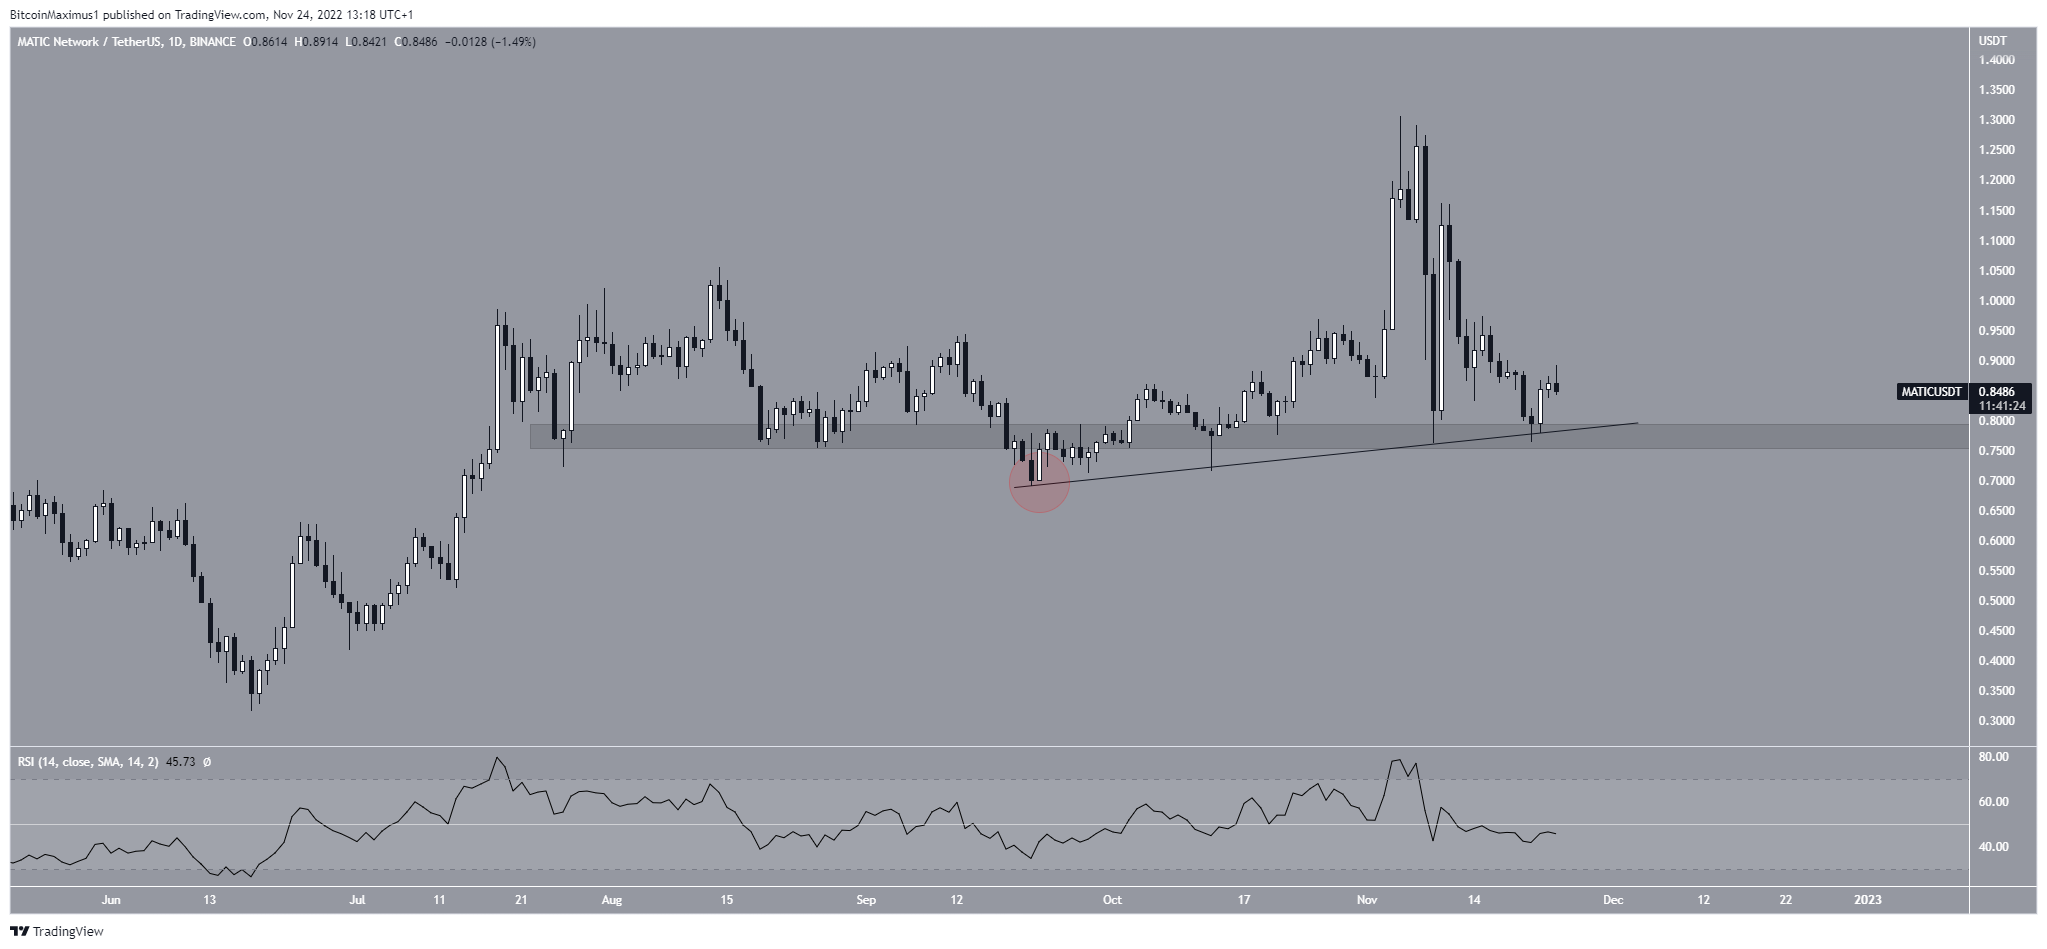
The daily time frame gives some unclear signs, more notably the daily RSI movement above and below 50.
However, there is one bullish sign in the form of a deviation and reclaim. The MATIC price deviated below the $0.80 area in Sept. 2021 (red circle). It reclaimed the area shortly afterward. Since then, it has followed an ascending support line.
Therefore, the $0.80 area can be considered a threshold for the direction of the trend. A close below it would suggest that the trend is bearish.
For BeInCrypto’s latest crypto market analysis, click here.
Disclaimer: BeInCrypto strives to provide accurate and up-to-date news and information, but it will not be responsible for any missing facts or inaccurate information. You comply and understand that you should use any of this information at your own risk. Cryptocurrencies are highly volatile financial assets, so research and make your own financial decisions.
