
On Feb 14, the EOS price reached a high of 53,210 satoshis but began a decrease the very next day. On Feb 19, it reached the crucial support area at 40,000 satoshis and bounced. It has been trading near this level since.
EOS (EOS) Price Highlights
- There is support at 40,000 satoshis.
- The price has found support above the 200-day moving average.
- It is trading inside a descending wedge.
- There is resistance at 46,000 satoshis.
- The RSI is bullish.
Cryptocurrency trader @acxtrades outlined an EOS movement, posting its price chart with the caption ‘No words needed.’ The same caption for a similar movement was posted by him for ADA yesterday, which BeInCrypto covered here.
No words needed. pic.twitter.com/JwWylgzVgC
— ◇.A.C.X.◇ (@ACXtrades) February 27, 2020
EOS Breakout Validation
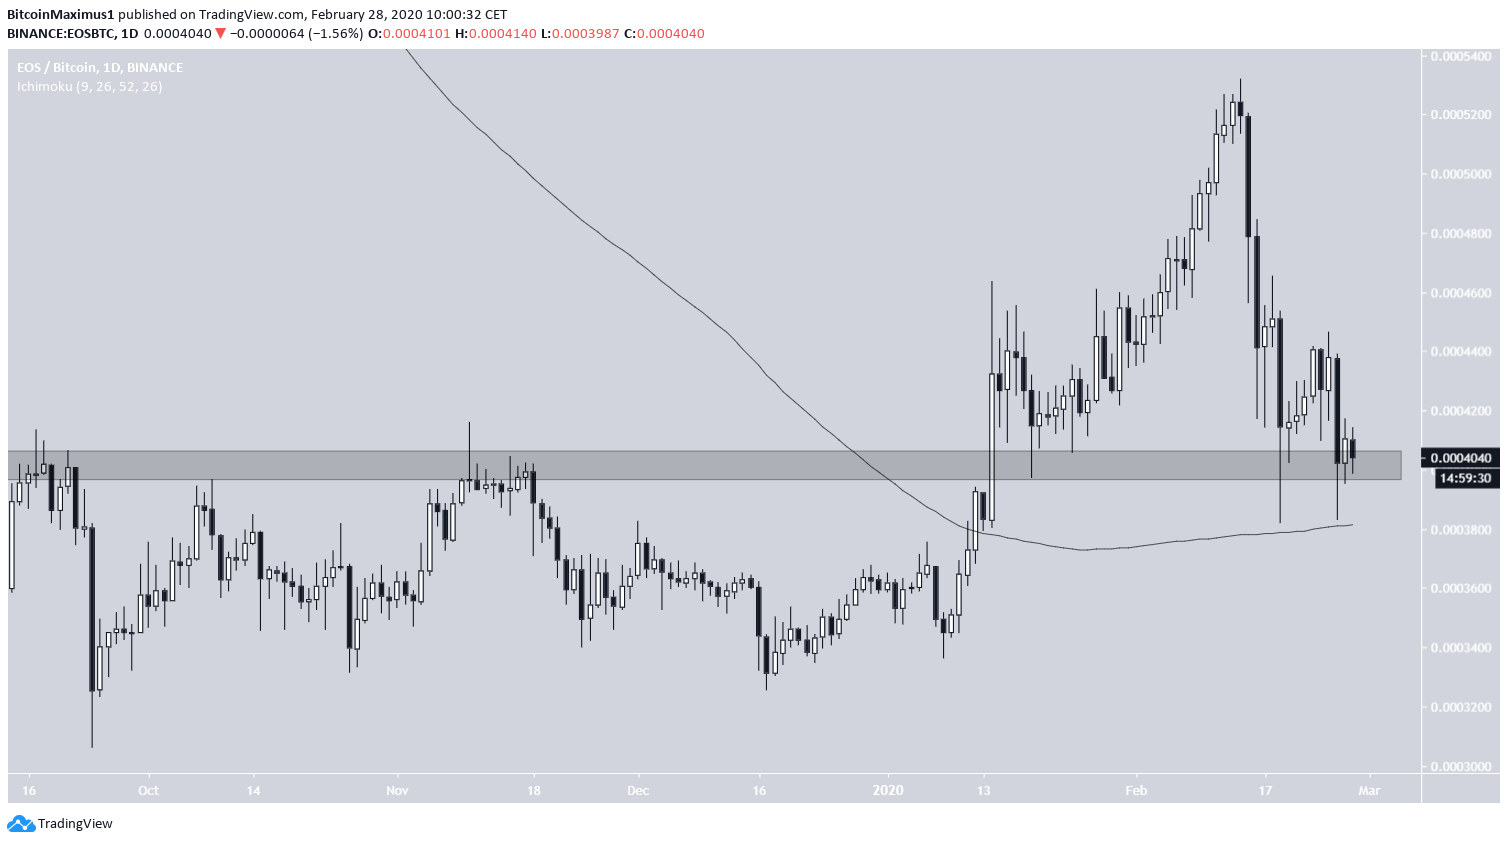
On Jan 14, the EOS price broke out above the previous resistance area that was found at 40,000 satoshis. The price continued to increase all the way to 53,210 satoshis on Feb 14, when it began a rapid decrease.
The price has twice returned to validate the 40,000 satoshi breakout level since, on Feb 19 and 26, creating long lower-wicks each time.
Furthermore, the current support is solidified by the presence of the 200-day moving average (MA), on which the price has also bounced.
So, as long as the price is trading above this support area and the 200-day MA, we can consider its movement bullish and presume that the price will continue to move upwards.
Descending Wedge
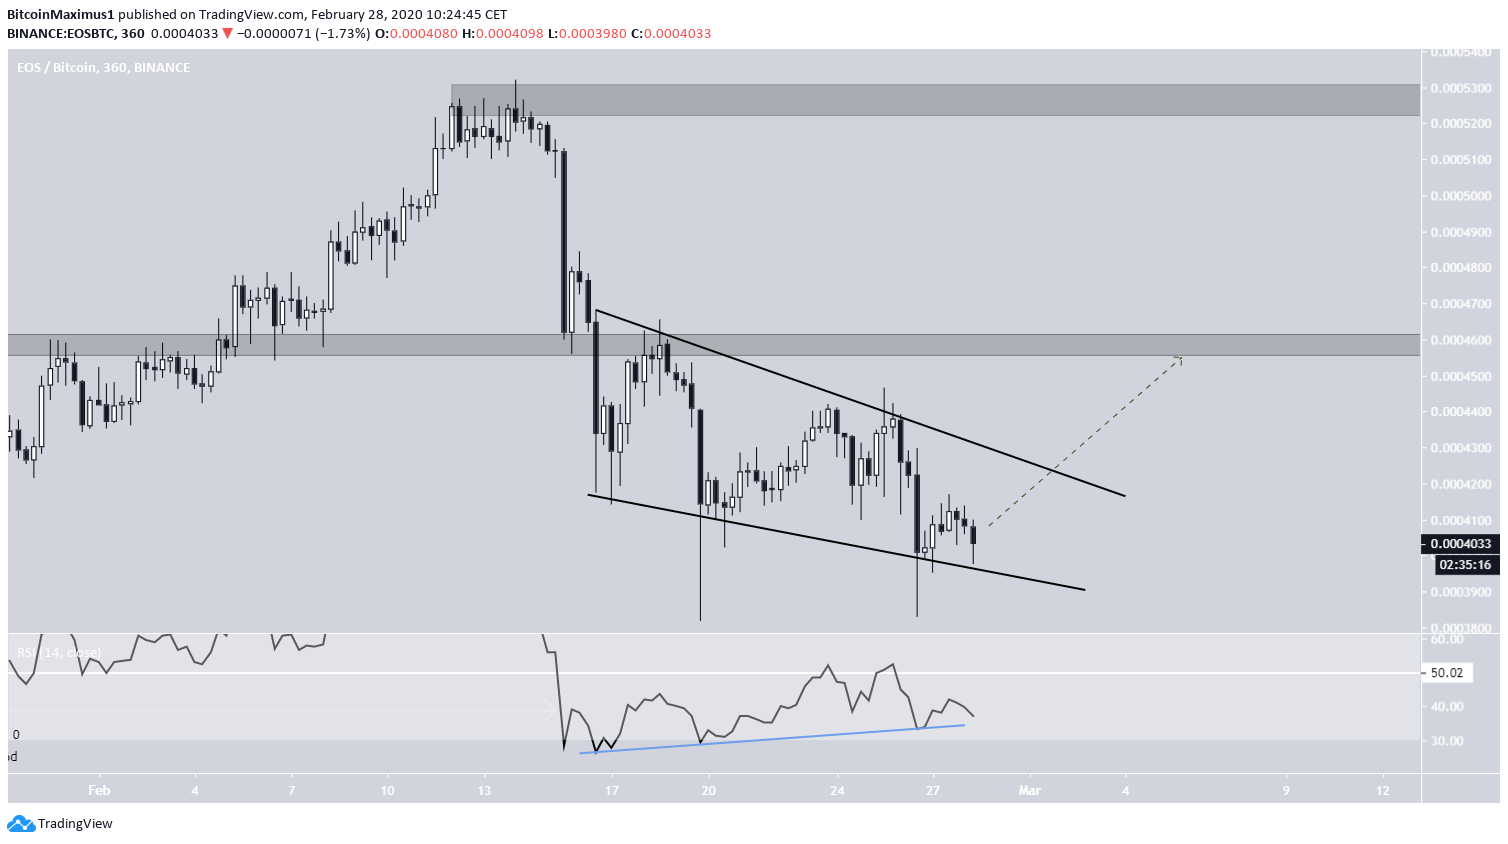
The short-term chart is also bullish and supports the possibility of an upward move following. There are two main reasons for this:
The price is trading inside a descending wedge, which is considered a bullish reversal pattern.
The 6-hour RSI has been generating bullish divergence for the entire duration of the wedge.
Since all of this movement is transpiring right at a significant support area, a breakout seems imminent.
The next resistance area is found at 46,000 satoshis.
Long-Term Movement
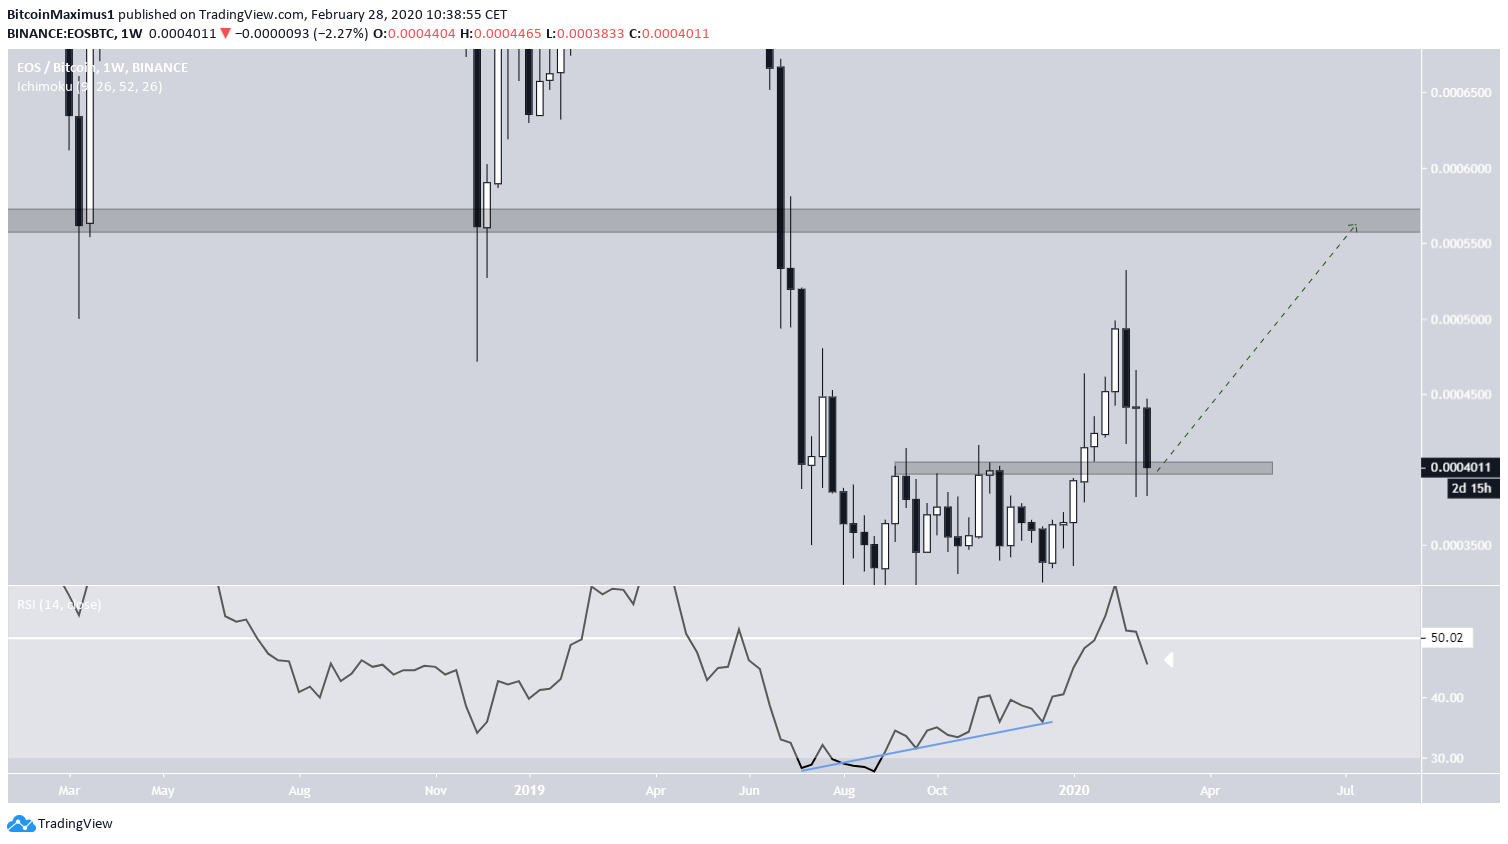
The long-term movement is also bullish, making the EOS chart a perfect three-for-three in different time-frame bullishness.
The RSI movement is especially interesting. The original breakout was preceded by strong bullish divergence in the weekly RSI. Afterward, it moved above 50, a sign that the price is in a longer-term bullish trend.
While it is currently in the process of falling below, there are three more days left until the weekly close. So, if the proposed short-term breakout occurs, the RSI would likely need to close at or above 50.
For a longer-term target, the next resistance area is found at 60,000 satoshis, which was the previous breakout level. The price has not traded above this level since June 2019. Measuring from the current price, an upward move to this level would represent a 50% increase.
To conclude, the EOS price has validated a crucial support area, which is essential for the bullish movement to remain intact. It has created a short-term reversal pattern, from which it looks likely to break out of to reach the resistance areas outlined above.
