


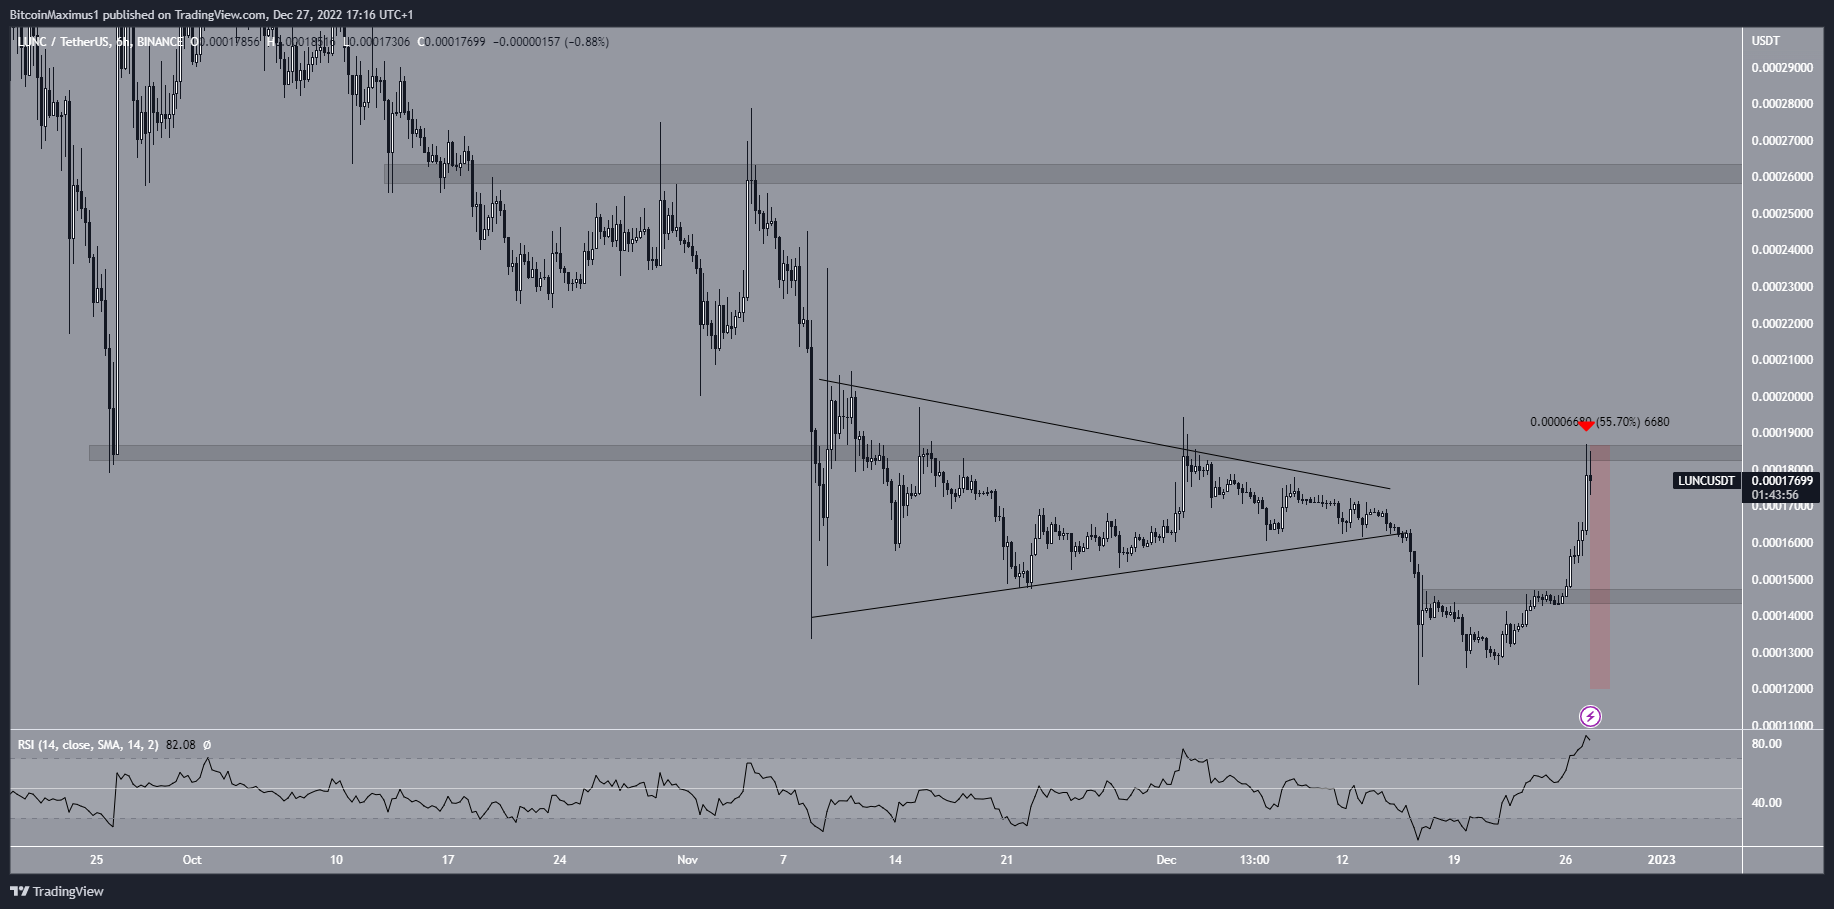
The Luna Classic (LUNC) price has increased considerably since Dec. 16, indicating that has completed a five-wave downward movement.
The LUNC price broke down from a symmetrical triangle on Dec. 16. The ensuing downward movement was swift, leading to a low of $0.000120 the same day. The bounce began around the same time that Korean authorities froze $93 million in assets from Known Terra (LUNA) ecosystem associates. This came after news that Do Kwon, Terra’s founder was likely to be extradited from Serbia, where he is currently hiding.
However, a significant bounce began shortly afterward, leading to a high of $0.000186 ten days later. This amounted to an increase of 56% in only ten days.
Afterward, the LUNC price was rejected by the $0.000186 area (red icon) and decreased slightly. While the RSI is overbought, it has not generated any bearish divergence yet. This allows for the upward movement to continue.
In case of a breakout, the next resistance would be at $0.000260. On the other hand, a rejection could lead to a re-test of the $0.000145 support area
Wave Count Supports LUNC Price Bounce
A look at the decrease since the beginning of October suggests that it was a five-wave downward movement (black). This is evident because the fourth wave took the shape of a triangle, which is common in such structures.
While it is not certain is the ensuing bounce is an A-B-C correction or a new five-wave upward movement (red), both indicate that the continuation of the upward movement is likely.
As a result, the Luna Classic price is expected to increase toward the $0.000250 – $0.000278, a resistance created by the 0.5-0.618 Fib retracement resistance levels and a horizontal resistance area. Conversely, a fall below the $0.000121 lows (red line) would invalidate this bullish LUNC price projection and indicate that new lows are on the horizon.
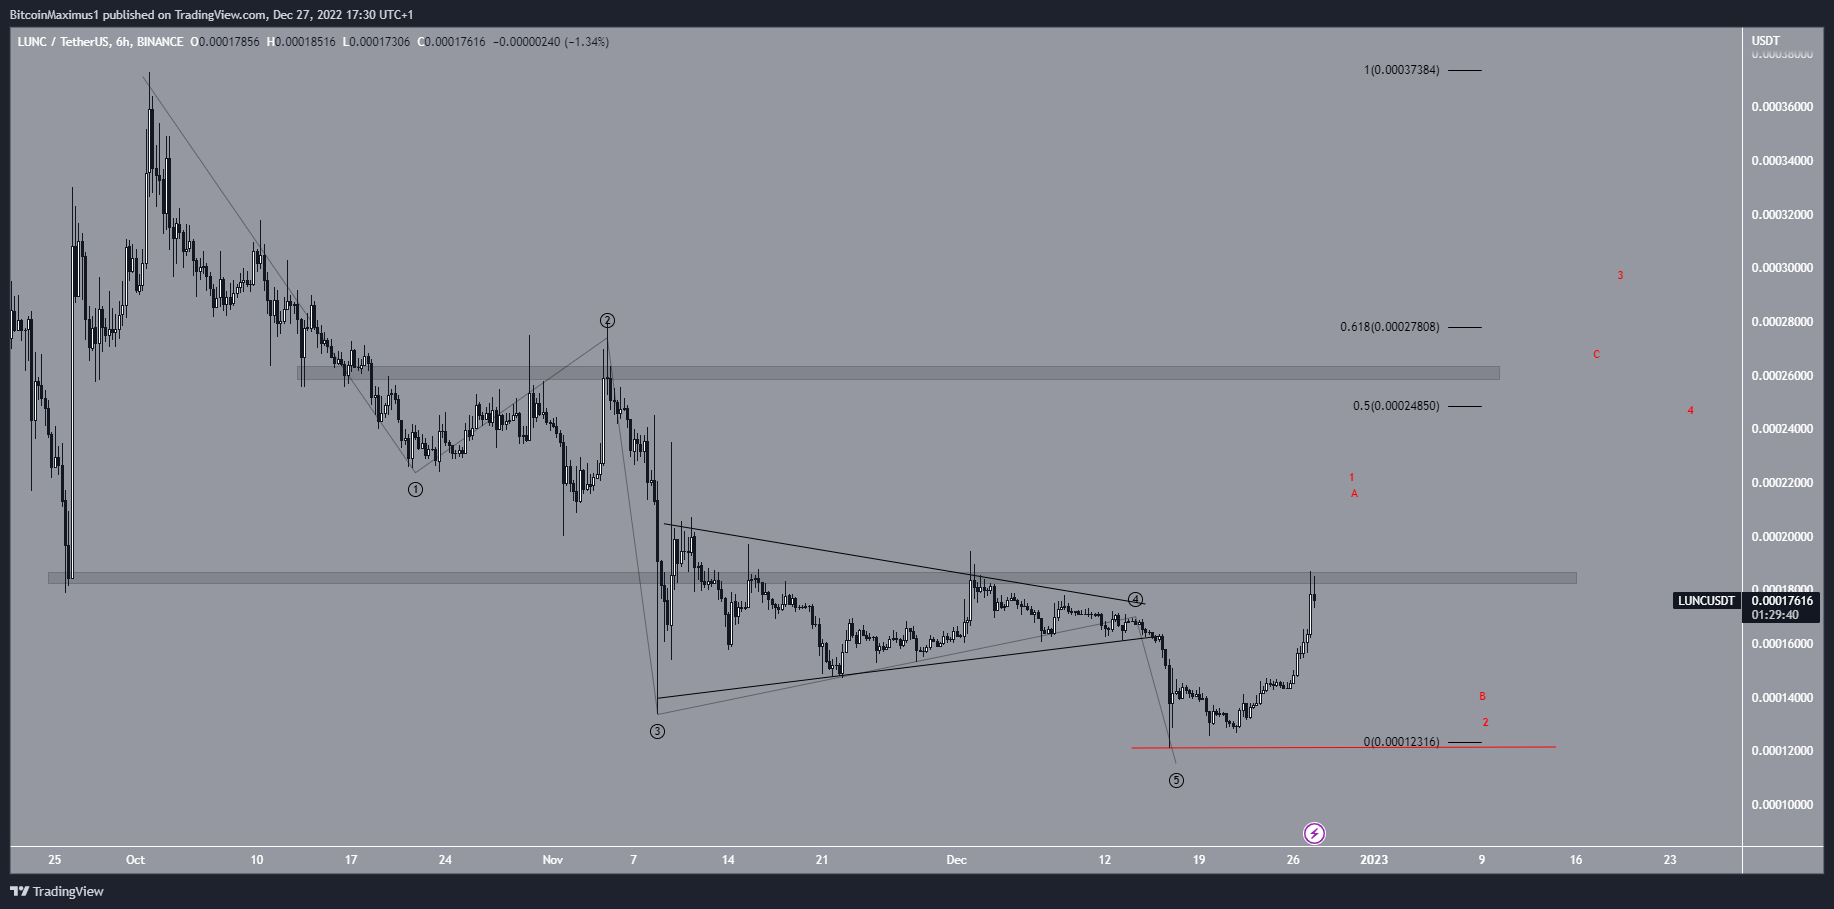
To conclude, the most likely LUNC price forecast suggests that an upward movement toward $0.000260 will occur. Before that, a short-term rejection could transpire. A close above the $0.000186 resistance area would confirm this possibility while a drop below $0.000121 would invalidate it.
For BeInCrypto’s latest crypto market analysis, click here


