


The Arweave (AR) price increased considerably after positive news from Meta. It is in the process of reclaiming the $15.80 horizontal area.
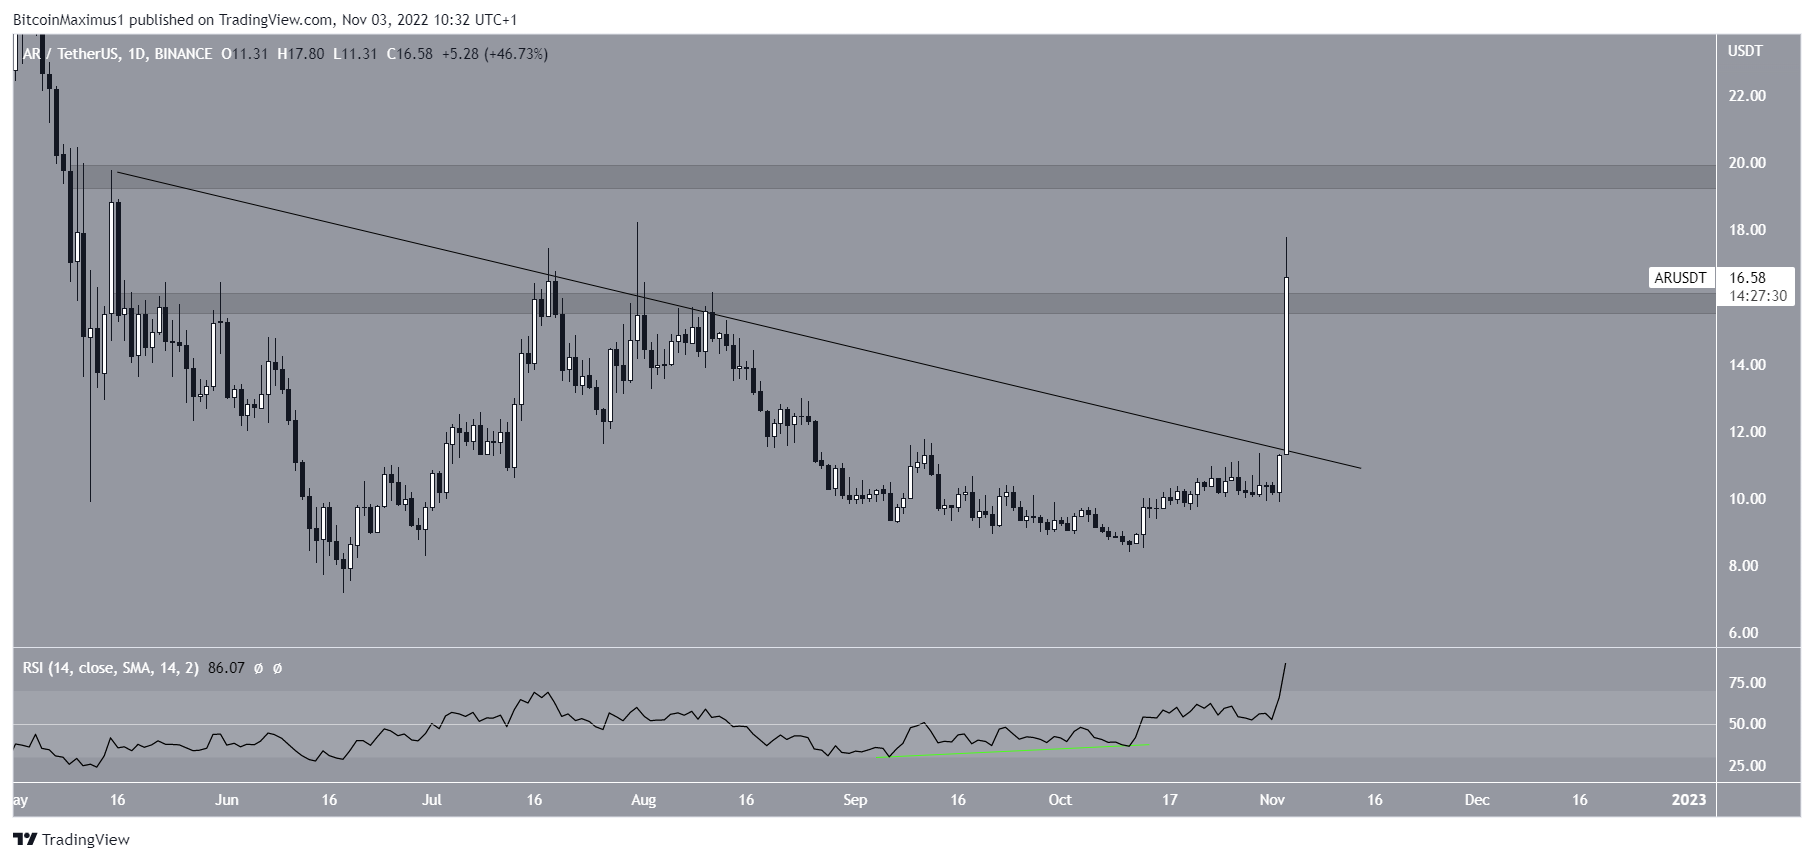
On Oct. 3, Meta announced that it is utilizing Arweave to store digital collectibles on Instagram. Shortly afterward, the AR price initiated a sharp upward movement, leading to a high of $17.80 the same day. The price action shows an increase of roughly 60% over the past 24 hours.
Despite the increase, it is unclear whether AR has managed to break out from the $15.80 resistance area. While it has moved above it, a daily close is required to confirm the breakout.
Before the upward movement, the daily RSI generated bullish divergence (green line). The indicator is now above 50 and has not generated any bearish divergence.
Finally, it is worth mentioning that the upward movement caused a breakout from a descending resistance line. Prior, the line had been in place since May 15.
As a result of these readings, it is likely that the AR price increase will eventually continue toward the next resistance at $19.50.
In this possibility, the new range would be between $15.80 and $19.50, with the former acting as support while the latter acts as resistance. Conversely, failure to close above the $15.80 area would invalidate this bullish Arweave price prediction.
AR Price Prediction: Beginning of Long-Term Reversal?
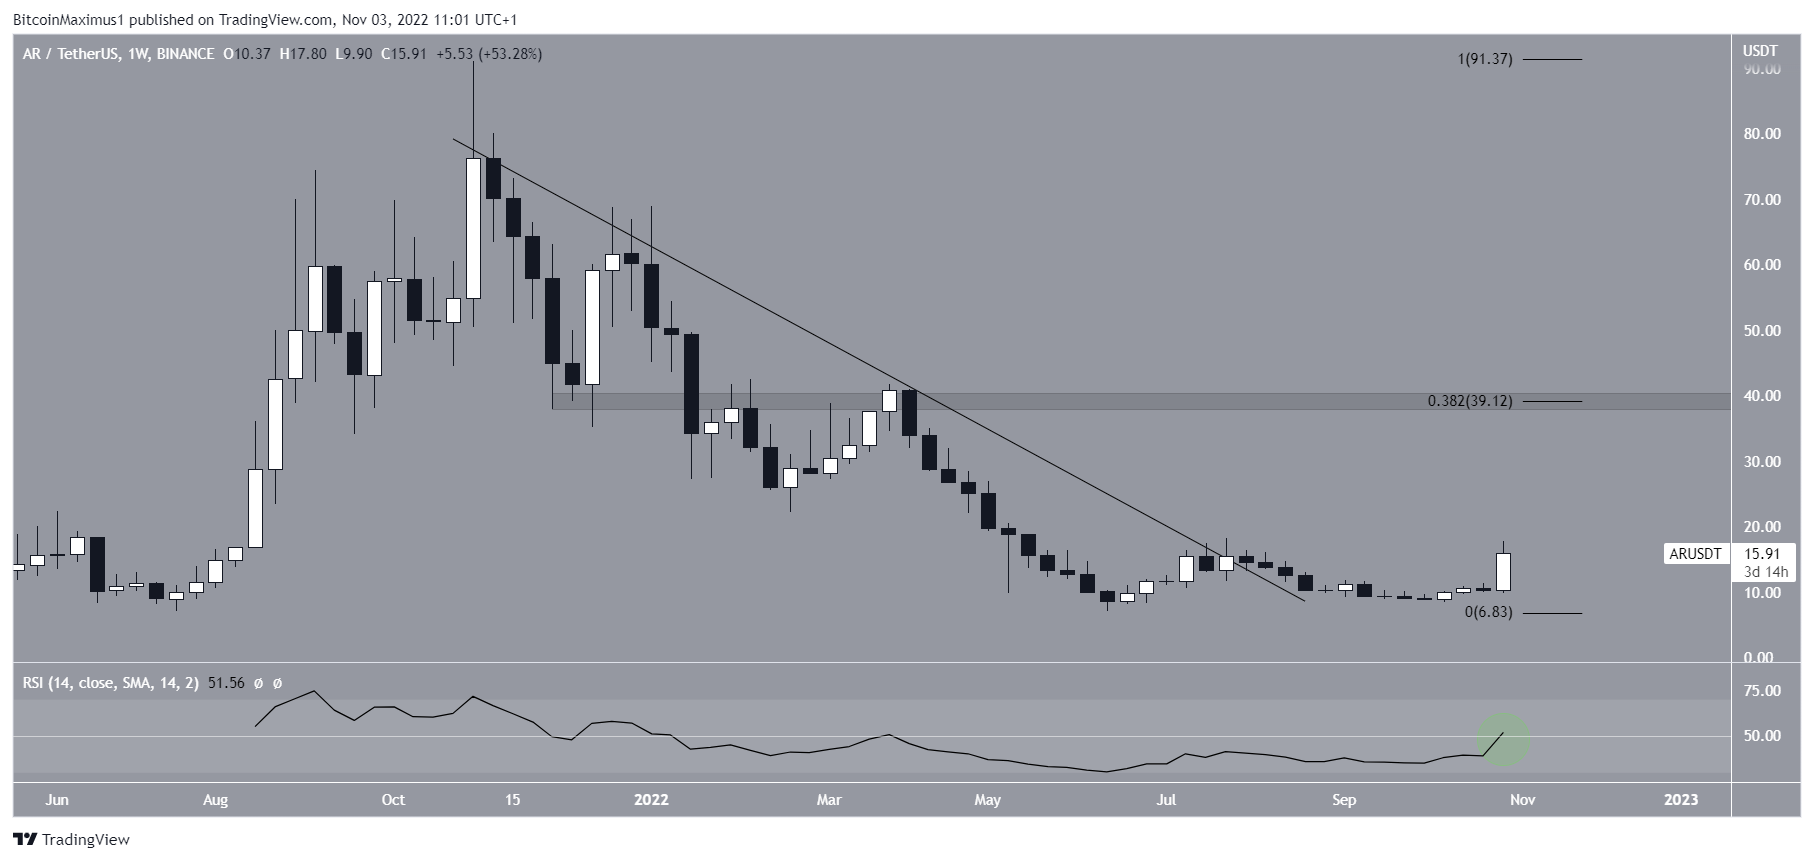
The legitimacy of the breakout comes to the forefront when looking at the weekly chart. In it, the Arweave price has broken out from a descending resistance line that had been in place since the $91.08 all-time high in Nov. 2021. Breakouts from such long-term structures usually lead to a notable reversal.
Furthermore, the weekly RSI is in the process of moving above 50 (green circle). This is considered a sign of a long-term bullish trend.
The technical analysis from the weekly chart, the main resistance area shows that from the daily at $15.80. However, if the AR price successfully moves above it, the next resistance would be at $39.12, created by both a horizontal resistance area and the 0.382 Fib retracement resistance level.
As stated prior, failure to close above the $15.80 horizontal area would invalidate the bullish AR price prediction.
For the latest BeInCrypto Bitcoin (BTC) and crypto market analysis, click here
Disclaimer: BeInCrypto strives to provide accurate and up-to-date information, but it will not be responsible for any missing facts or inaccurate information. You comply and understand that you should use any of this information at your own risk. Cryptocurrencies are highly volatile financial assets, so research and make your own financial decisions.
