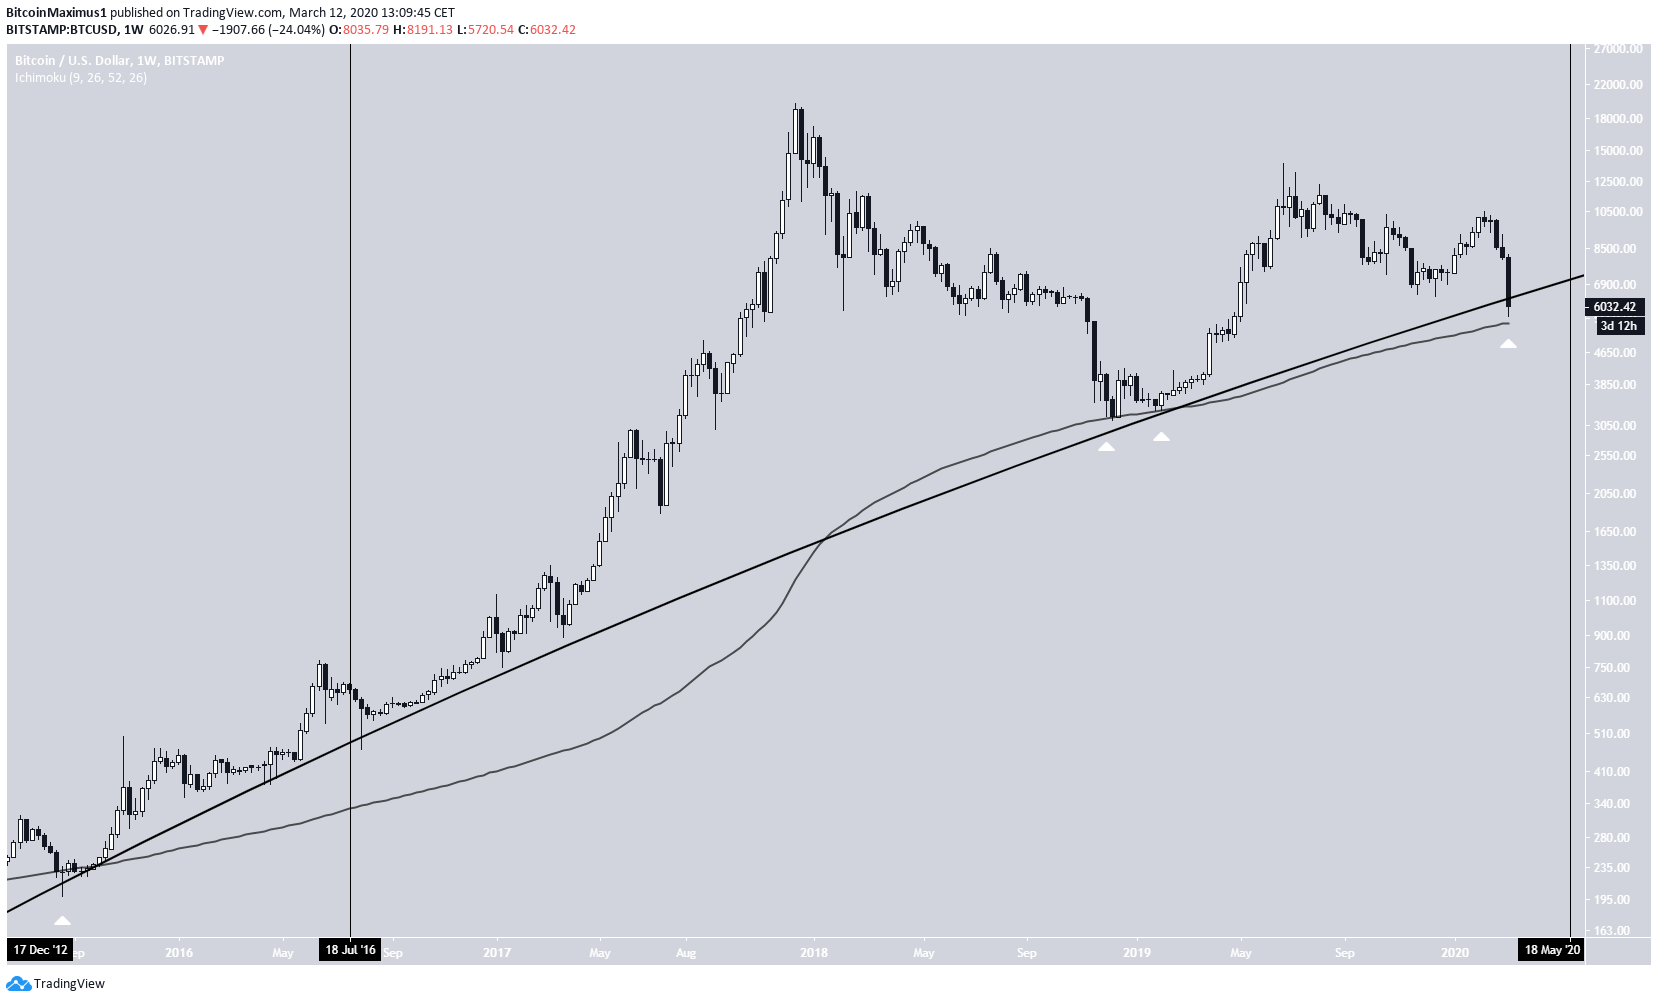
On March 12, the BTC price underwent a rapid decrease that caused it to drop from $7,400 to $5,600 in less than an hour. This also caused the price to validate its 200-week moving average (MA).
Bitcoin (BTC) Price Highlights
- The Bitcoin price has reached its 200-week moving average.
- It is trading right at the logarithmic support line.
- Comparisons to previous cycles suggest the price is close to a bottom.
— dave the wave🌊🌓 (@davthewave) March 12, 2020Has BTC reached a long-term bottom, or are there further decreases in store? Continue reading below if you are interested in finding out.
Logarithmic Support
The support line outlined in the tweet is a curved support line drawn in the logarithmic chart that has been in place since BTC’s inception. In addition, the 200-week moving average is outlined in black in the graph below. The price has validated both the support line and the MA numerous times, the prior three being on:- August 2015
- December 2018
- January 2019
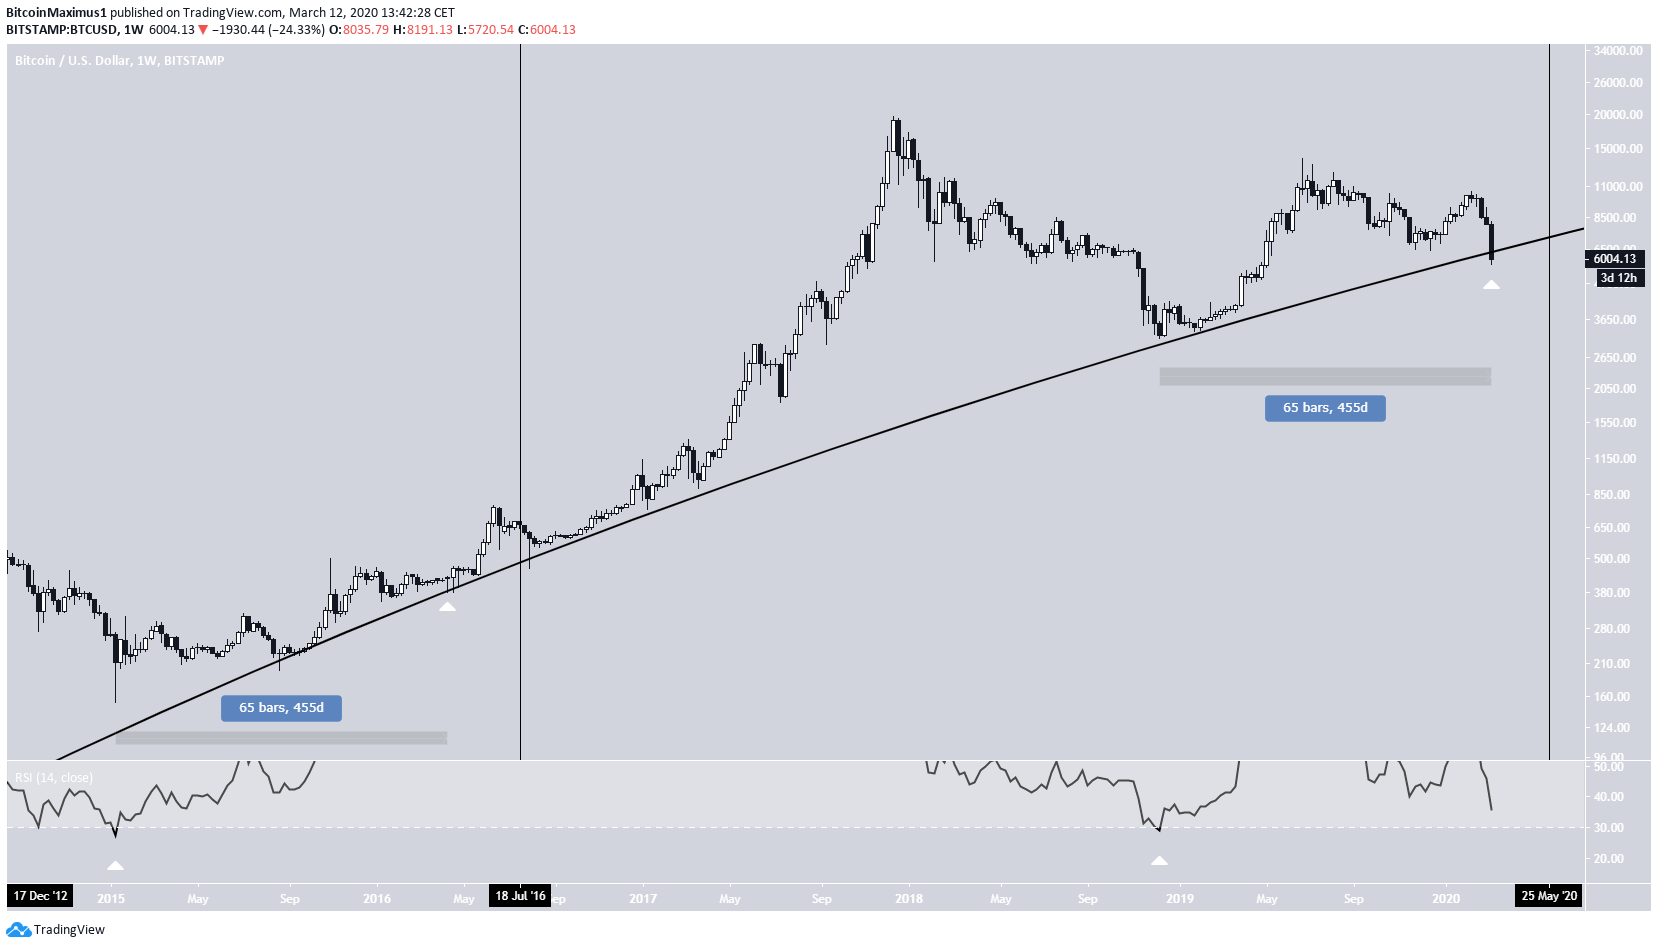
 The weekly RSI can be helpful in determining where the current price level is in regards to previous cycles. It has been oversold on only two occasions, January 2015 and December 2018.
The current decrease that touched the support line has occurred 455 days after the RSI bottom. Interestingly, the price also touched the support line 455 days after the January 2015 bottom and created a very long lower wick.
As for the vertical lines, they represent the halvening dates. The proximity to halvening is another similarity between these two cycles and suggests that this is probably a bottom.
Therefore, the most probable move from here is a price increase that would cause a weekly close above $6,000 and the ascending support line.
 To conclude, the BTC price has rapidly decreased and reached both a long-term support line and moving average (MA). The price is expected to bounce from this level and reach a weekly close above this support line.
Top crypto platforms in the US
Disclaimer
In line with the Trust Project guidelines, this price analysis article is for informational purposes only and should not be considered financial or investment advice. BeInCrypto is committed to accurate, unbiased reporting, but market conditions are subject to change without notice. Always conduct your own research and consult with a professional before making any financial decisions. Please note that our Terms and Conditions, Privacy Policy, and Disclaimers have been updated.

Valdrin Tahiri
Valdrin discovered cryptocurrencies while he was getting his MSc in Financial Markets from the Barcelona School of Economics. Shortly after graduating, he began writing for several different cryptocurrency related websites as a freelancer before eventually taking on the role of BeInCrypto's Senior Analyst.
(I do not have a discord and will not contact you first there. Beware of scammers)
READ FULL BIO
Sponsored
Sponsored
