
The BCH price has been trading inside a confined range for the past six months. It reached the bottom of the range on December 26 and has been increasing since, aiming for the range high.
Since reaching the range low, the price has increased by roughly 20%. On January 3, it broke out from a bullish pattern and has almost reached the range high at ₿0.033.
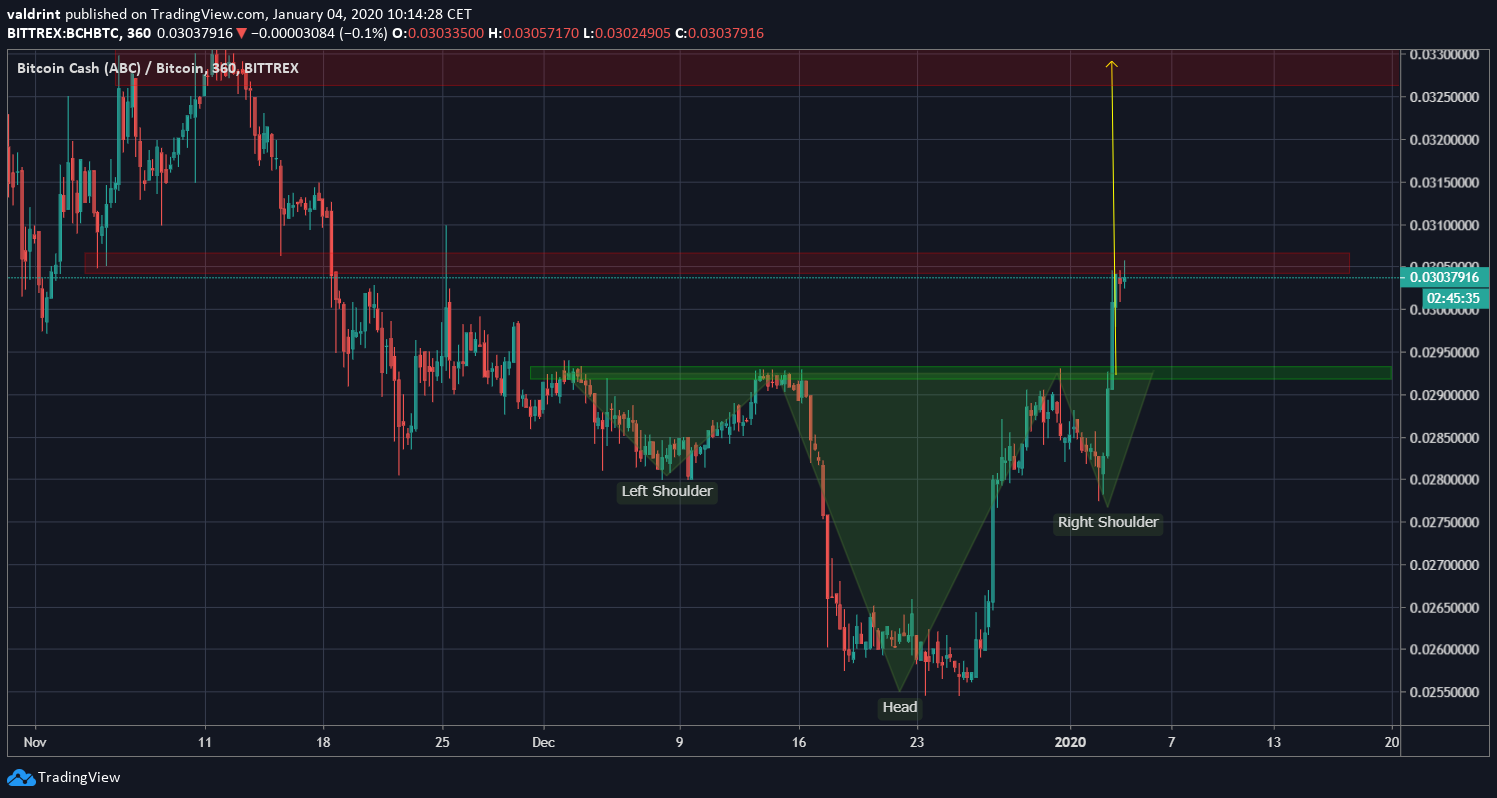
Cryptocurrency investor and trader DonAlt (@CryptoDonAlt) stated that the BCH chart is an ”absolute beauty” while outlining an inverse head and shoulders (H&S) pattern.
The BCH/BTC chart is an absolute beauty as well. pic.twitter.com/FChMi5xVwk
— DonAlt (@CryptoDonAlt) January 3, 2020
Will the BCH price break out? If so, what target will it reach? Keep reading below if you are interested in finding out.
BCH Trading Range
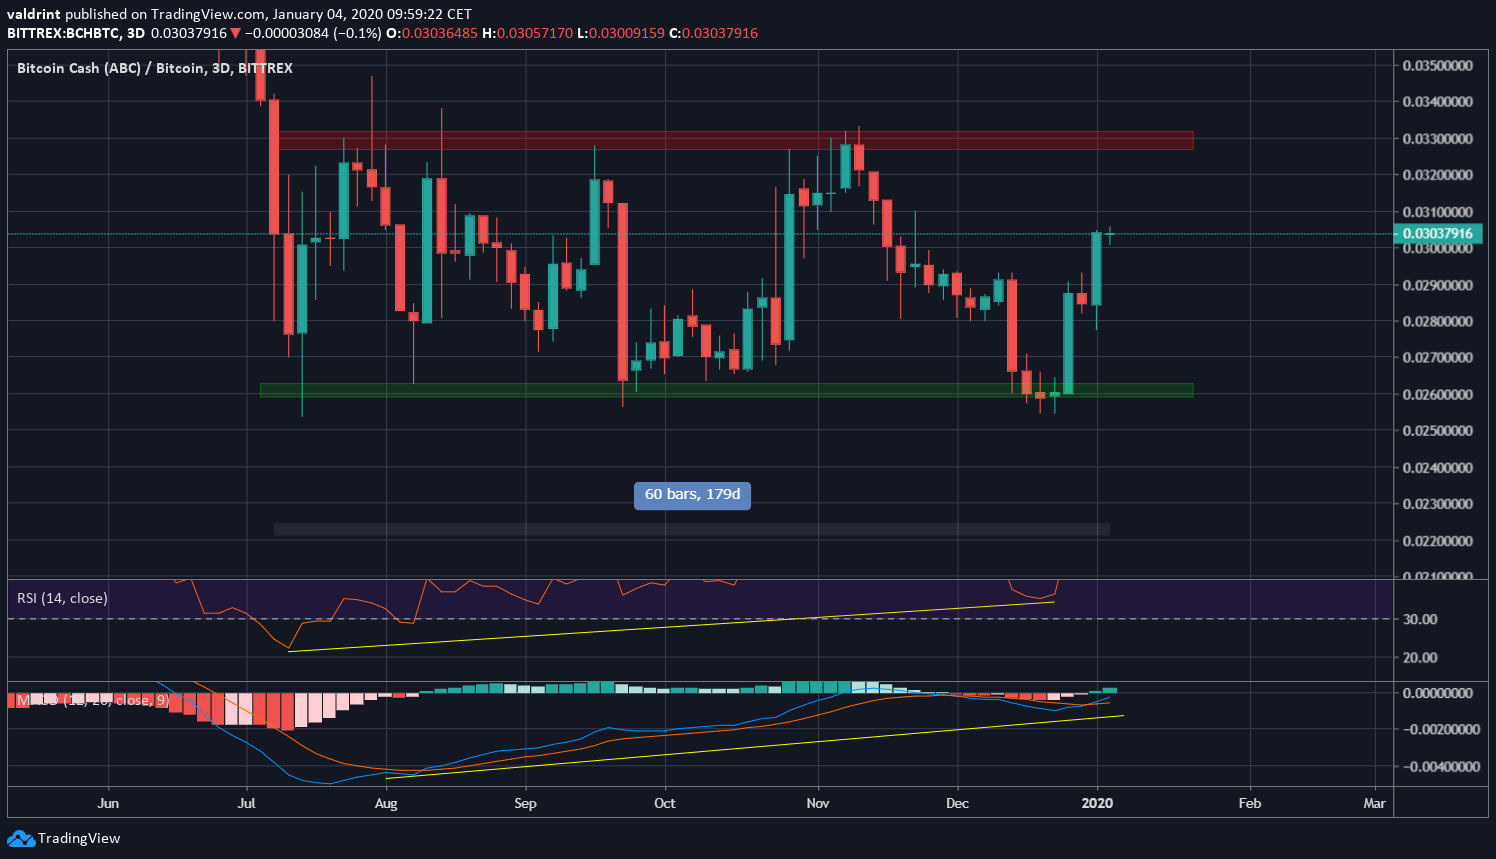
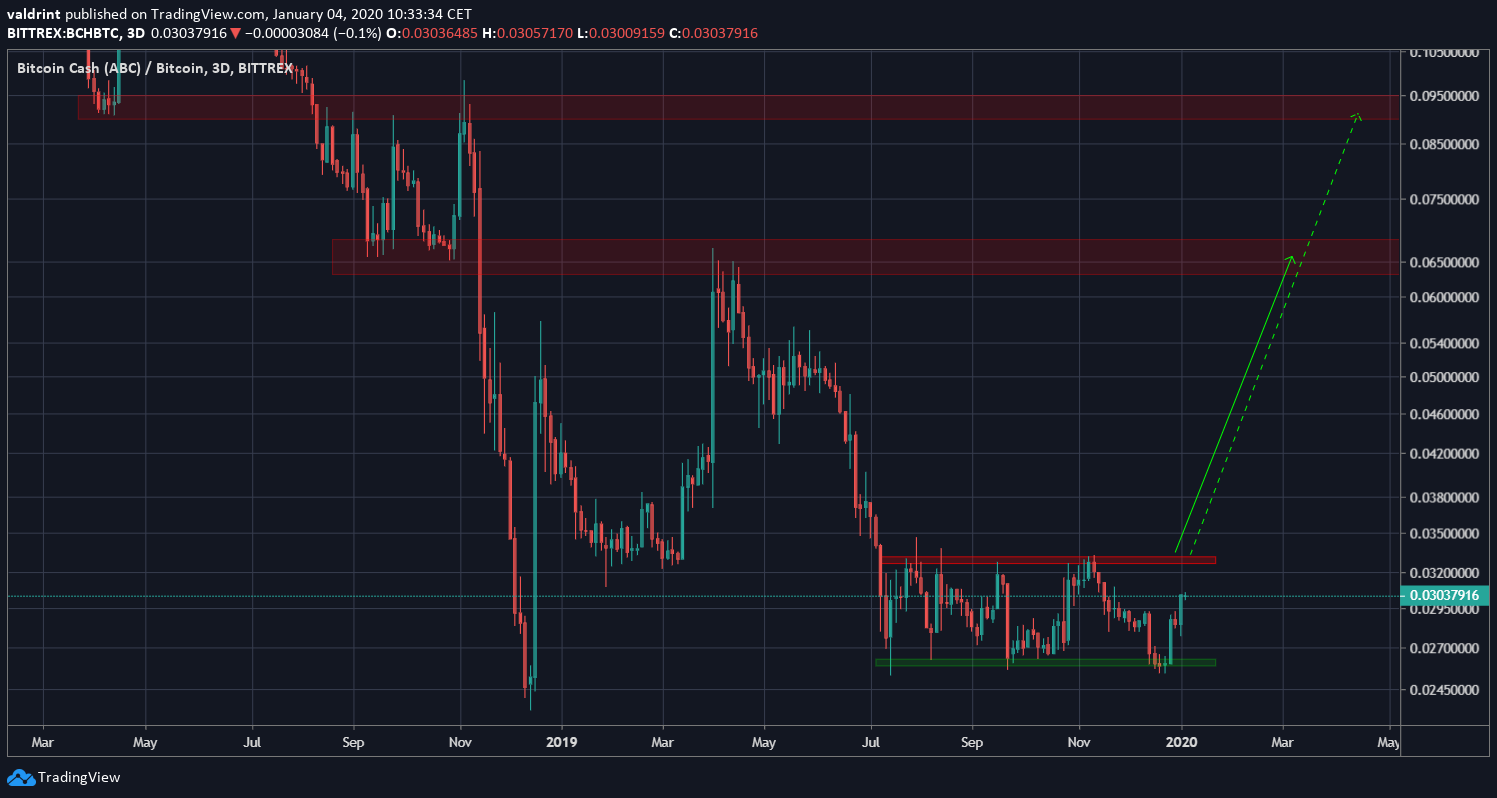
The BCH price has been trading in a range between ₿0.026 and ₿0.033 for the past 179 days, since July 9. Both the resistance and support areas have been validated four times. The price reached the support area on December 26 and began the current upward move that is still ongoing. The price has increased by roughly 20% since.
Throughout the entire time the price has been trading inside this range, both the RSI & the MACD have generated bullish divergence. This not only supports a movement towards the range high but also a breakout from the range afterward, due to the presence of divergence in higher time-frames.
Since the tweet, the price has already broken out from the inverse head and shoulders pattern. It is currently trading inside the minor resistance area at ₿0.03.
If the price travels the entire height of the pattern, it will reach the range highs at ₿0.033.
Future Movement
The price position in relation to the moving averages (MA) could give us an insight into future price movement. The price is trading above its 100-day MA and has just reached the 200-day one, which it has been trading below since June 26.
Continuing from the target given by the inverse H&S, we could see the price reach the range highs, return to validate the 200-day MA and then continue upwards. A bullish cross between the aforementioned MAs would likely confirm that the price will break out.
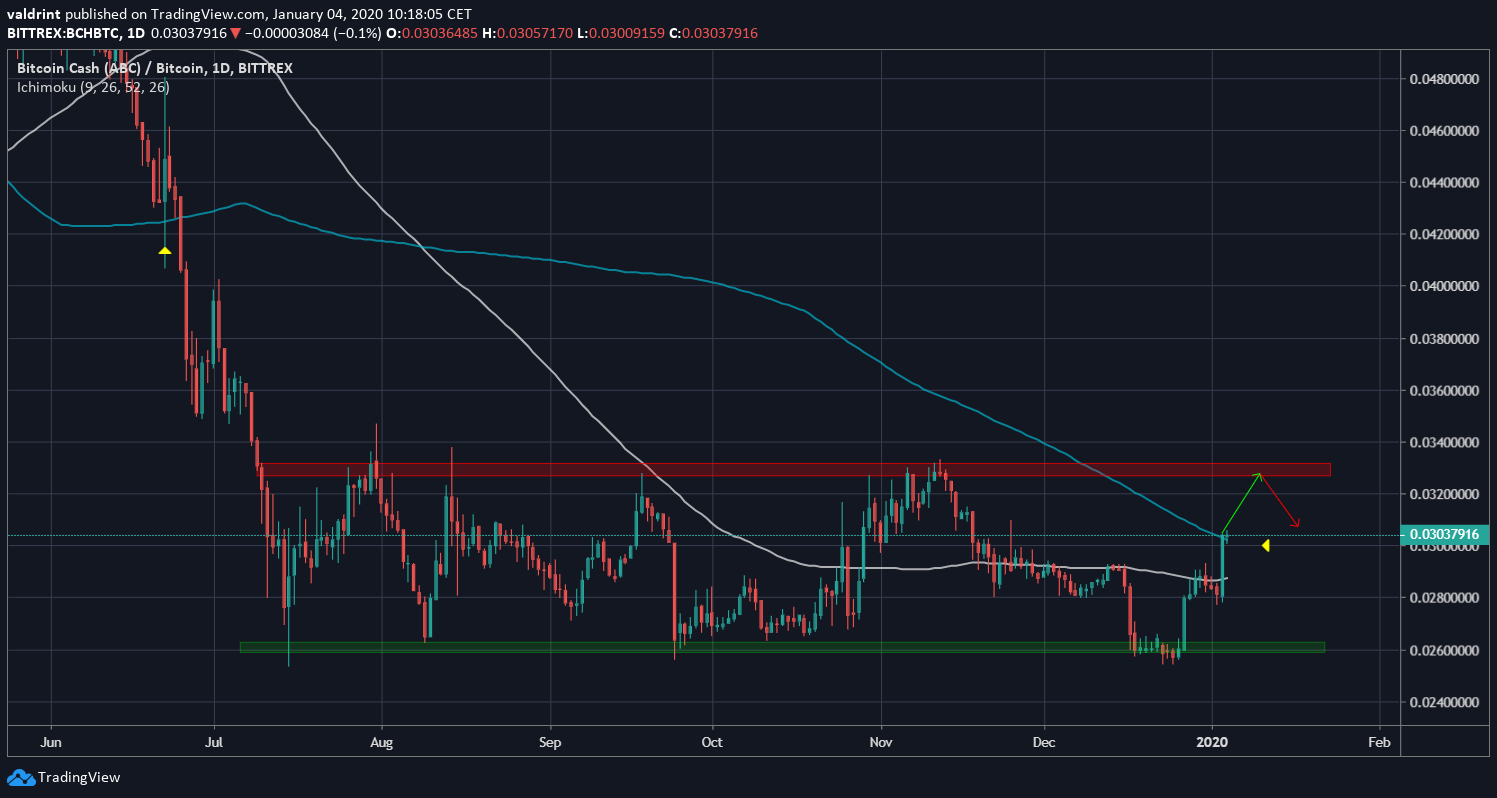
A retest of the breakout level at ₿0.0292 would provide an opportunity to enter the trade in anticipation of a breakout.
Future Movement
The 3-day RSI has been oversold only three times prior, in August and December 2018, and at the beginning of the trading range in July 2019. The first two times, upward moves of 46% and 200% ensued.
During the current trading range, the RSI has generated strong bullish divergence and has been accumulating for a long period of time. This may imply that the breakout from this range will be stronger than the previous movements.
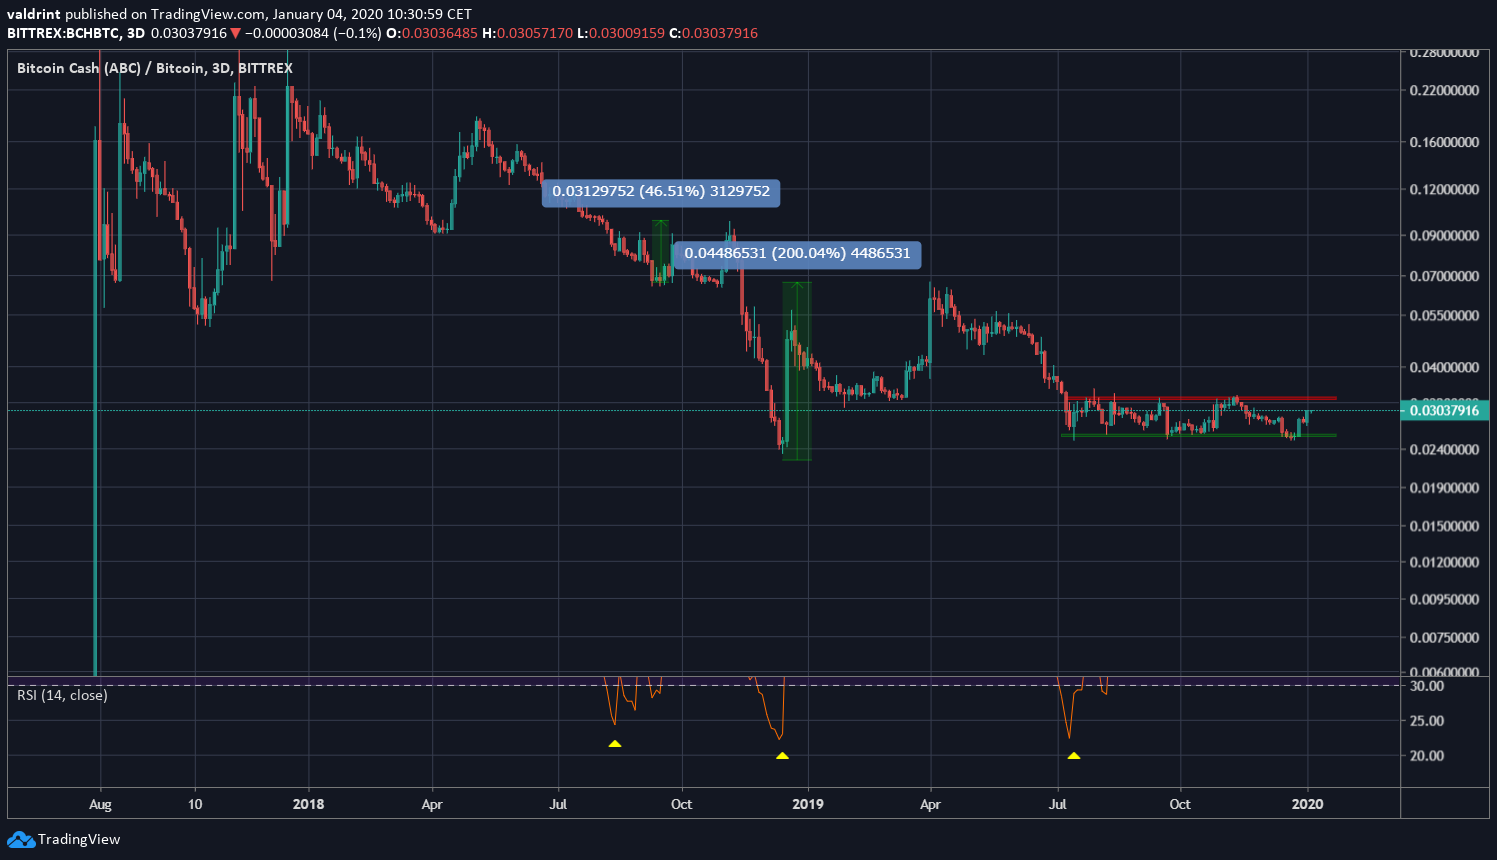
If the price breaks out, it is likely to test the previous breakdown level at ₿0.065, and possibly increase all the way to ₿0.095. But, since the price has been accumulating for roughly six months, the upward move could unfold in a similar time period, reaching the target in the middle of 2020.
To conclude, the BCH price has been trading in a range for the past six months. Technical indicators support a breakout from this range, giving a target of at least ₿0.065 for 2020.
