


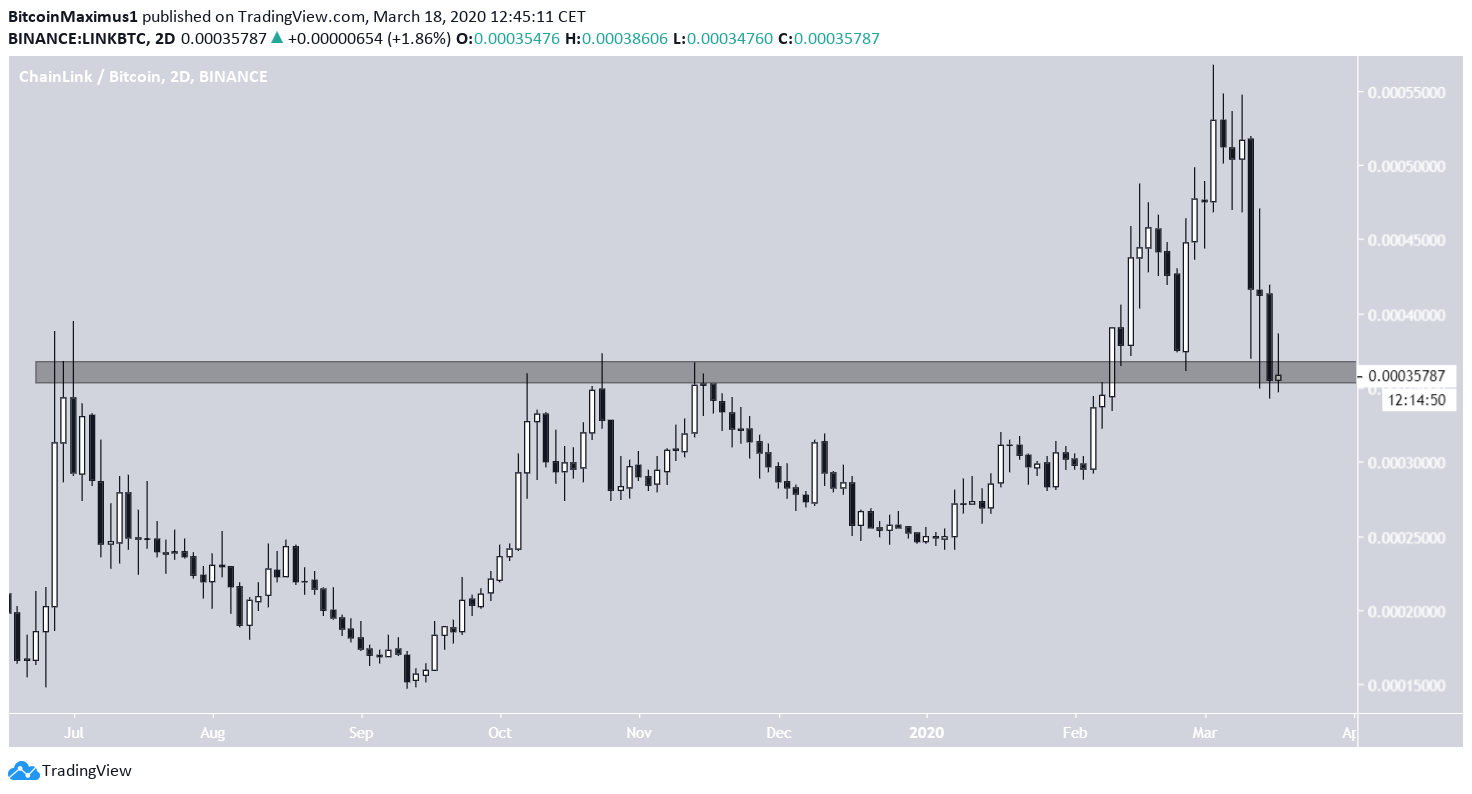
On Feb. 11, the LINK price broke out above a very important resistance area. It continued to increase until March 4, when the trend reversed. The price has returned to the resistance area and is in the process of validating it as support.
Chainlink (LINK) Price Highlights
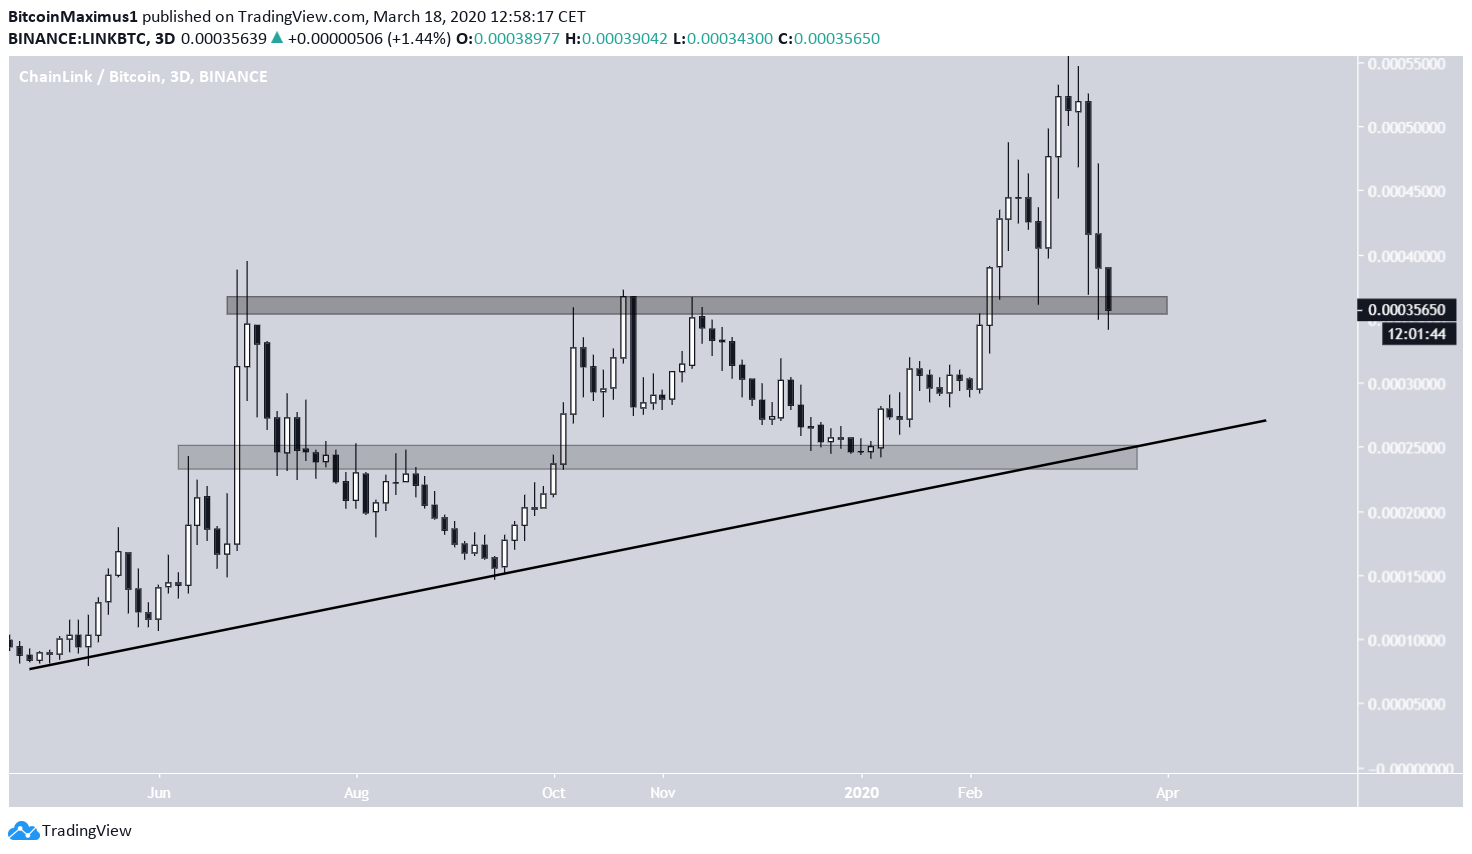
- There is significant support at 36,000 and 25,000 satoshis.
- The price is possibly following an ascending support line.
- It is trading inside a short-term descending wedge.
- There is resistance at 45,000 satoshis.
While the LINK price reached a high of 56,000 satoshis on March 4, the two ensuing weeks have made that seem like a distant memory, since the LINK price has decreased by more than 30%. Well-known trader @TradingTank outlined a LINK price price chart stating that he is looking to buy near the 30,000-satoshi support area.
$LINK We should be able to buy this lower since it's now breaking through this support. I'm looking at the 29-31K sats range or $1.40-1.50 at current $BTC price. pic.twitter.com/SJ4XaK3RgW
— Trading Tank (@TradingTank) March 16, 2020
Will the LINK price be successful in getting to the target, or will it reverse its trend prior to doing so? Continue reading below if you want to find out.
Significant Support
First, we need to outline the importance of the 36,000-satoshi support level. The price first reached it in July 2019, before beginning a decrease that continued for several months. Afterward, the level acted as resistance thrice more, until the price was finally able to successfully break out in February 2020.
After reaching a high on March 4, the LINK price has been decreasing and reached the area, which is now acting as support, once more on March 14. We successfully predicted this decrease in our previous analysis.
Therefore, as long as the price is trading above this area, this is considered a retest of the area as support.
Even though the tweet states that there is support at 30,000 satoshis, a stronger support area seems to be found at 25,000 satoshis, also strengthened by the presence of a possible ascending support line in place since April 2019.
Descending Wedge
In the short-term, the LINK price has been trading inside a descending wedge, currently being very close to its projected end. In addition, there is bullish divergence developing in the RSI.
Due to the fact that the price is trading inside a bullish reversal pattern and a strong support area, we believe a breakout is expected and the LINK price will move toward the next resistance area at 45,000 satoshis.
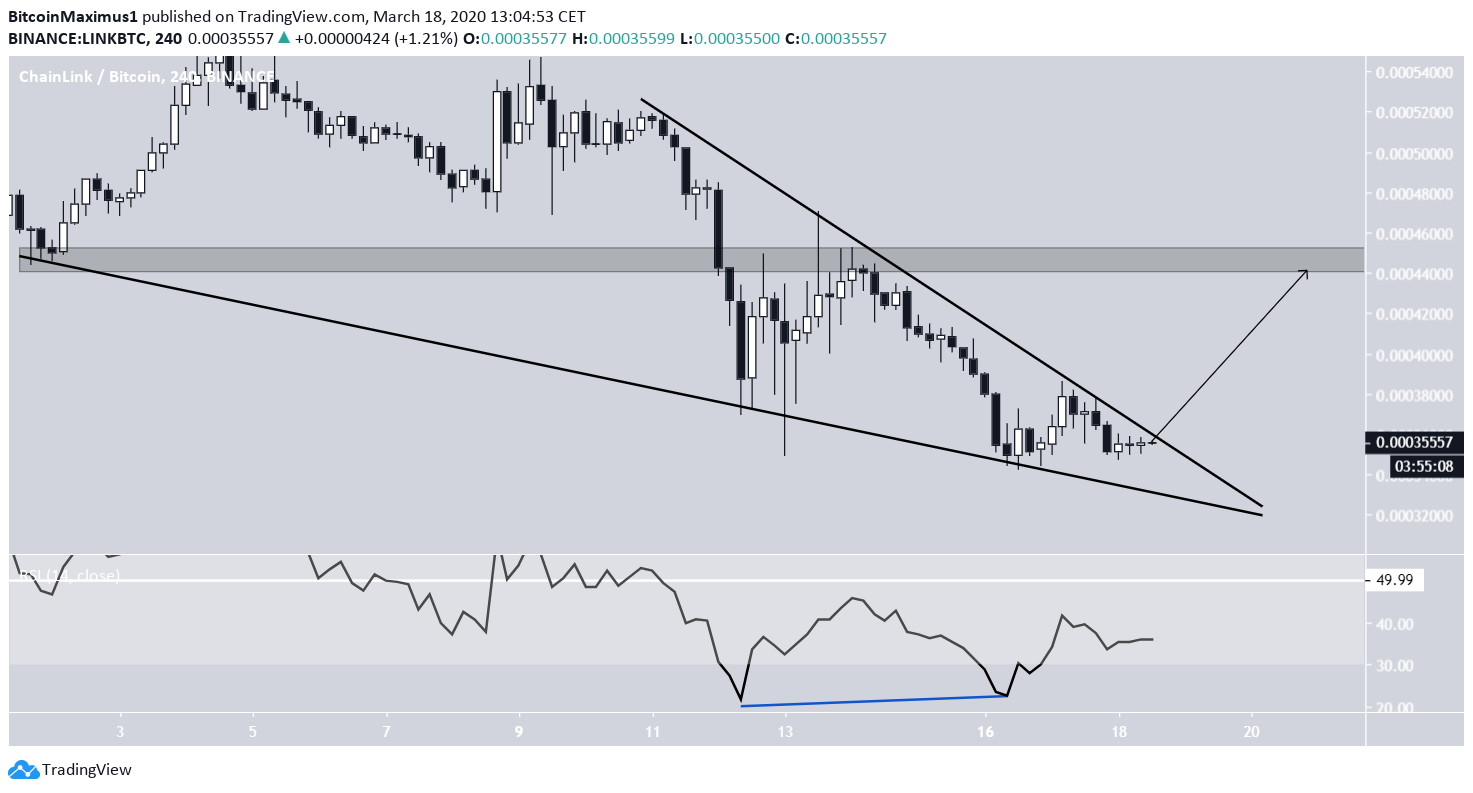
To conclude, the LINK price has decreased all the way to a significant support area. Due to the fact that it is also trading inside a short-term bullish pattern, we believe it will soon bounce toward the resistance area at 45,000 satoshis.



