The LINK price has twice reached a high near $4.9, on Feb. 19 and March 4. Both times, it failed to break out above it and a decrease with a similar magnitude followed.
Chainlink (LINK) Price Highlights
- The price is trading inside an ascending channel.
- The RSI has generated considerable bearish divergence.
- LINK is following a long-term ascending support line.
- There is support at $3.2 and $2.5.
Full-time trader @CryptoMichNL tweeted a LINK price chart saying that his outlook has begun to turn bearish, especially if the price manages to lose the $3.9 support level. If that happens, he believes the price could drop as low as $2.5.
Disclaimer; I'll start running after posting this tweet.
But, $LINK is on the edge here. Some bearish divergences showing up and look not too great.
Losing $3.90 and I'd target $3.30-3.50, but mostly $2.50-2.80.
Holding here and we can attack $4.80. pic.twitter.com/i0iaTiRTR1
— Michaël van de Poppe (@CryptoMichNL) March 11, 2020
Let’s take a closer look at the LINK price chart and determine where it is heading to next.
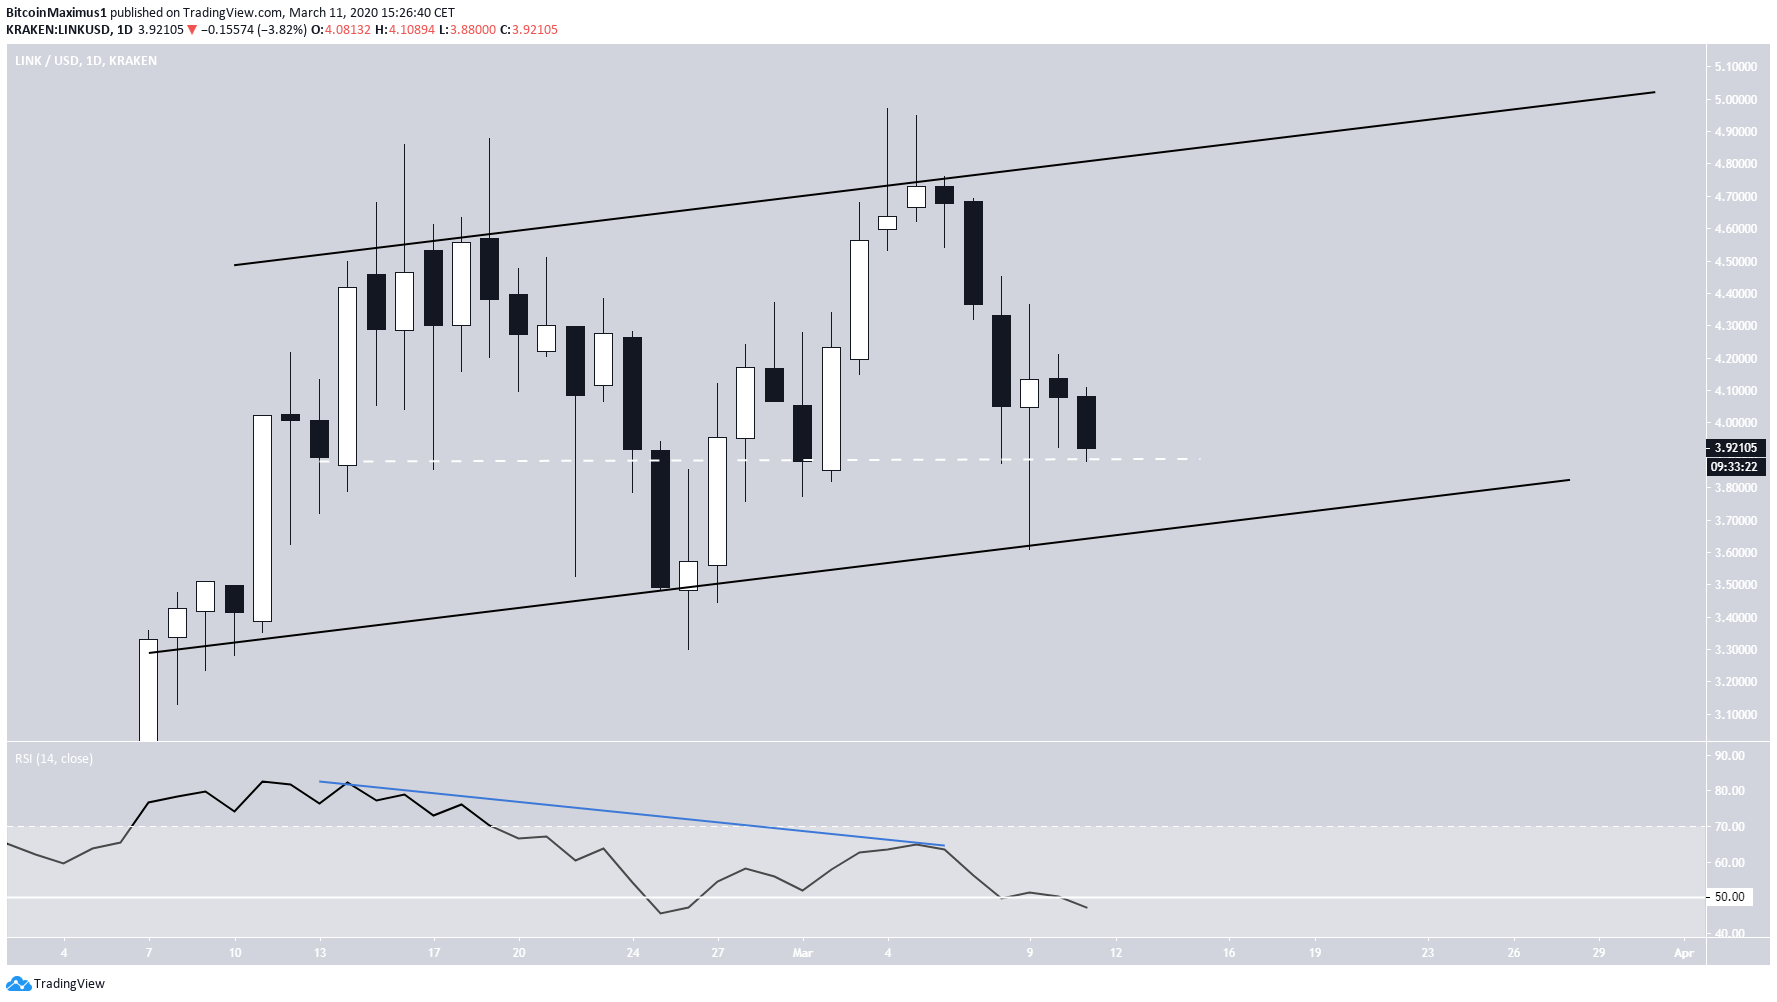
Ascending Channel
The LINK price has possibly been trading inside an ascending channel since Feb. 8. During the recent highs at the resistance line, the daily RSI generated very significant bearish divergence. In addition, it has almost decreased below 50, which would indicate that the price is in a bearish trend.
As stated in the tweet, the $3.9 level holds immense importance. Besides the rapid decrease on Feb. 25, which likely resulted because of the decrease in the BTC price, LINK has not reached a daily close below $3.9. If it were to do so, along with an RSI movement below 50, it would be indicative that the price will break down from the channel and reach new lows.
Future Movement
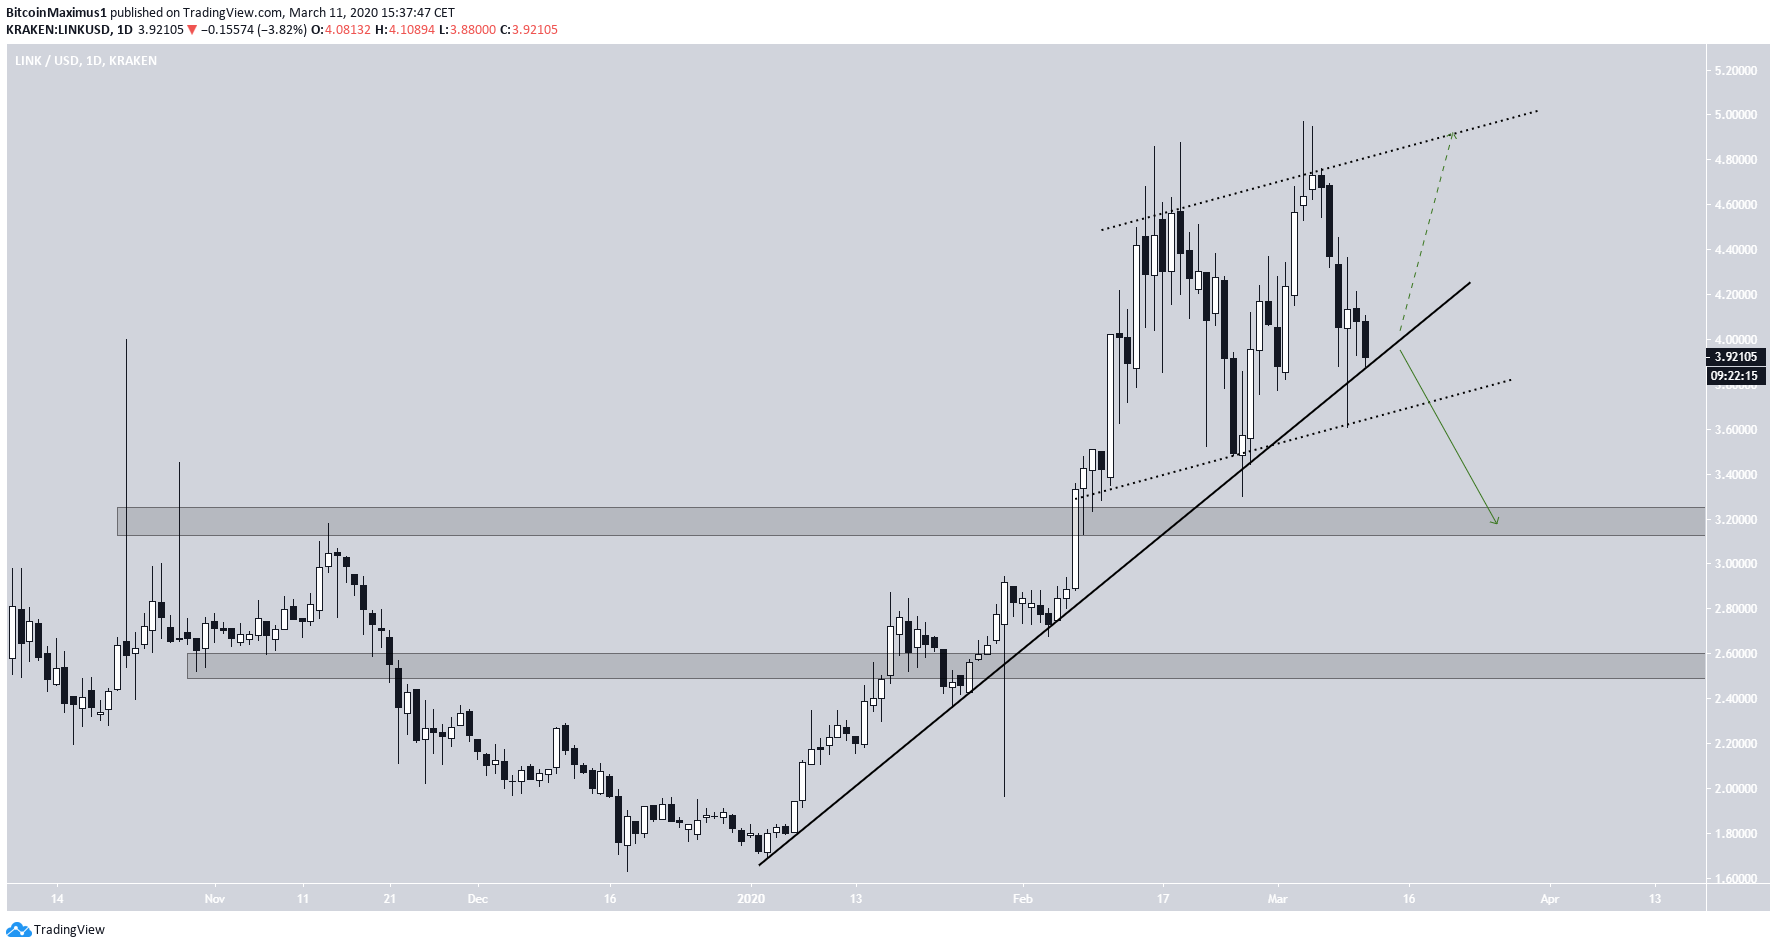
When we zoom out, we can see that the price is also following an ascending support line, which is very close to the support line of the channel. Furthermore, the price has found support above its 50-day moving average (MA).
This further solidifies the importance of the $3.9 level, since a decisive close below it would cause the loss of several important support levels.

There are two outlines for the future movement. Either the price bounces at the current level and makes another attempt at breaking out above $4.9, or it decreases towards the next support areas at $3.2 and $2.5.
The first one looks more likely, due to the bearishness from the technical indicator and overall cryptocurrency market.