


On Apr 3, 2019, the price of Zcash (ZEC) reached a high of $78 and €69. A sharp decrease was followed by a gradual increase. The price reached similar levels on Apr 8.
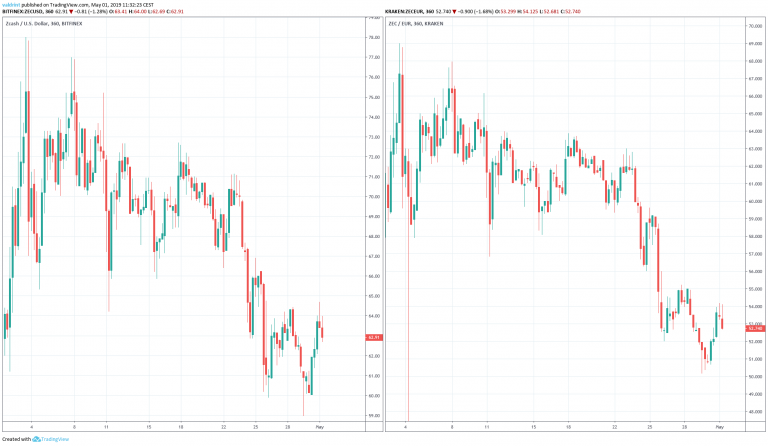
A gradual downtrend ensued. The price has been decreasing since.
Will price losses continue for Zcash or can we expect a reversal soon?
Let’s find out!
Zcash (ZEC): Trends and Highlights for May 1, 2019
- ZEC/USD and ZEC/EUR have been on a gradual downtrend since Apr 3.
- It is trading inside a descending channel.
- Bullish divergence is developing in the RSI and the MACD.
- There is resistance near $65 and €56.
Current Trading Pattern
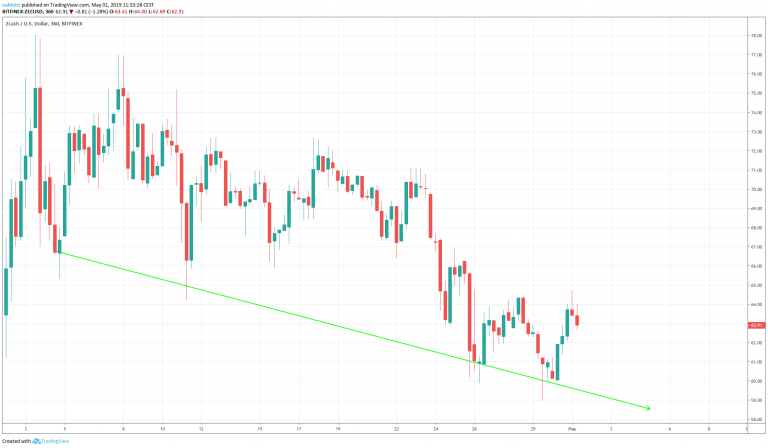
The price made a low of $65.32 on Apr 4. A gradual upward move followed. Several market cycles have been completed since and the price has reached lower lows each time.
Tracing these lows gives us a descending support line:
On Apr 3, the price reached a high of $78.00. A sharp drop was followed by a gradual increase. The price has made successively lower highs.
Tracing these highs gives us a descending resistance line. The resistance and support lines combine to create a descending channel:
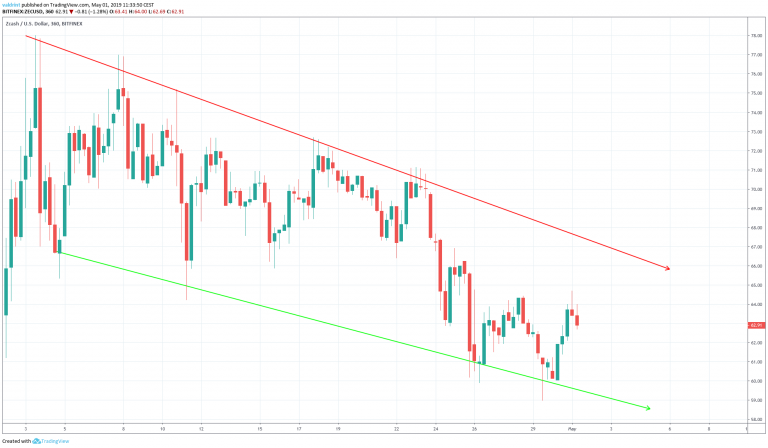
It is likely that the price will keep trading within the confines of this channel until a decisive move occurs.
In order to figure out the direction of the move, we need to take a look at some technical indicators.
What Do the Technical Indicators Say?
To better assess future price fluctuations, we analyze the price of ZEC alongside the RSI and the MACD.
Combining RSI bullish/bearish divergence with support/resistance essentially predicts price fluctuations. They are shown alongside Zcash’s current trading pattern below:
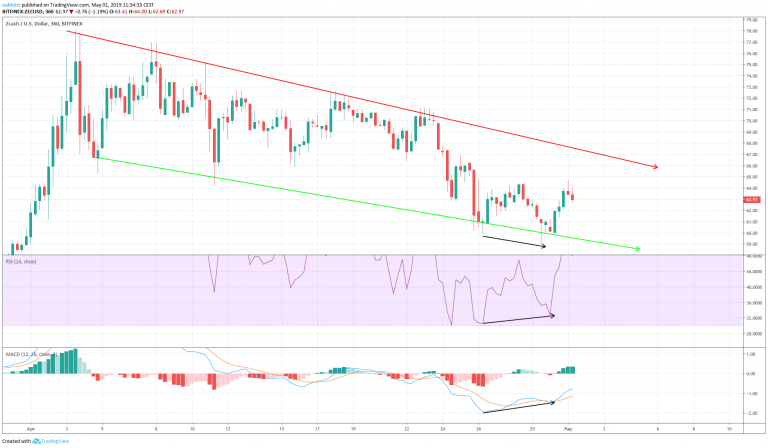
On Apr 26, the price made a low of $59.88 On Apr 29, it made another low of $58.97.
Similarly, the RSI and the MACD made the first low on Apr 26. However, they have continued to generate higher values since.
This is known as bullish divergence and often precedes price increases.
The use of these indicators suggests that the price will continue to increase towards the resistance line of the channel.
Finding Resistance
To determine possible future price levels we incorporate resistance areas into the analysis.
One possible support area is shown for both ZEC/USD and ZEC/EUR below:
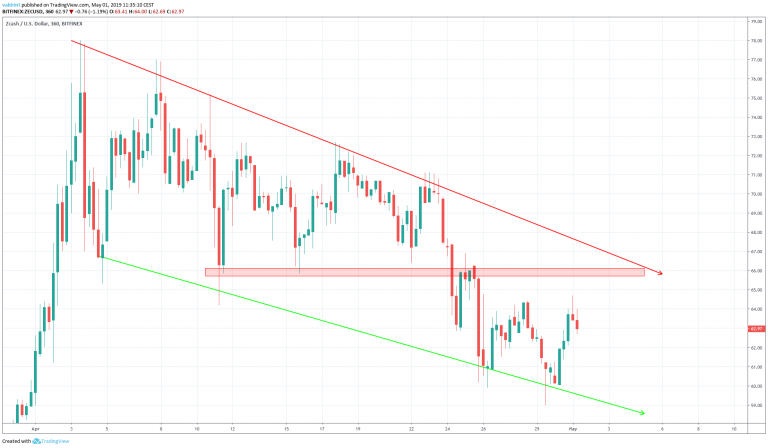
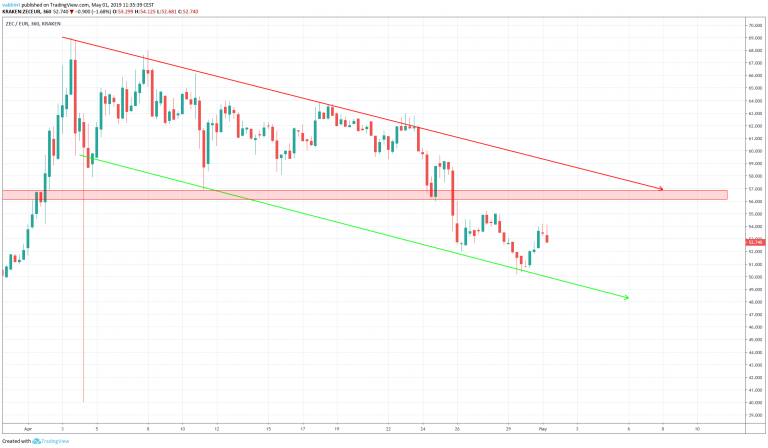
The closest resistance area is found near $65 and €56. We believe that the price will reach this area.
Summary of Analysis
Based on this analysis, the price will likely keep increasing towards the resistance line of the channel. Before it does, we believe it will reach the resistance area outlined above.
Do you think the price of ZEC will reach the resistance area? Let us know in the comments below.
If you’d like to read the long-term price predictions of Zcash, click on the blue button below:
Disclaimer: This article is not trading advice and should not be construed as such. Always consult a trained financial professional before investing in cryptocurrencies, as the market is particularly volatile.


