![When Will the Tezos Correction End? [Premium Analysis]](/_mfes/post/_next/image/?url=https%3A%2F%2Fassets.beincrypto.com%2Fimg%2F40V0oO-XCTC0gw7BUR79bMGbMuI%3D%2Fsmart%2F4ee33e5367f147b192a8cea80757c4ca&w=1920&q=75)
On December 17, 2019, the Tezos price reached a high of 25,220 satoshis. It has been decreasing since.
On January 16, it created a bullish engulfing candlestick and broke out above the descending resistance line in place since the aforementioned high.
In lieu of this movement, bitcoin and altcoin trader EuroSniper (@TheEuroSniper) posted a Tezos price chart in which the price is following an ascending support line, and could increase by as much as 17%.
$XTZ / $BTC pic.twitter.com/0cyynAKWWR
— €uroSniper (@TheEuroSniper) January 16, 2020
Let’s take a closer look at the price movement and see where XTZ is heading to next.
Long-Term Areas
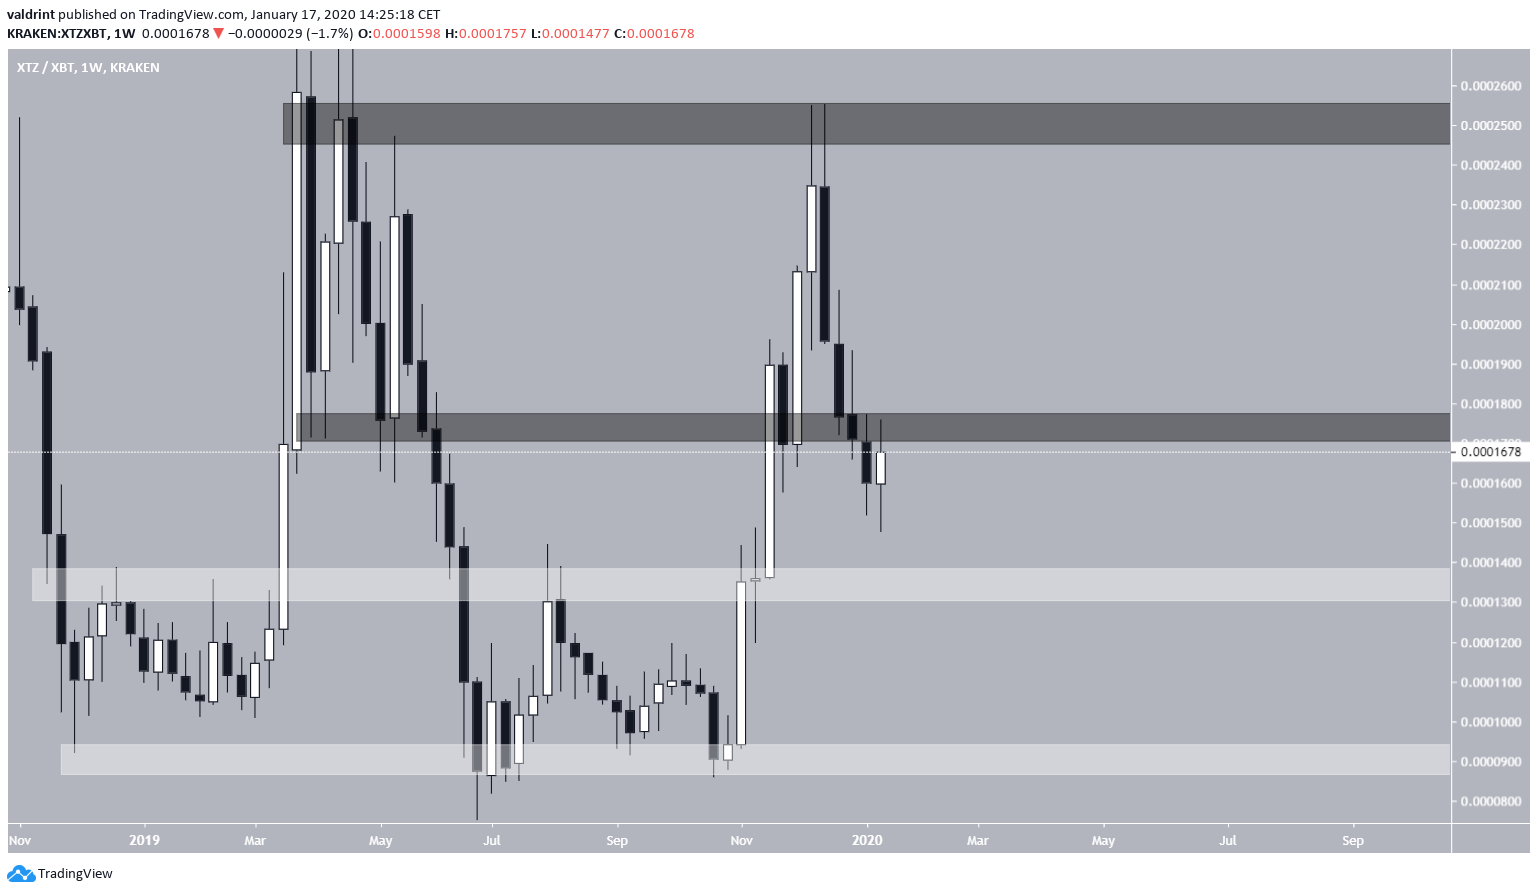
When looking at the weekly Tezos chart, we can see two significant support and resistance areas.
The support areas found at 9000 and 13,500 satoshis, while the resistance at 17,000 and 25,000 satoshis, respectively.
At the current time, it seems that the price broke down below the 17,000 satoshi area and is in the process of validating it as resistance. If so, we would expect the price to decrease until it reached the 13,500 satoshi support.
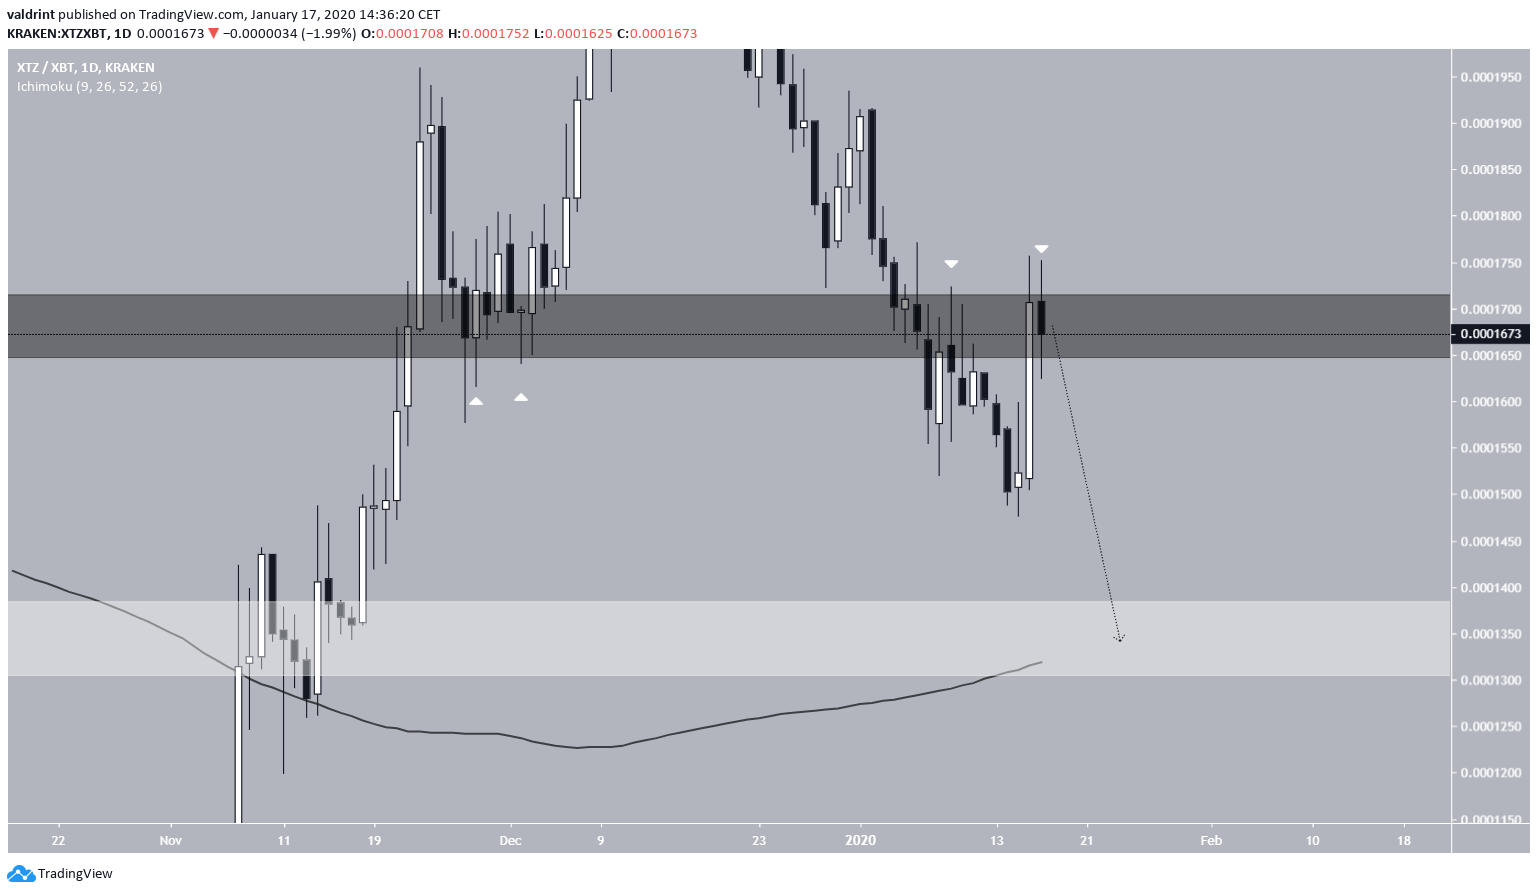
Looking at the daily time-frame, it indeed seems as if the current movement is a retest of the resistance area.
The price created several lower wicks in December 2019, before moving upward. In addition, the current daily candle has failed to reach a close above the resistance area, creating two successive upper wicks.
If the price decreases towards the 13,000 satoshi support, it would also validate the 200-day moving average (MA), which is likely to add to the support, preventing the price from breaking down.
Tezos Breakout Validity
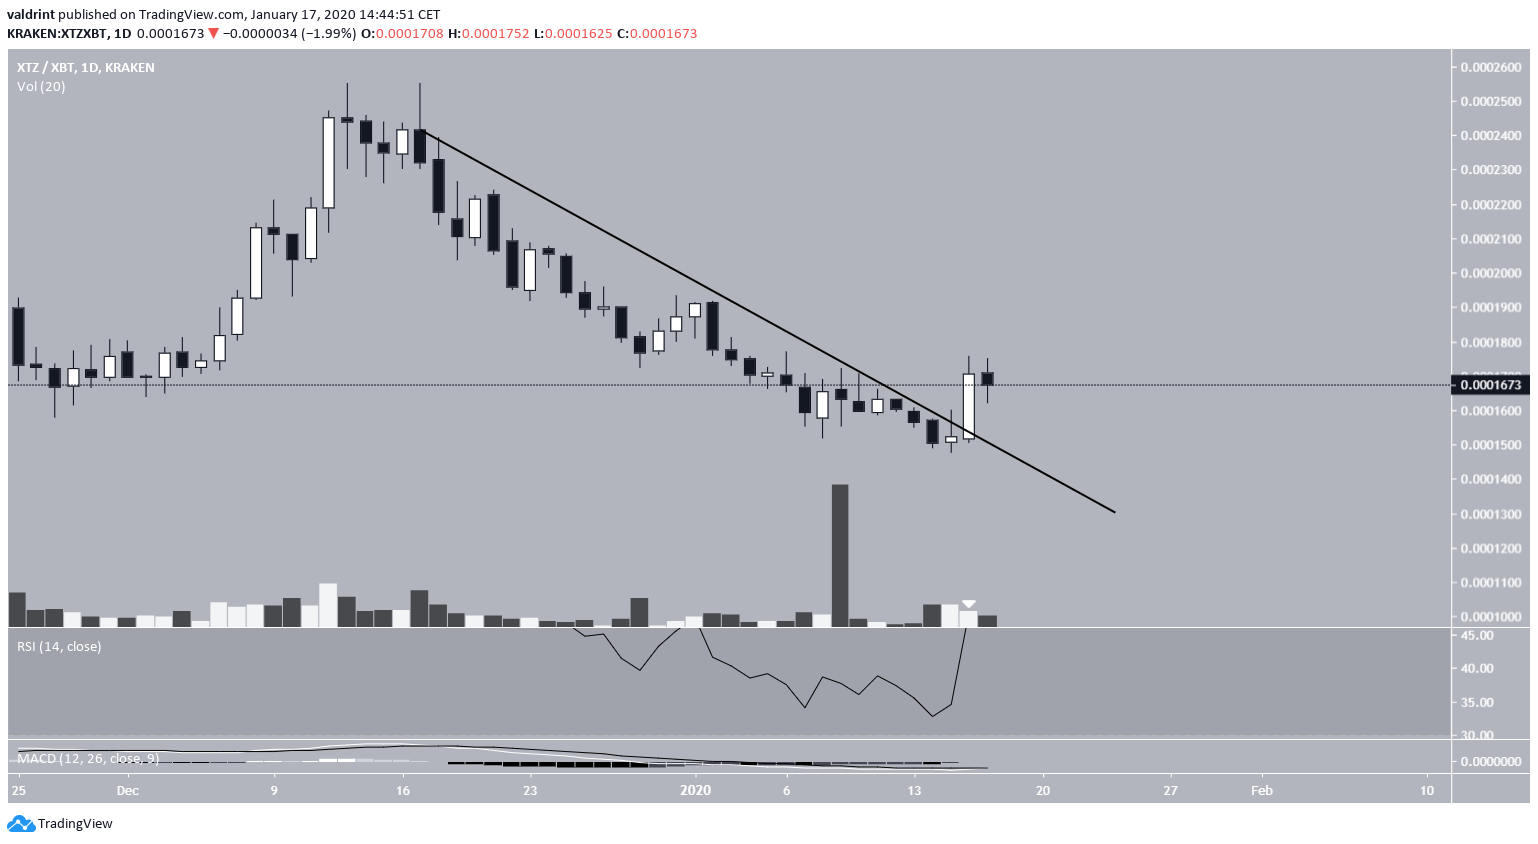
Staying with the daily time-frame, we can see that on January 16, the price broke out above a descending resistance line, which had been in place since the high of December 17, 2019.
However, the breakout transpired with almost non-existent volume. In addition, there was no bullish divergence to precede this breakout. Combining this with the fact that the price failed to close above the resistance area, we think this breakout is not legitimate and the price will soon decrease.
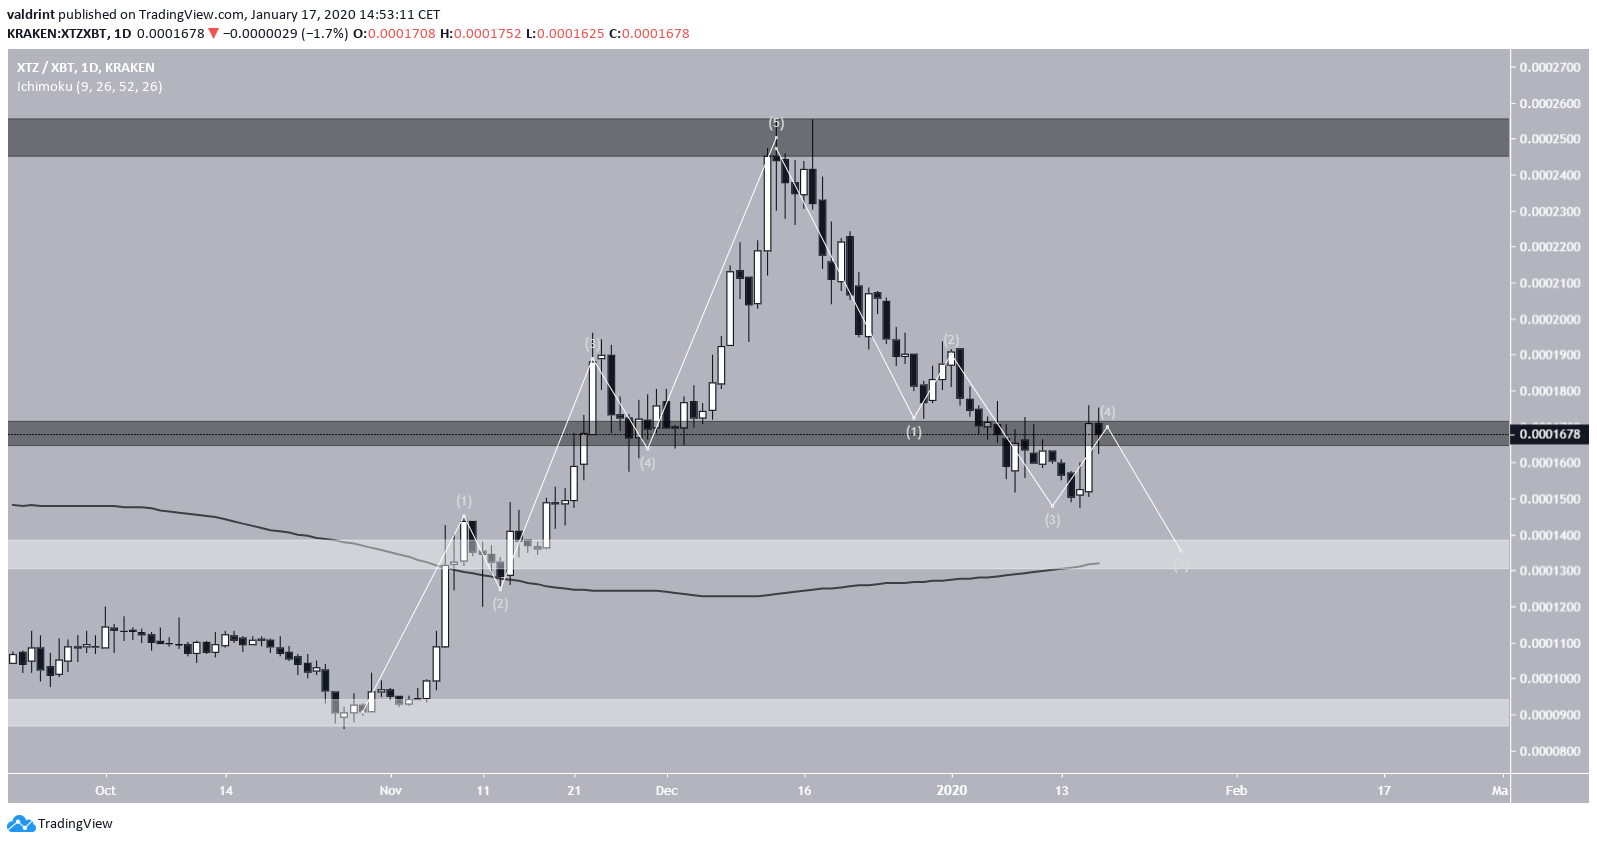
The price movement until the high of 25,500 satoshis resembles a five-wave Elliott formation. What follows is usually an A-B-C correction. However, it seems that the price has created another five-wave correction, which while unusual is not unheard of.
This correction is expected to end at the support offered by the 13,500 satoshi area and the 200-day moving average (MA). Afterward, the price could make another attempt at creating an all-time high.
To conclude, the Tezos price is nearing the end of the correction. We believe it will do so once it reached the support area at 13,500 satoshis, and from there begin an upward movement.
For a longer-term analysis that deals with possible price movement in 2020, click here.
