
DIA has broken down from a crucial support area and reached a new all-time low price. Neither DIA or the DeFi Index have given signs that a reversal of the ongoing bearish trend is near.
DIA Reaches All-Time Low
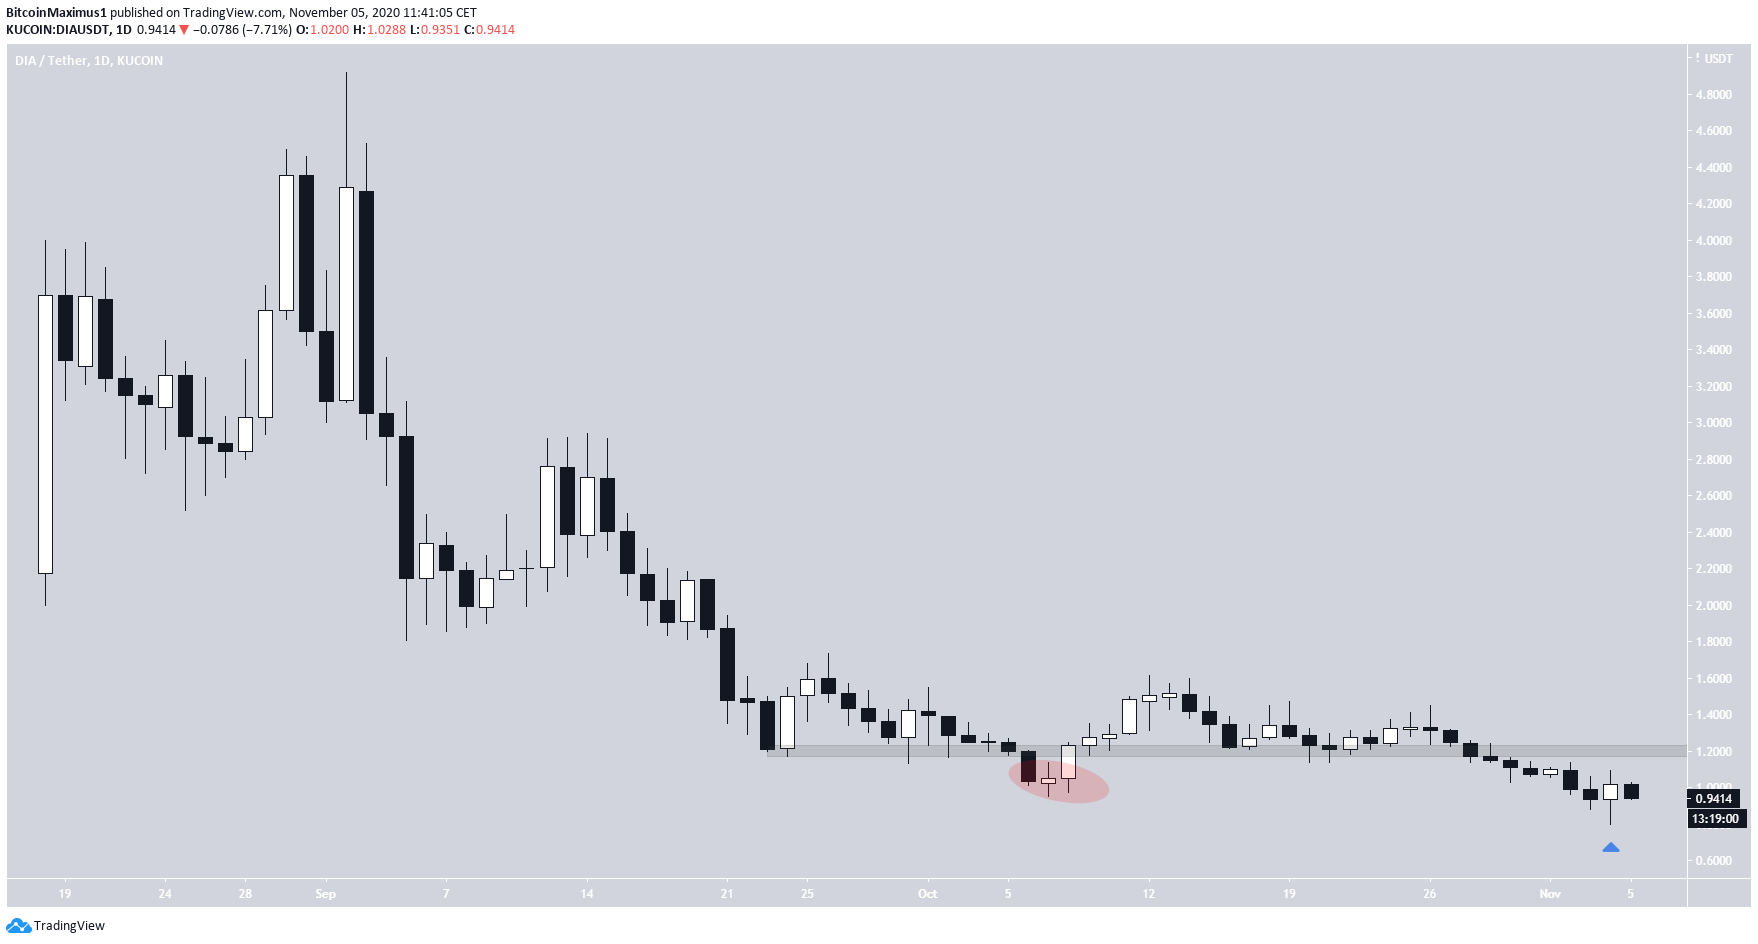
On Oct 7, the DIA price reached a low of $0.95 (shown with the red circle below), purportedly breaking down from the $1.20 support area, but reclaiming the level shortly afterward.
This initially seemed like a deviation below the range low, which often follows with a significant move in the other direction.
Despite this, the price broke down from the area at the beginning of Nov. and reached a low of $0.80 on Nov 4. This was a new all-time low, causing DIA to move into price discovery territory.
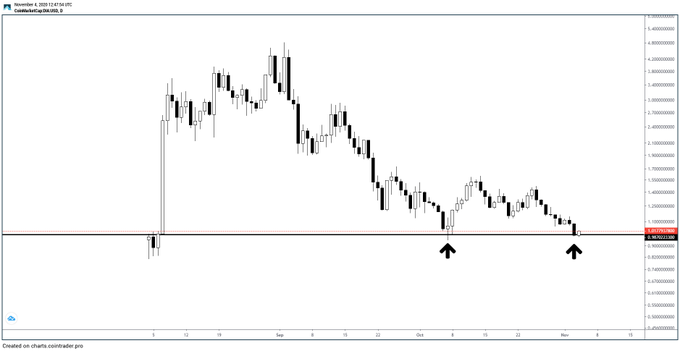
Cryptocurrency trader @Pastore1314 stated that “$DIA is my first buy for the next cycle” and outlined a potential double bottom pattern.
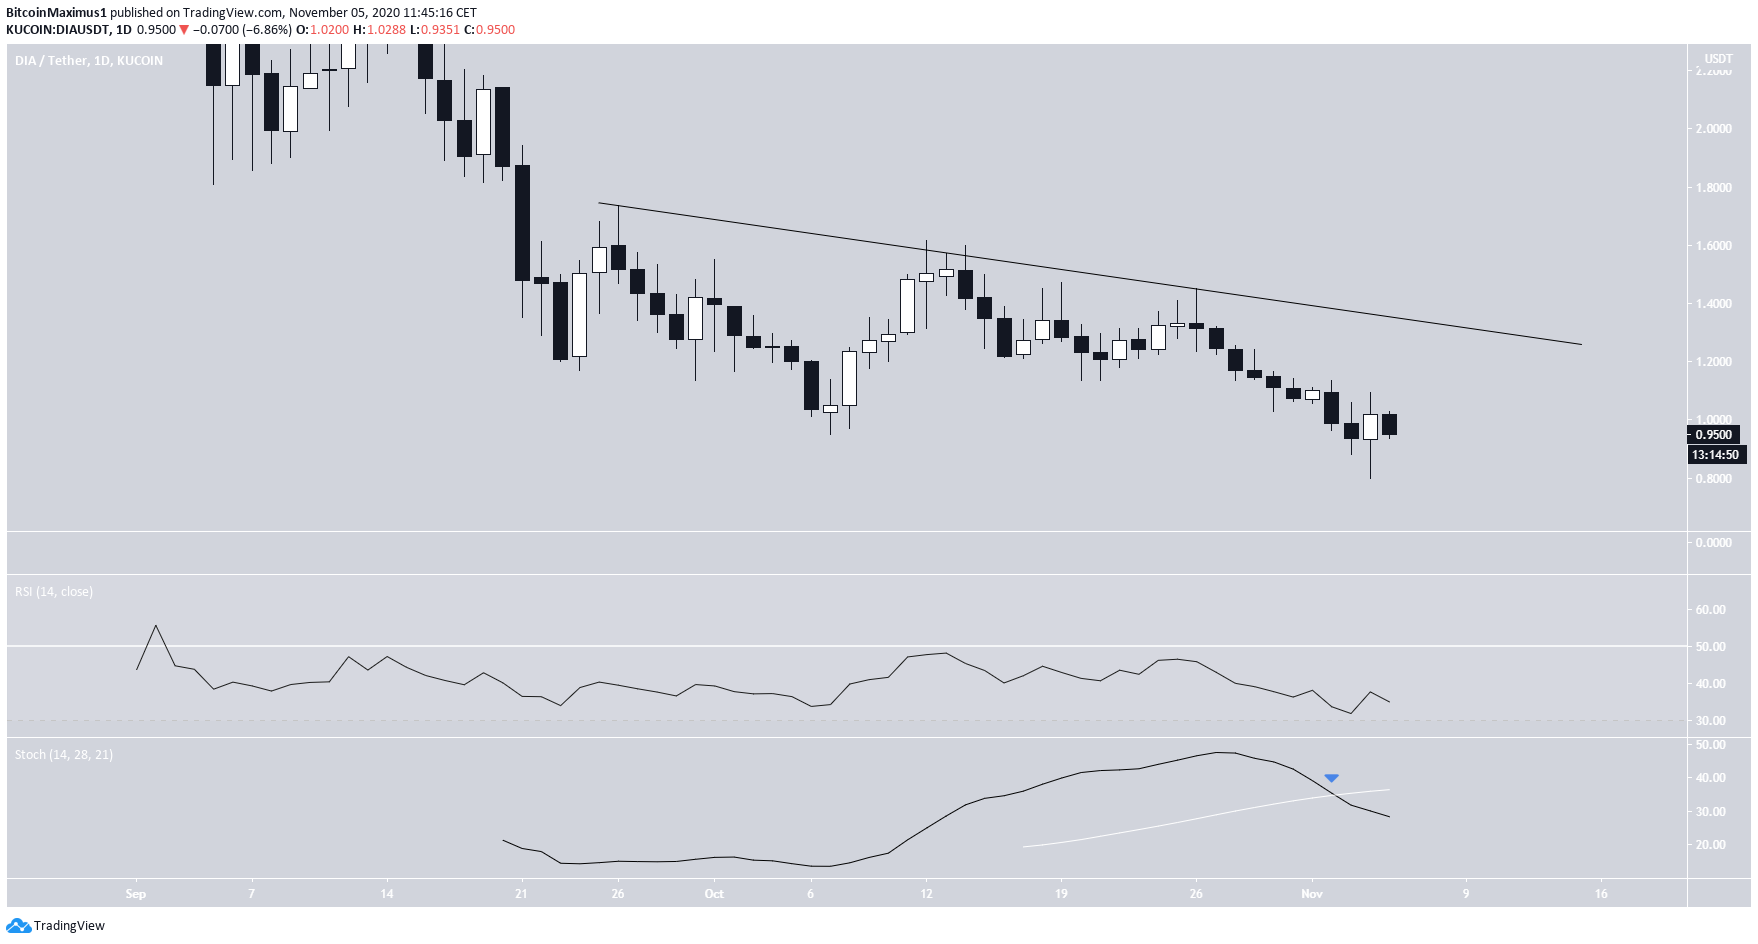
Since the tweet, however, DIA has broken down from the support area and created a lower low instead. Technical indicators do not yet give any reversal signs, since there is no bullish divergence on the RSI. Furthermore, the Stochastic Oscillator has already made a bearish cross.
The price is following a descending resistance line. Until the price successfully breaks out above this line, the trend is still bearish.
DeFi Index
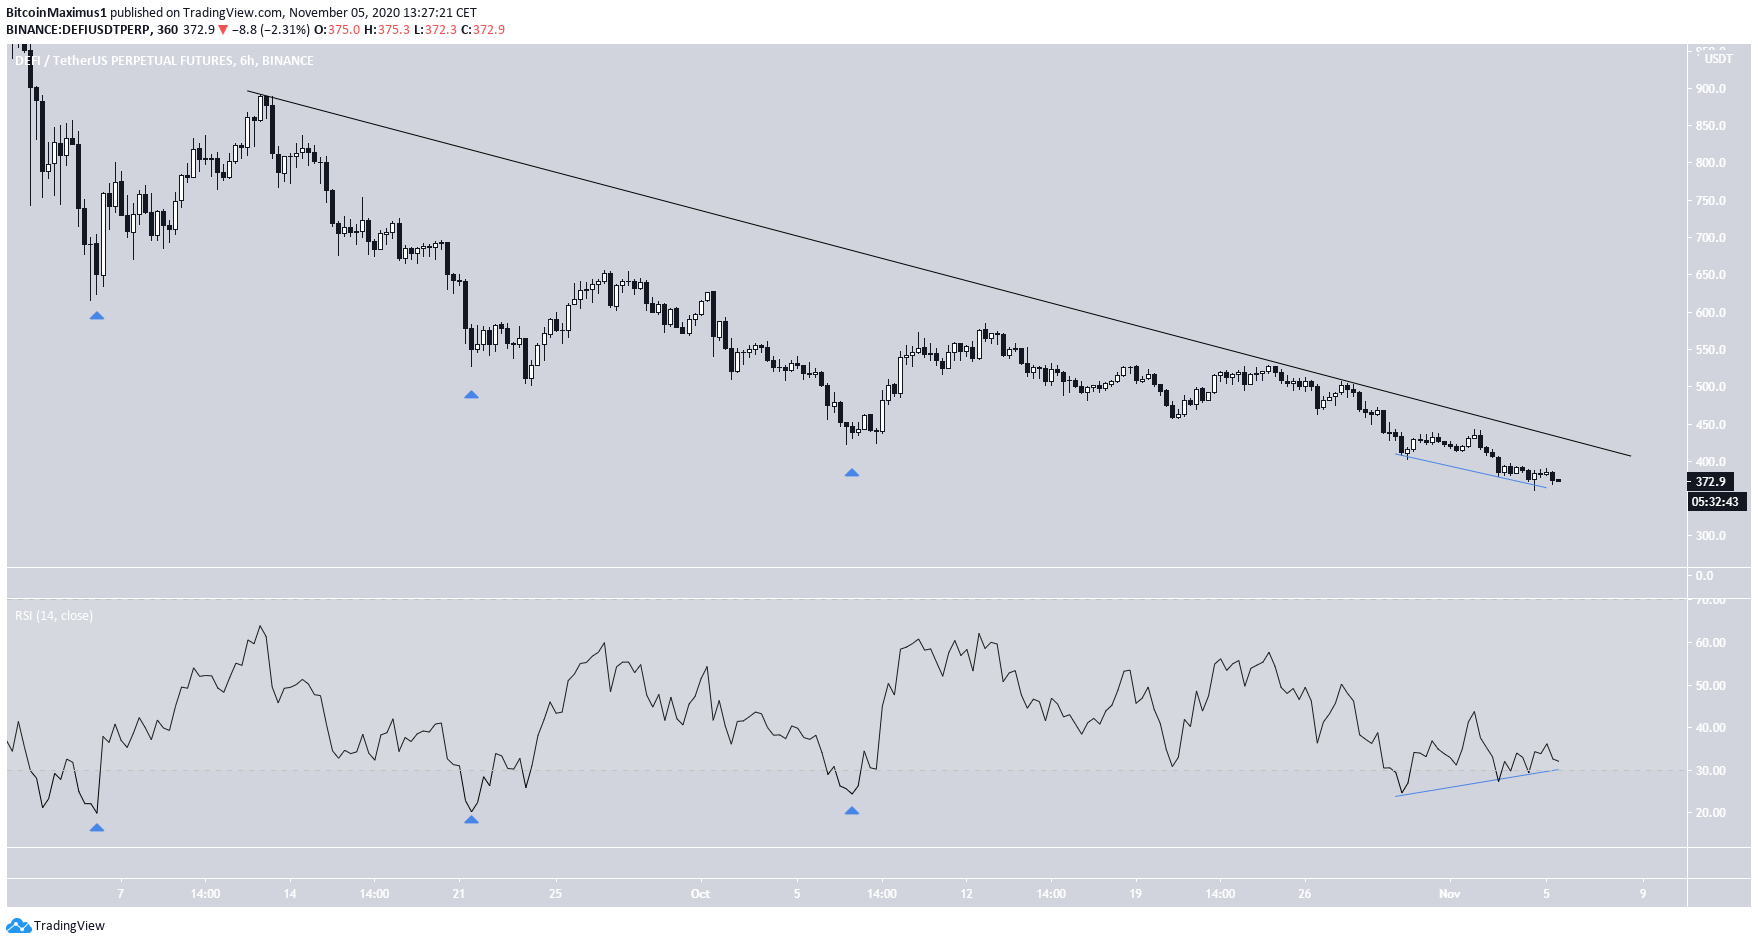
Similarly to DIA, the DeFi Perpetual Index (DEFI) has also been falling alongside a descending resistance line since Sept 8.
However, unlike DIA, there is some bullish divergence developing on the medium-term RSI, which is also in oversold territory. The three previous times the RSI was this oversold, upward movements of different magnitudes took place.
However, until the price successfully moves above the descending resistance line, the trend is bearish.
Conclusion
The DIA price has broken down from a crucial support level and reached an all-time low.
The DEFI index is also trading near an an all-time low but has given some bullish reversal signs.
Both are following descending resistance lines, and until those are broken, the trend is bearish.
For BeInCrypto’s previous Bitcoin analysis, click here!
Disclaimer: Cryptocurrency trading carries a high level of risk and may not be suitable for all investors. The views expressed in this article do not reflect those of BeInCrypto.
