


The PEPE price broke out from a long-term descending resistance trend line and nearly reached a new all-time high this week.
While PEPE suffered a slight rejection on February 28, the price still trades above a minor horizontal support area.
PEPE Breaks Out From Long-Term Resistance
The weekly time frame chart shows that PEPE has fallen under a descending resistance trend line since shortly after the all-time high in May 2023. The trend line caused three rejections (red icons).
After starting an upward movement in February, the PEPE price finally broke out this week amidst a 116% weekly increase. PEPE reached a high of $0.00000368 before falling slightly. Despite the price drop, PEPE still trades above the final horizontal resistance area in the weekly time frame.
Read more: How To Buy PEPE (PEPE) and Everything You Need to Know
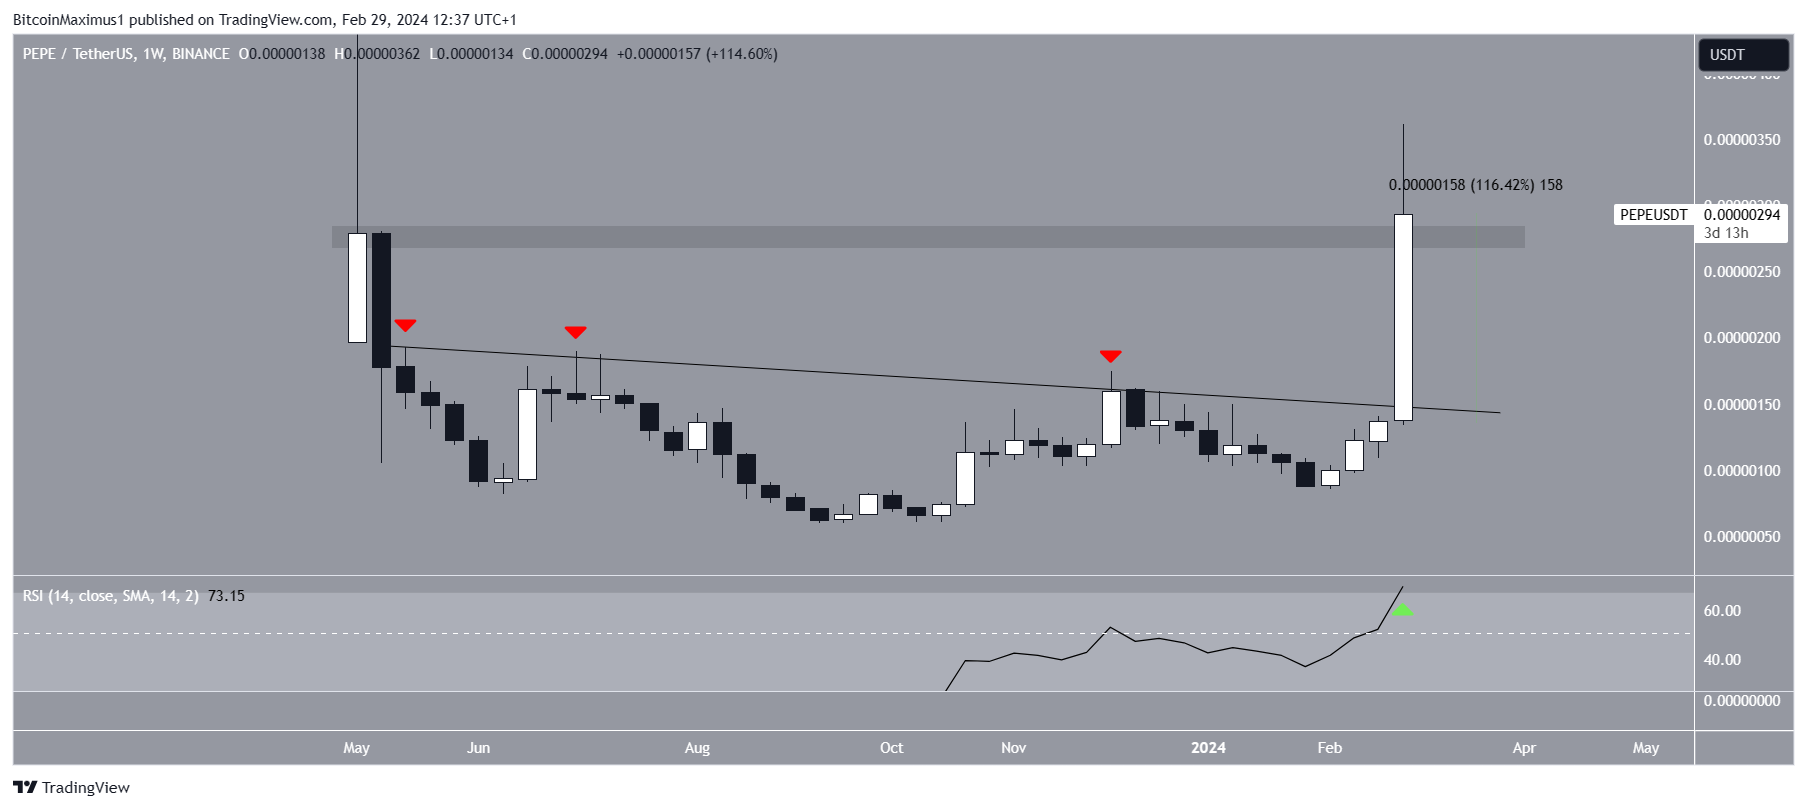
The weekly Relative Strength Index (RSI) supports the breakout. When evaluating market conditions, traders use the RSI as a momentum indicator to determine whether a market is overbought or oversold and whether to accumulate or sell an asset.
If the RSI reading is above 50 and the trend is upward, bulls still have an advantage, but if the reading is below 50, the opposite is true. The indicator is trending upward and above 50, both signs of a bullish trend.
PEPE Price Prediction: A New All-Time High?
The technical analysis of the daily time frame supports the continuation of the upward movement because of the wave count. Technical analysts use the Elliott Wave theory to determine the direction of a trend, which involves studying recurring long-term price patterns and investor psychology.
The most likely count suggests that PEPE is in wave three of a five-wave upward movement, having potentially started wave four. Wave three has nearly 2.61 times the length of wave one, a likely level for a local top.
Since the rejection, PEPE has returned toward the $0.00000270 support area. If the count is correct, PEPE will bounce at this support area and then begin a 70% increase to the next resistance at $0.0000050, which would be a new all-time high price.
Read more: 5 Best PEPE Wallets
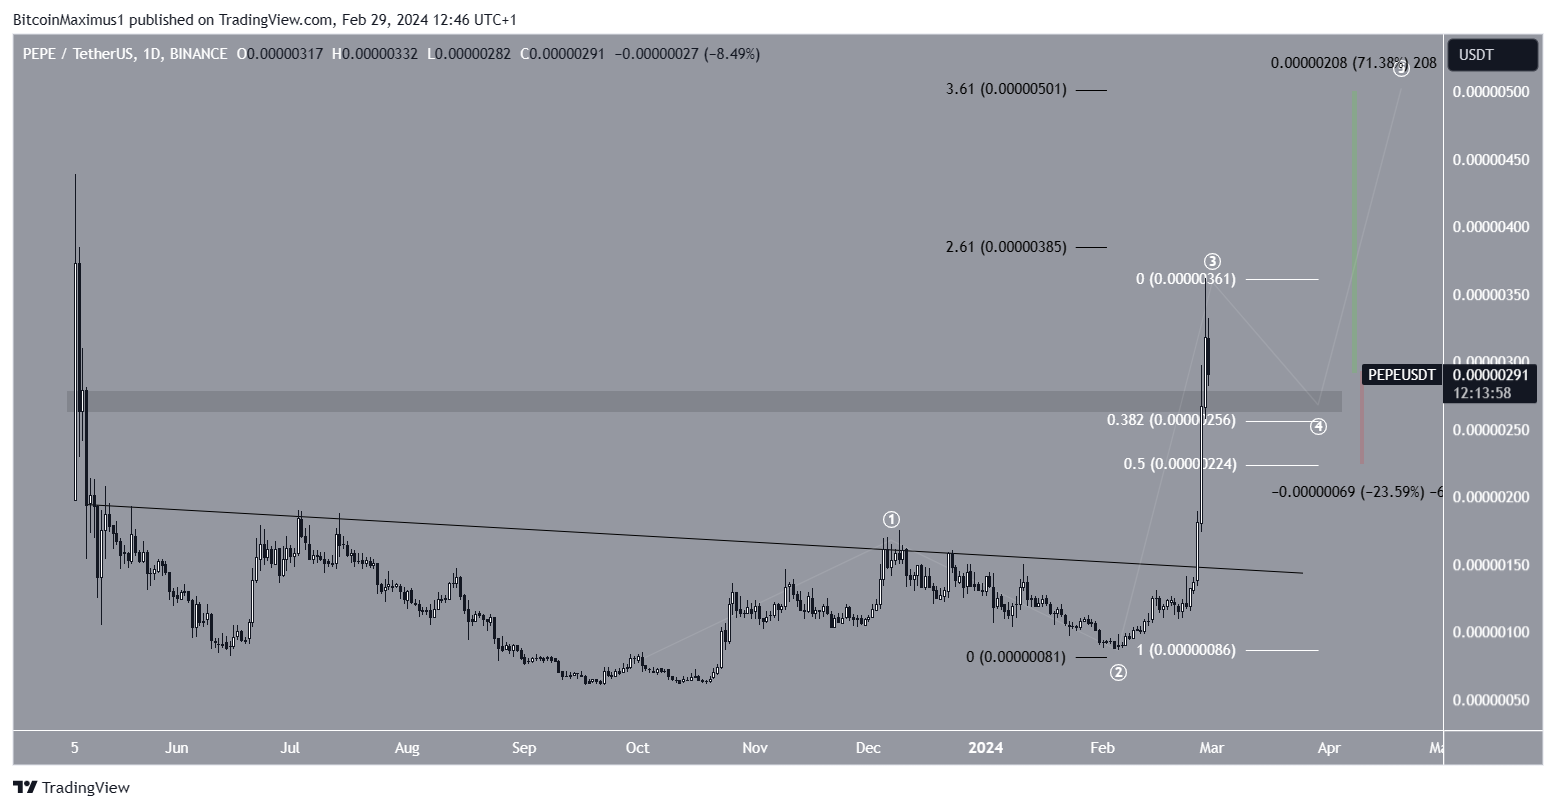
Despite the bullish PEPE price prediction, closing below the $0.00000270 horizontal area means wave four will retrace further. PEPE could decrease by 25% to the next closest support at $0.0000024 in that case.


