Dusk Network (DUSK) is approaching a very strong resistance area created by a confluence of Fib levels, which could cause a rejection.
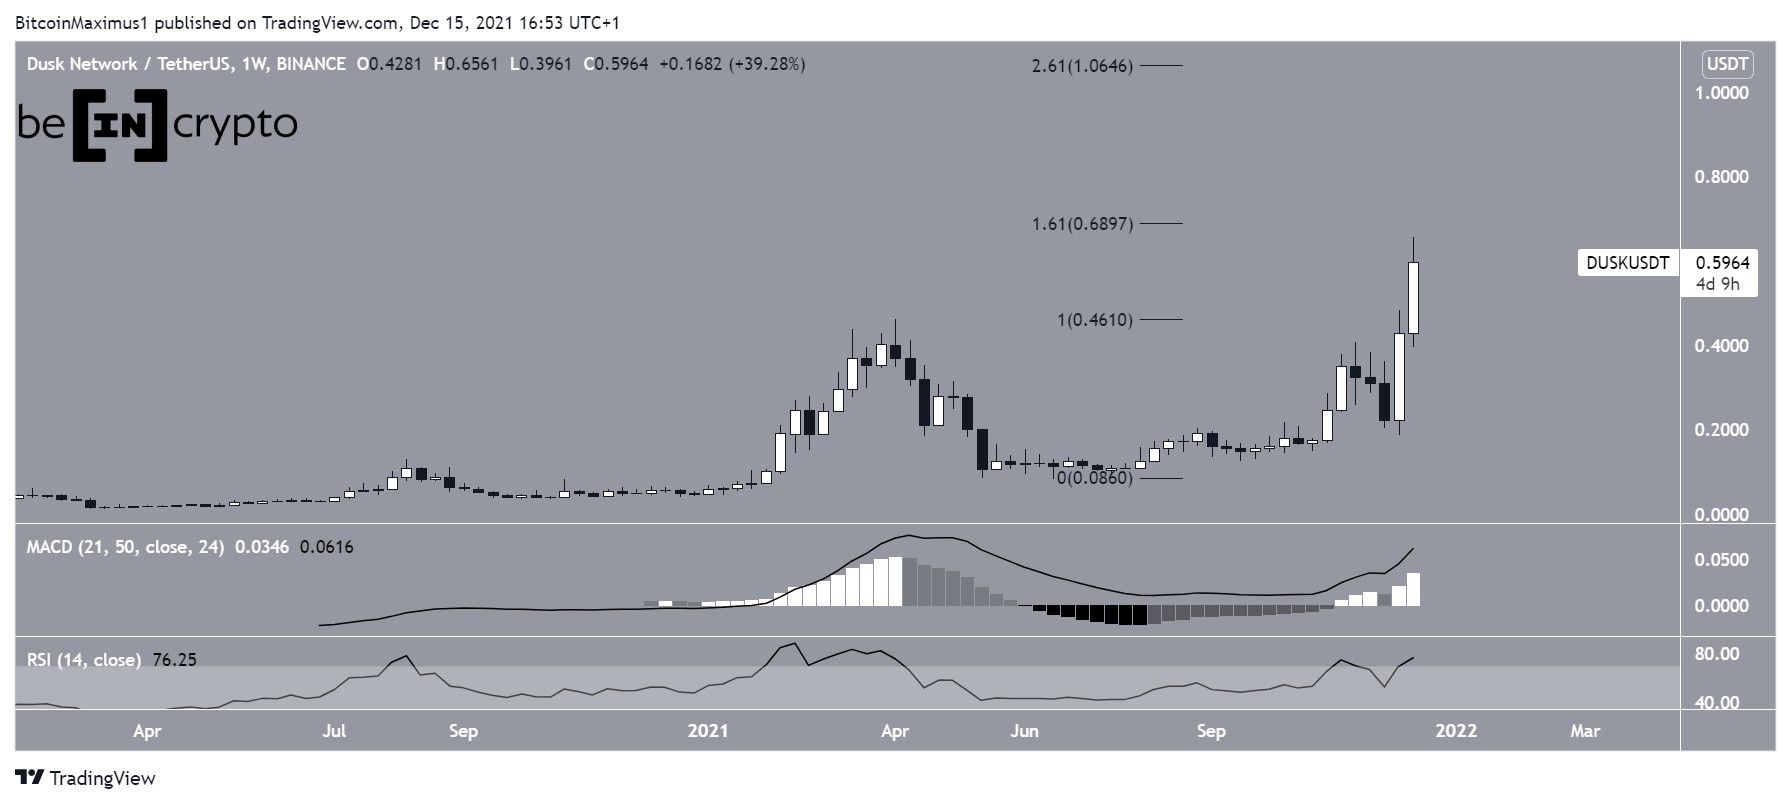
The weekly chart shows that DUSK has nearly tripled in price over the past two weeks, culminating with a new all-time high of $0.656 on Dec 15.
The high was made very close to the 1.61 external Fib retracement resistance level at $0.69. This Fib level very commonly acts as resistance after the price reaches a new all-time high.
Despite being close to resistance, technical indicators have yet to show any signs of weakness.
The MACD, which is created by a short- and a long-term moving average (MA), is positive and increasing. This means that the short-term MA is accelerating relative to the long-term one, and is a sign of bullish trends.
In addition to this, the RSI is moving upwards and is above 50. Such readings suggest that the trend is bullish. While the fact that the RSI is above 70 means that it is overbought, it can stay inside this region for a significant period of time. Finally, the sharpest parts of the upward movement usually transpire inside overbought regions.
If DUSK manages to clear the $0.69 resistance area, the next one would be at $1.06, created by the 2.61 external Fib retracement resistance level.
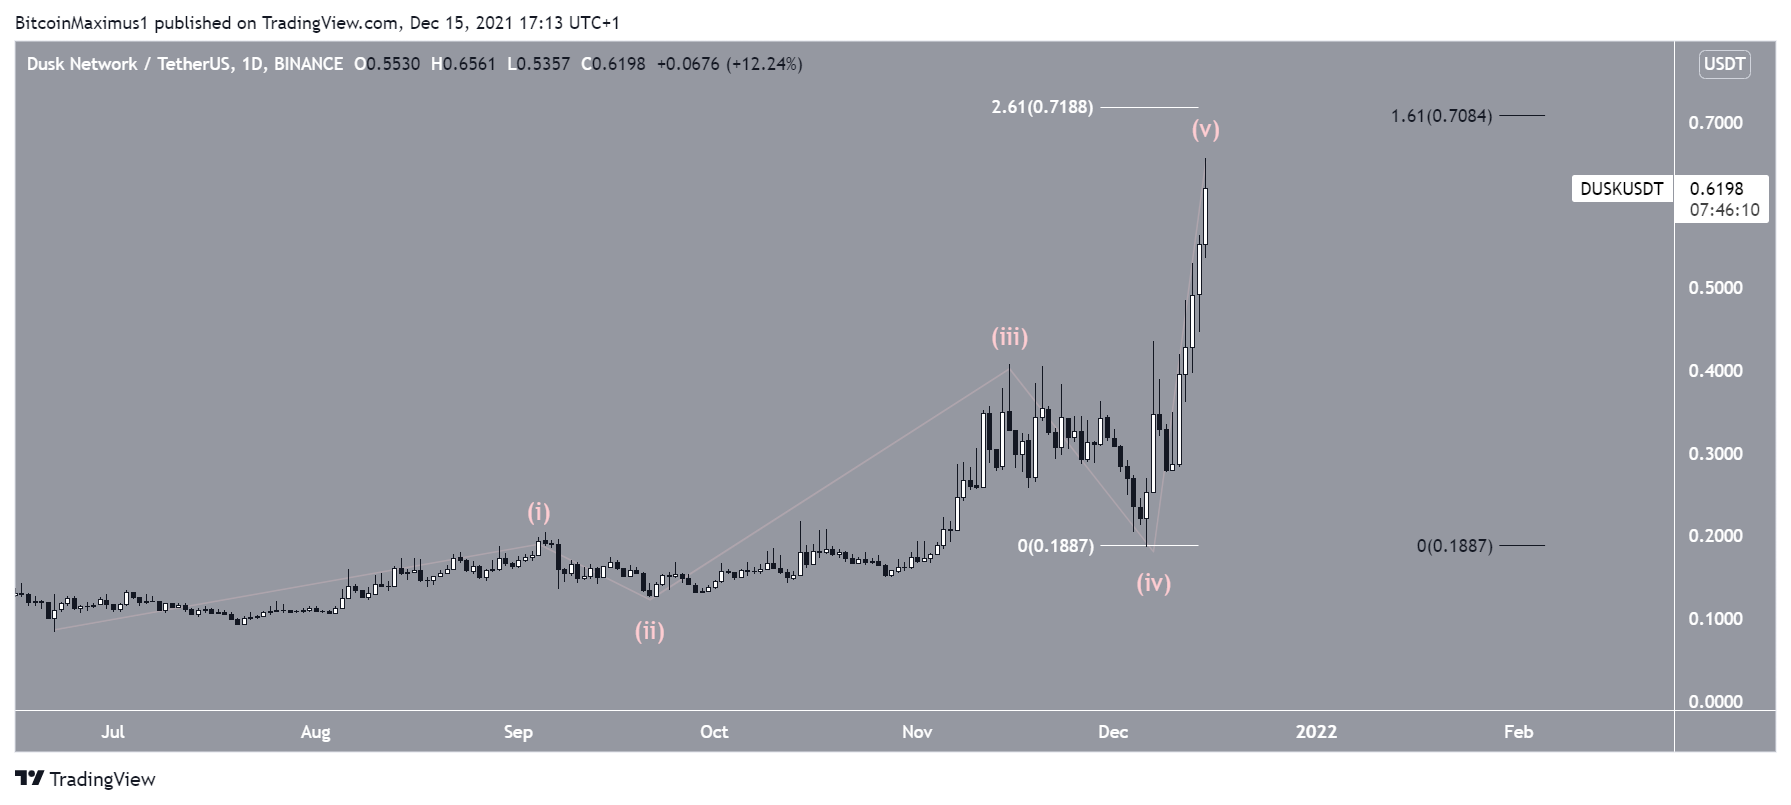
Future movement
A closer look at the movement since June shows what looks like a bullish impulse, which is a five wave movement in the upward direction. If correct, DUSK is in the fifth and final wave of this increase.
The proportion of the waves also suggests that a top near $0.69 is likely. A similar target is given when using an external Fib tool on wave four (white) and when measuring the length of waves 1-3 (black).
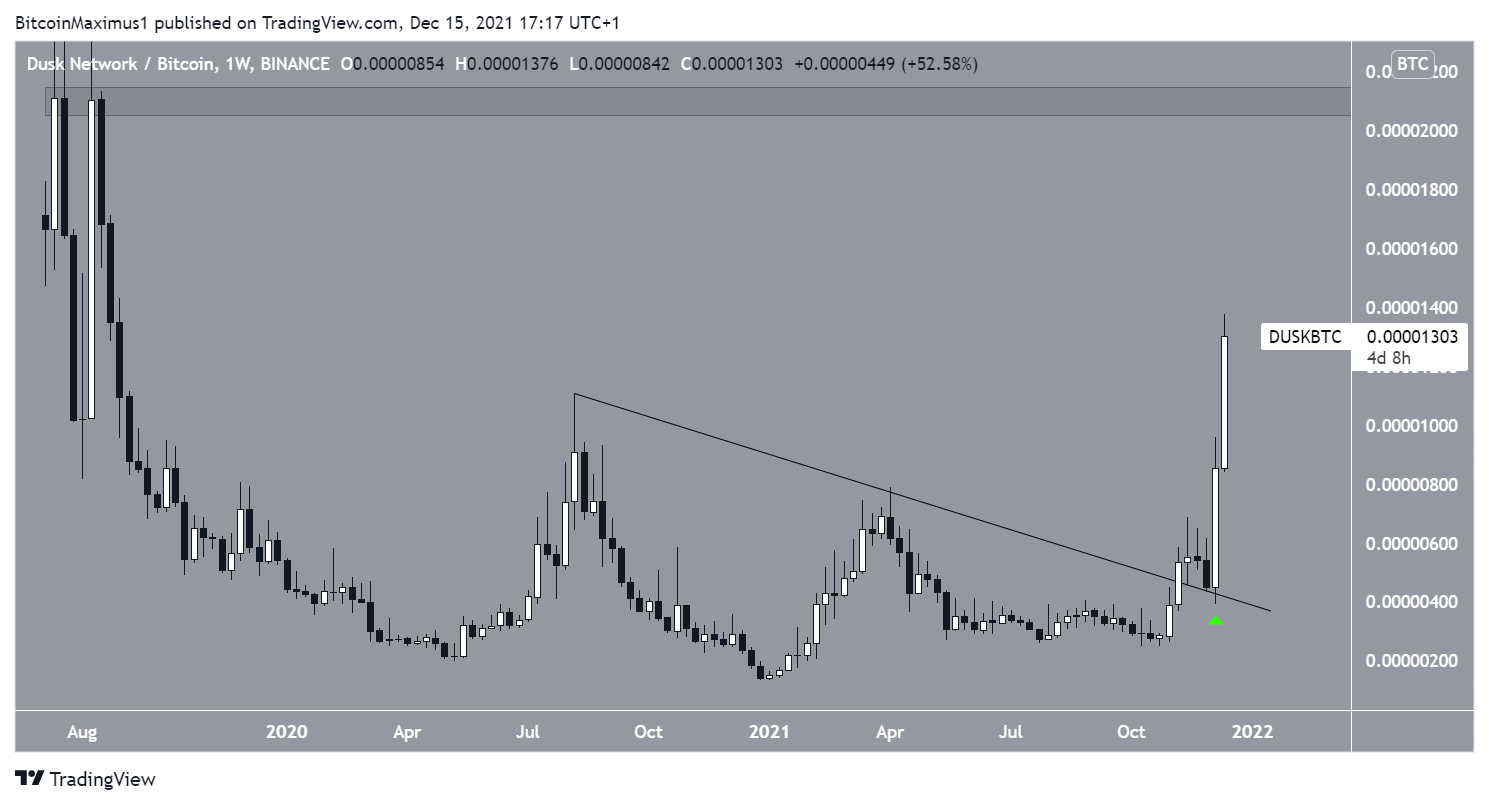
DUSK/BTC
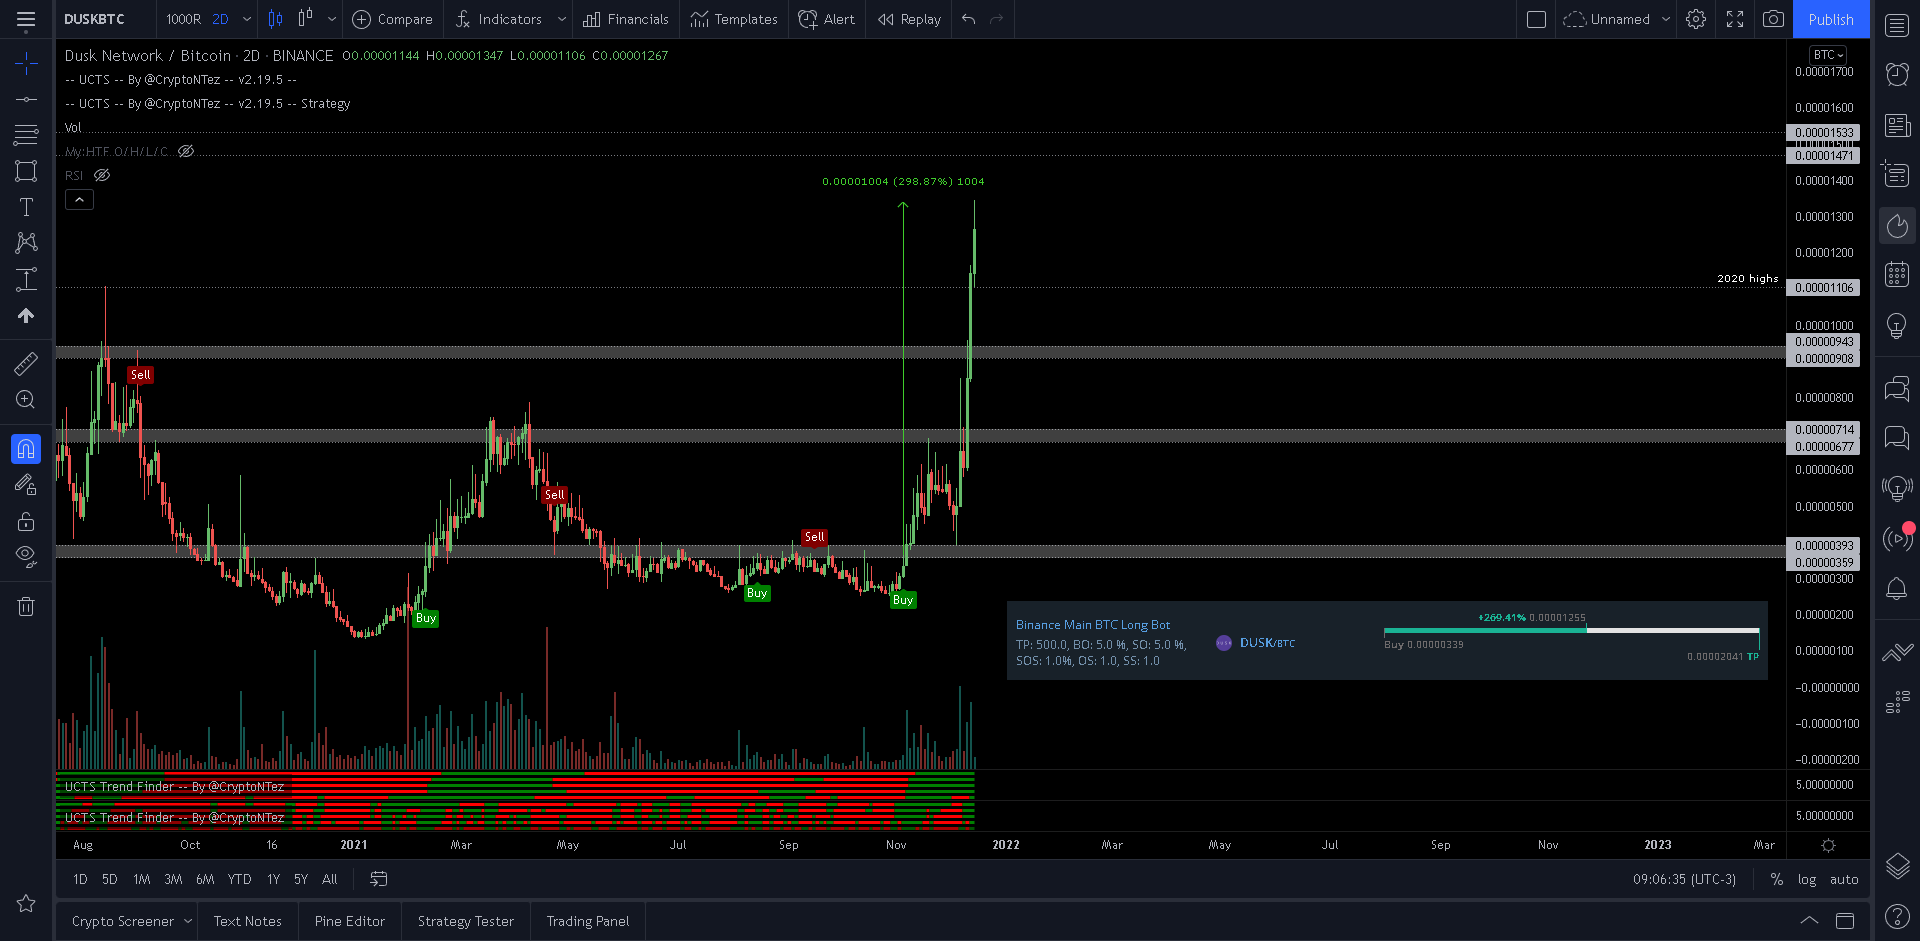
Cryptocurrency trader @CryptoNTez tweeted a DUSK/BTC chart which shows an increase of 300% since the beginning of Nov.
The DUSK/BTC chart paints a similarly bullish picture.
The token broke out from a descending resistance line and validated it as support on Dec 6 (green icon). It has been moving upwards at an accelerated rate since.
The next closest resistance area is at 2100 satoshis, created by the Aug 2019 highs.