

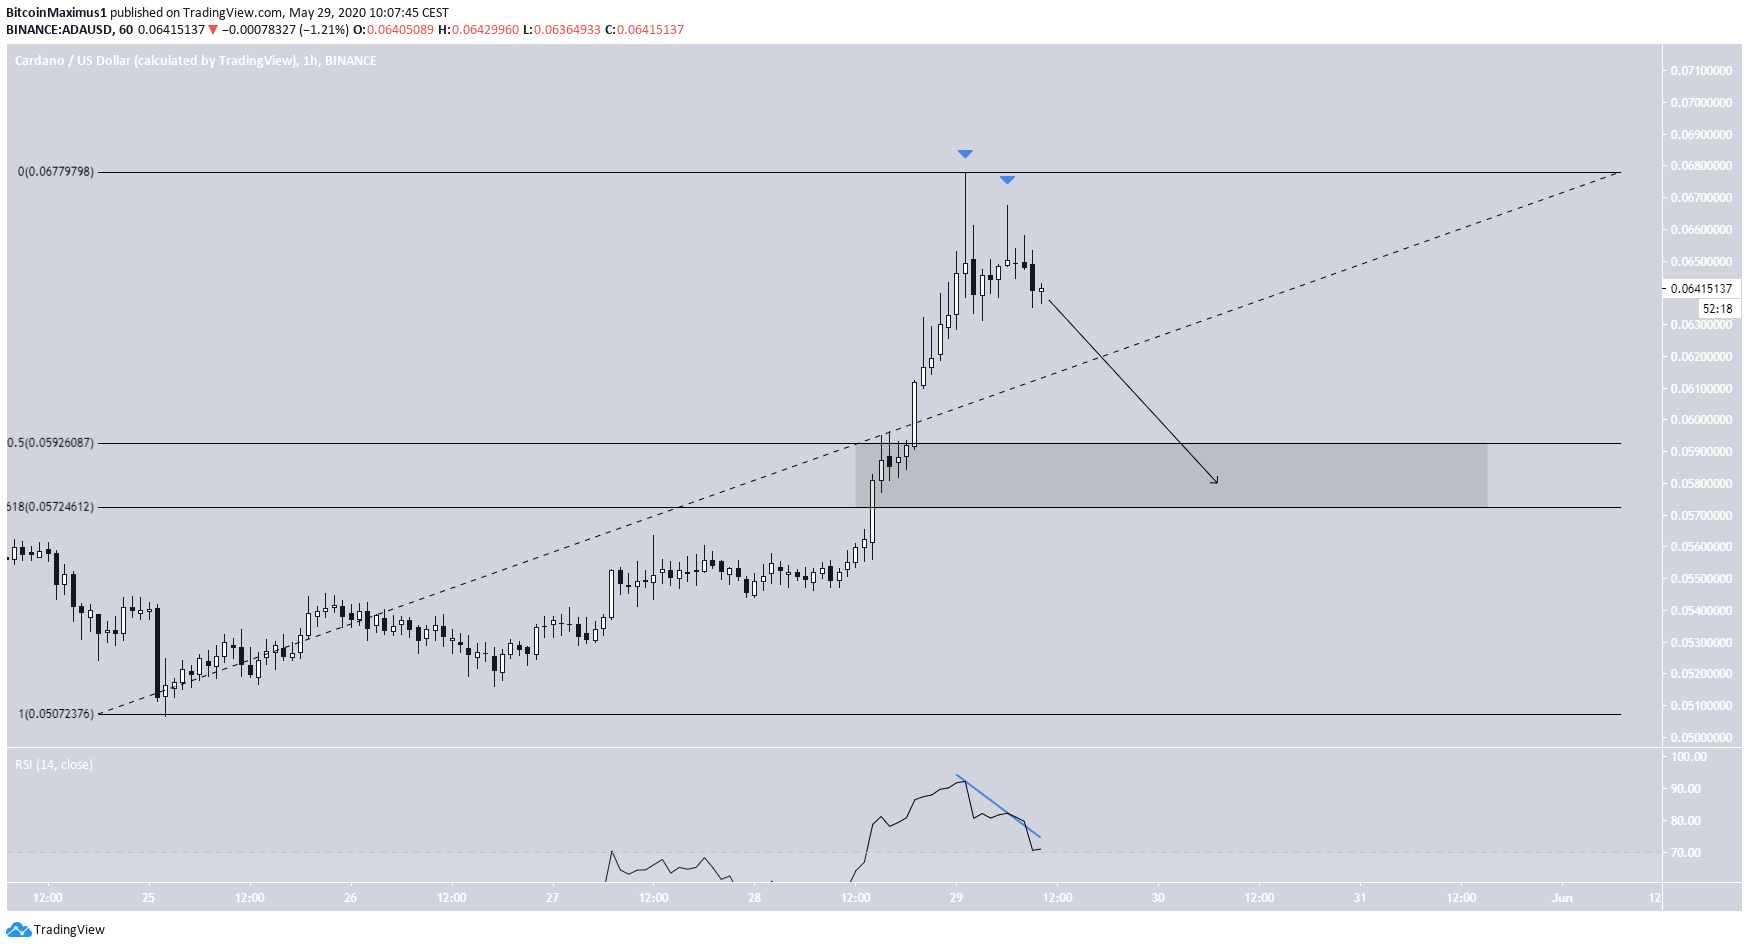
On May 28, the Cardano (ADA) price broke out from an important resistance area and had at one point increased by 25% in the day. However, the price has begun to show short-term signs of weakness.
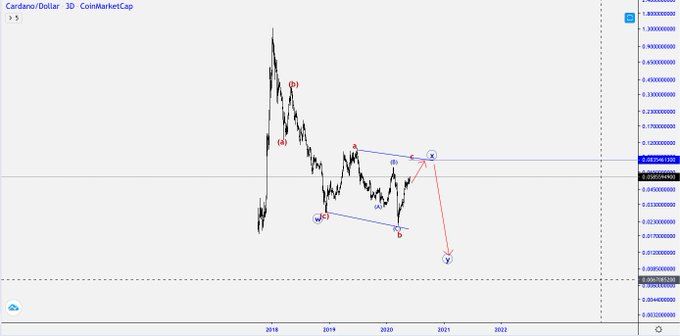
Despite the breakout, it is not yet clear if ADA is bullish in the long-term. Cryptocurrency trader @TheEWGuy stated that the ADA price will likely make another upward move before dropping sharply.
Cardano Long-Term Ascending Support Line
The ADA price has been following an ascending support line since the March 13 bottom. The price validated this line for the final time on May 10 and has been increasing at an accelerated rate since. On May 28, the price broke out above the $0.056 resistance area, which is likely to act as support from now on. The next closest resistance level is found at $0.071, and the price is currently trading between these two levels. As for technical indicators, the 50 and 200-day moving averages (MA) have made a bullish cross and the price is trading above both. As long as the price is trading above the ascending support line and these MAs, its price movement is considered bullish. If this scenario stays true, the price is expected to eventually make an attempt at breaking out above the $0.072 resistance.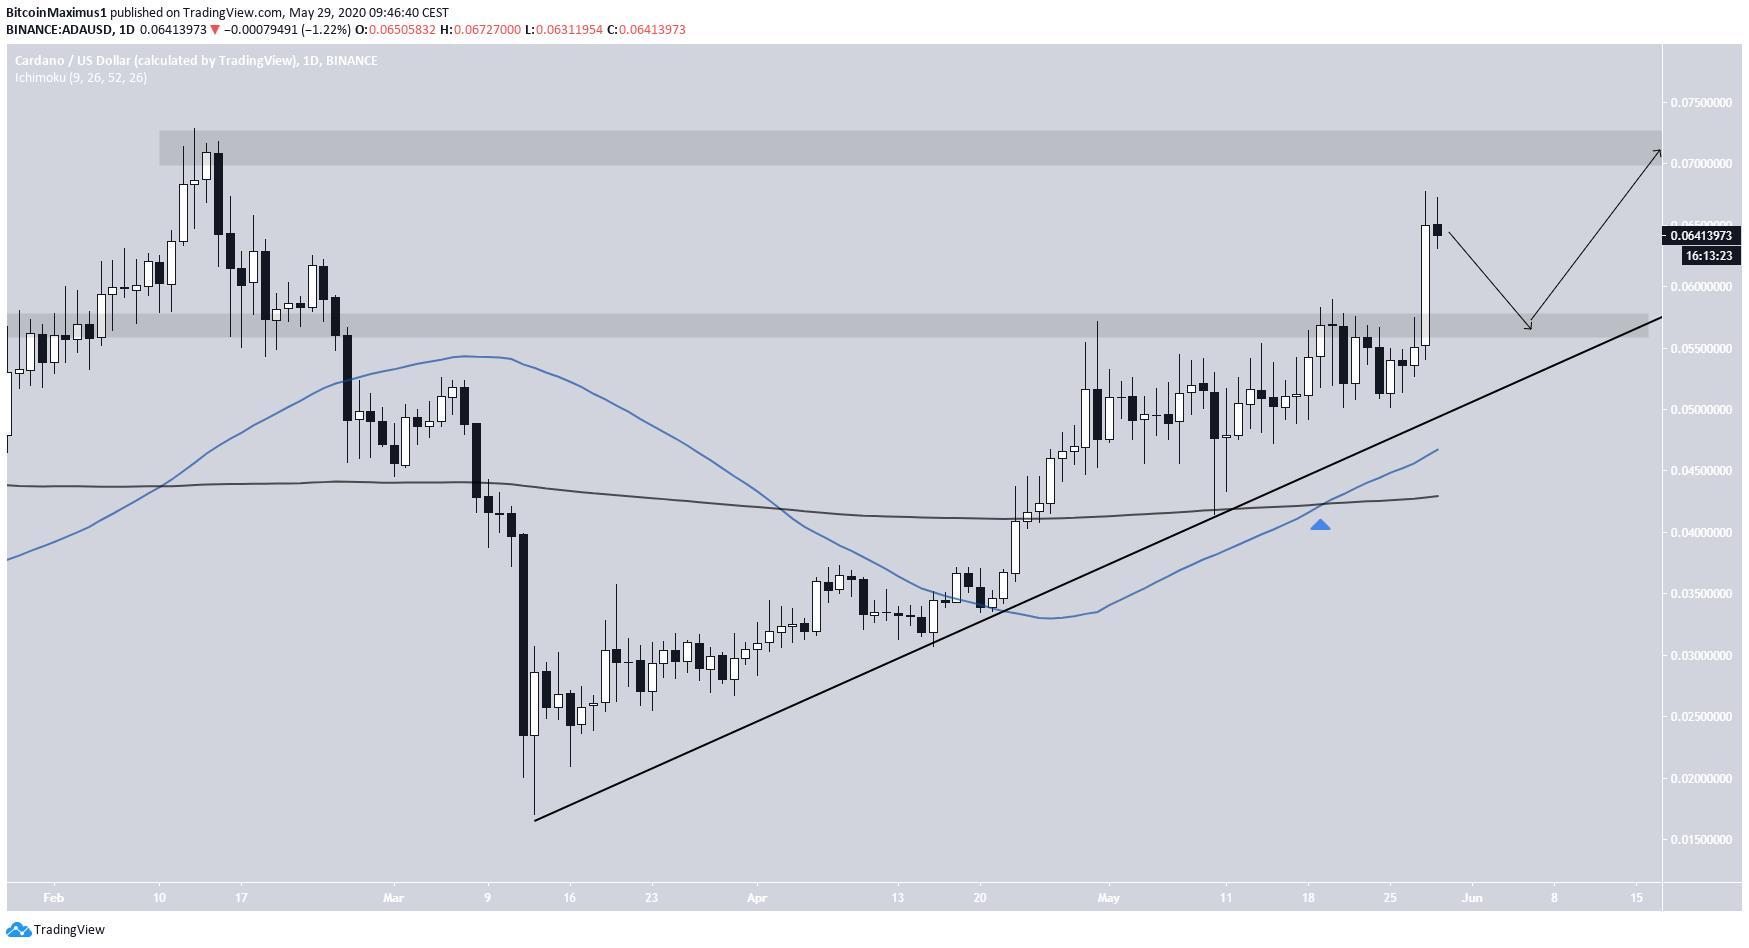
ADA/BTC
Similarly, ADA/BTC is following an ascending support line, having last touched it on May 18. At the time of writing, the price was trading inside the 690 satoshi resistance area. Relative to the price in February, the price has created a double-top. Furthermore, the RSI has also generated bearish divergence, albeit on a shorter time-frame than that of the double-top. This makes it likely that the price returns to validate the ascending support line once more, before making another attempt at breaking out, possibly creating an ascending triangle.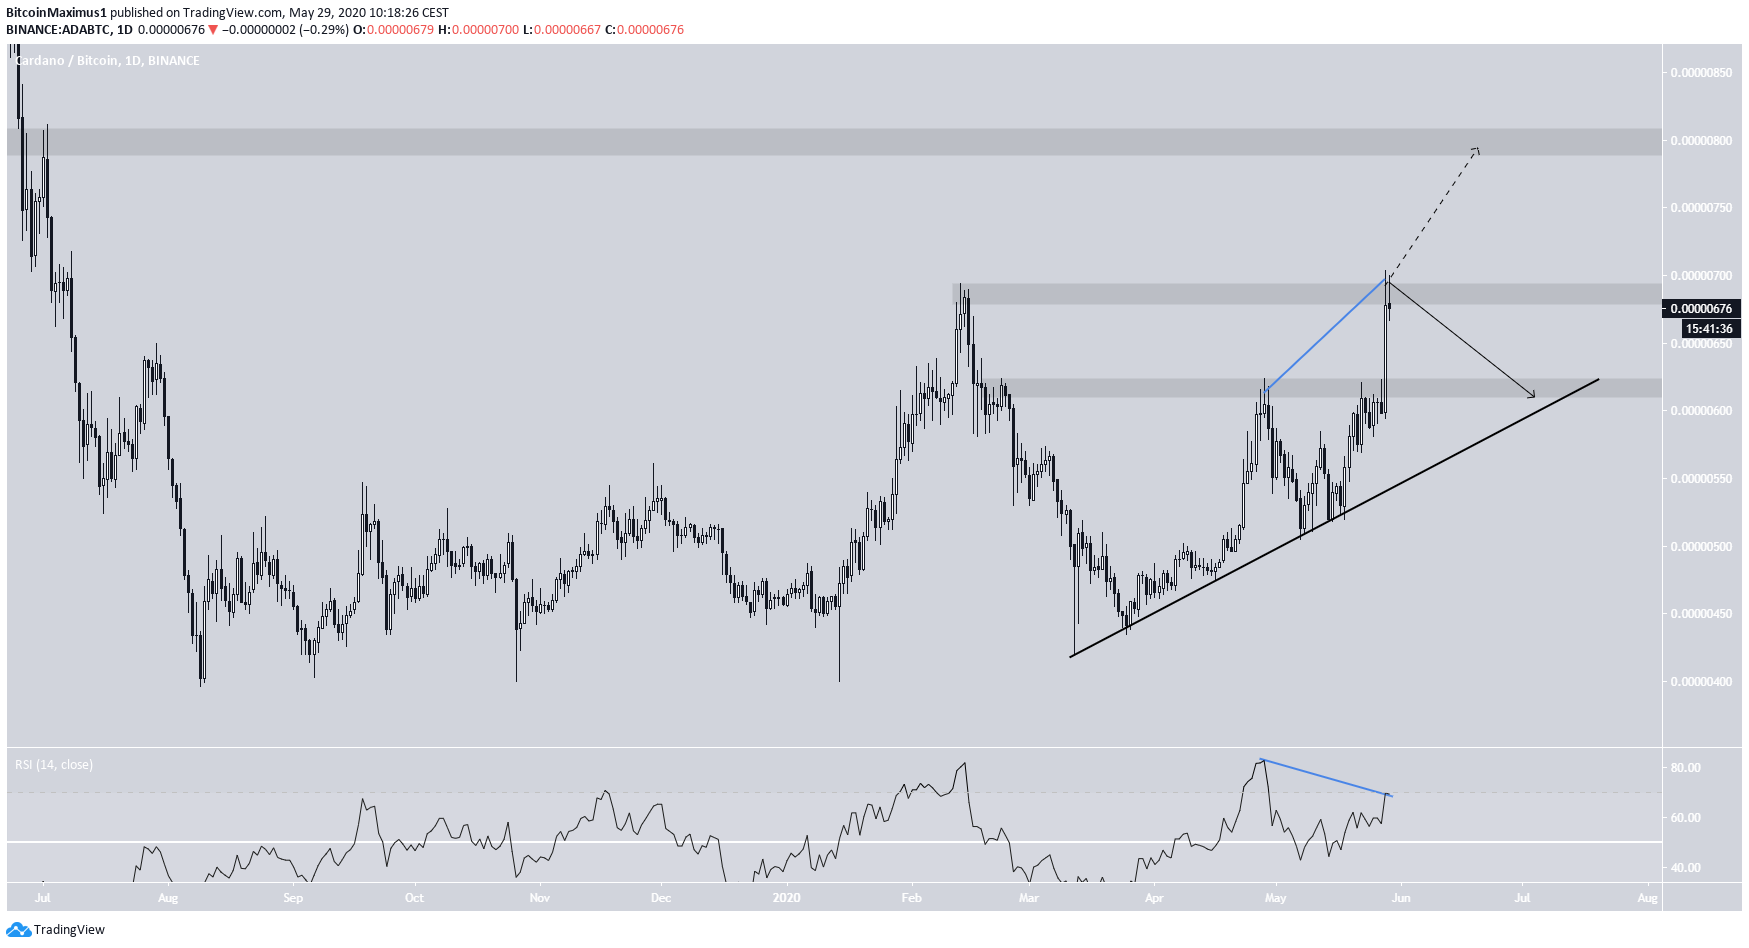
Top crypto platforms in the US
Disclaimer
In line with the Trust Project guidelines, this price analysis article is for informational purposes only and should not be considered financial or investment advice. BeInCrypto is committed to accurate, unbiased reporting, but market conditions are subject to change without notice. Always conduct your own research and consult with a professional before making any financial decisions. Please note that our Terms and Conditions, Privacy Policy, and Disclaimers have been updated.

Valdrin Tahiri
Valdrin discovered cryptocurrencies while he was getting his MSc in Financial Markets from the Barcelona School of Economics. Shortly after graduating, he began writing for several different cryptocurrency related websites as a freelancer before eventually taking on the role of BeInCrypto's Senior Analyst.
(I do not have a discord and will not contact you first there. Beware of scammers)
READ FULL BIO
Sponsored
Sponsored