


The MATIC price has found support after its rapid decrease. In the short-term, it is likely to continue consolidating within the newly created trading range.
On December 10, MATIC was the subject of a very rapid price decrease, which caused the price to lose 70% of its value in a matter of hours. This created a massive bearish engulfing candlestick, completely dwarfing the preceding price increase. However, the price has found support above its previous ascending support line and has begun to show some signs of strength.
Full-time trader @PostyXBT posted the weekly chart for MATIC, asking our thoughts about how the chart looks.
What do we make of the $MATIC weekly chart right now? pic.twitter.com/ocq8NcPSJK
— Posty (@PostyXBT) December 16, 2019
Let’s dive deep into the MATIC price movement and see what the future has in store.
MATIC Ascending Channel
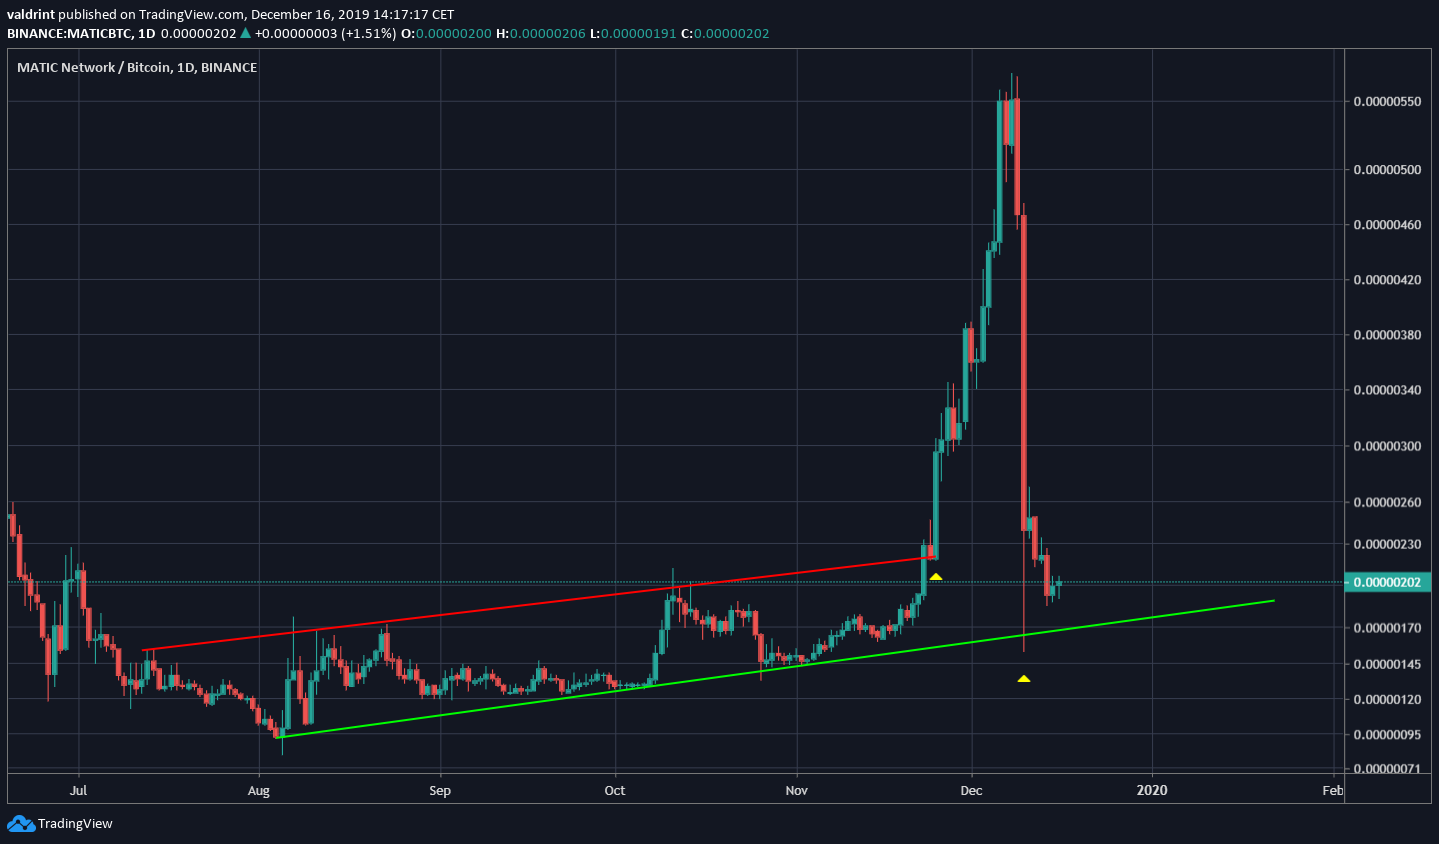
Before initiating its rapid increase, the MATIC price had been trading inside an ascending channel since August. The November 25 breakout caused the price to move outside of the resistance line of the channel.
Afterward, when the price began its downward move, it did not react with the resistance line but returned to validate the support line in the form of a wick. Currently, it is trading slightly above this line.
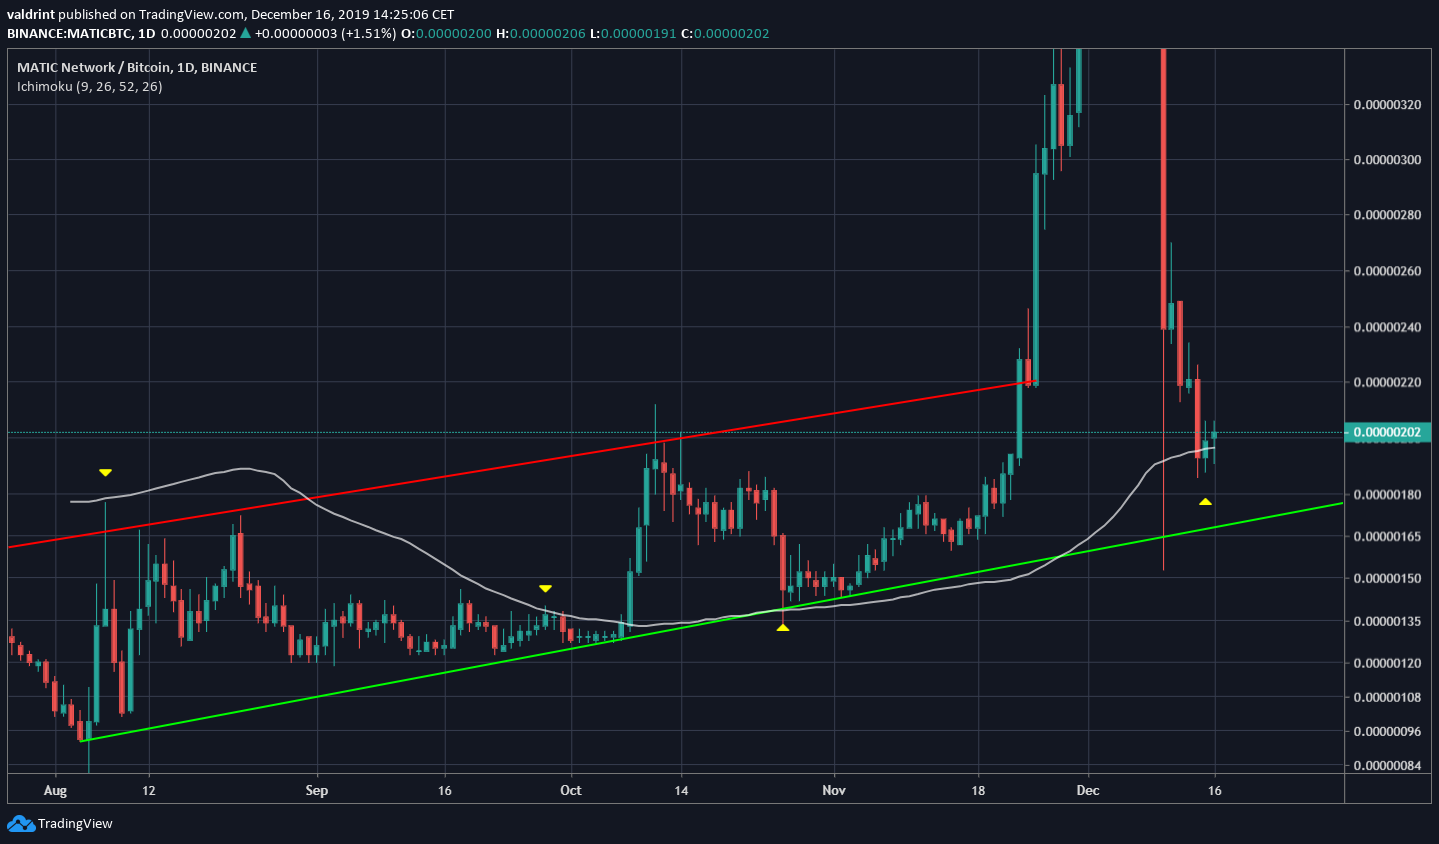
There is a relationship with the 100-day moving average (MA) that is worth keeping an eye on.
This MA first acted as resistance in August and caused the price to decrease. The same thing occurred on September 30. After the price moved above the MA, it accelerated its rate of increase and has been trading above it since.
Even after the rapid price decrease of December 10, the price found support above this MA, where it is currently trading. Therefore, as long as the price is trading above the 100-day MA, we can assume it’s outlook remains bullish.
Trading Range
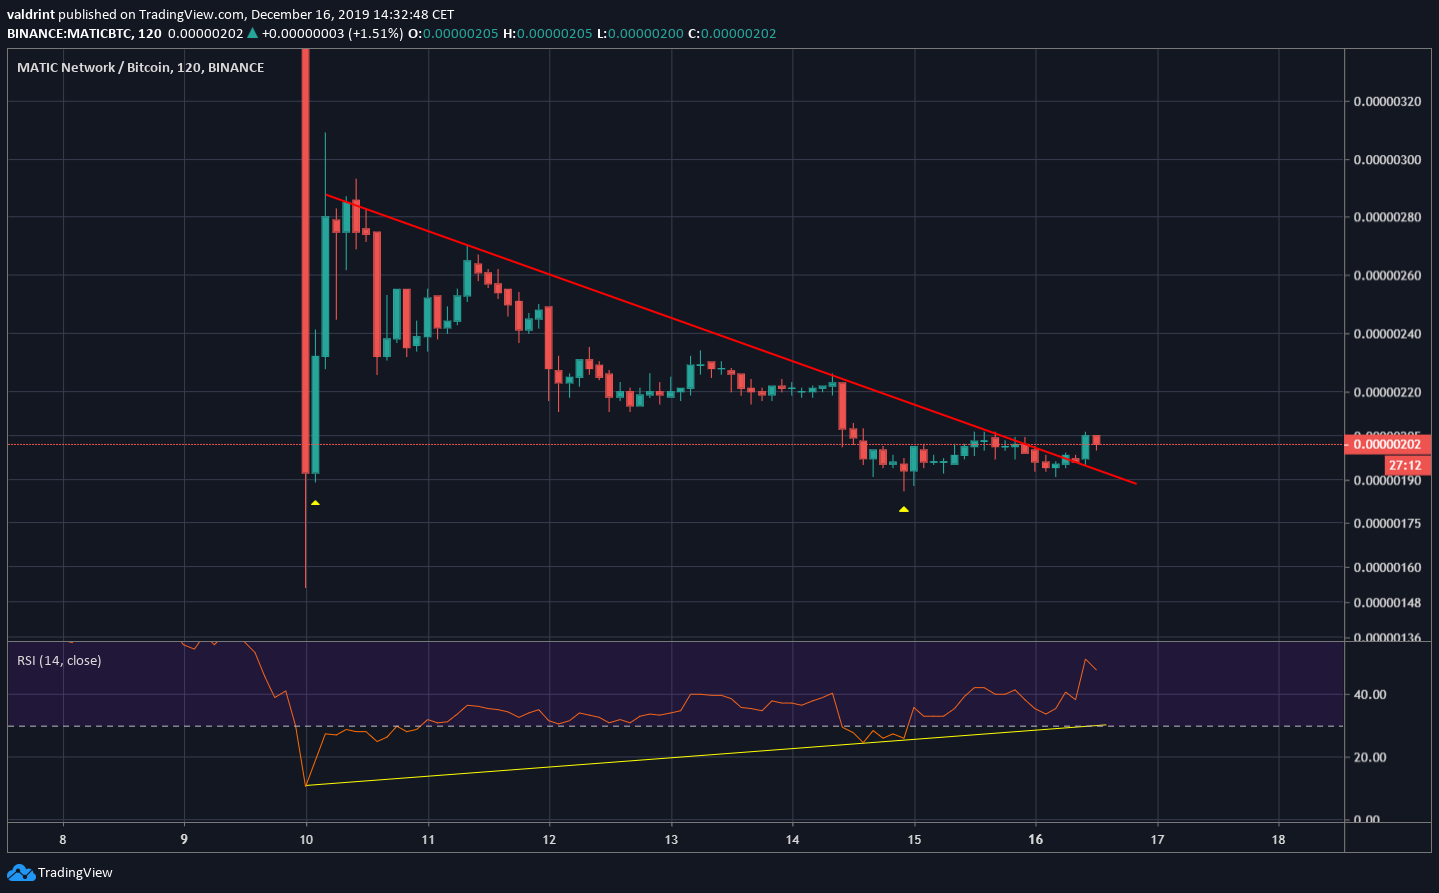
In the short-term, MATIC has been following a descending resistance line since the rapid downward movement on December 10. The price made a double bottom at 190 satoshis, which was combined with a bullish divergence in the RSI and lower wicks which signify buying pressure.
At the time of writing, the price had just created a bullish candle which seemingly caused the price to break out above the descending resistance line.
In the near future, we would expect MATIC to trade in a range between 190 and 290 satoshis. The period of rapid significant movement is likely over for now and a period of consolidation should begin.
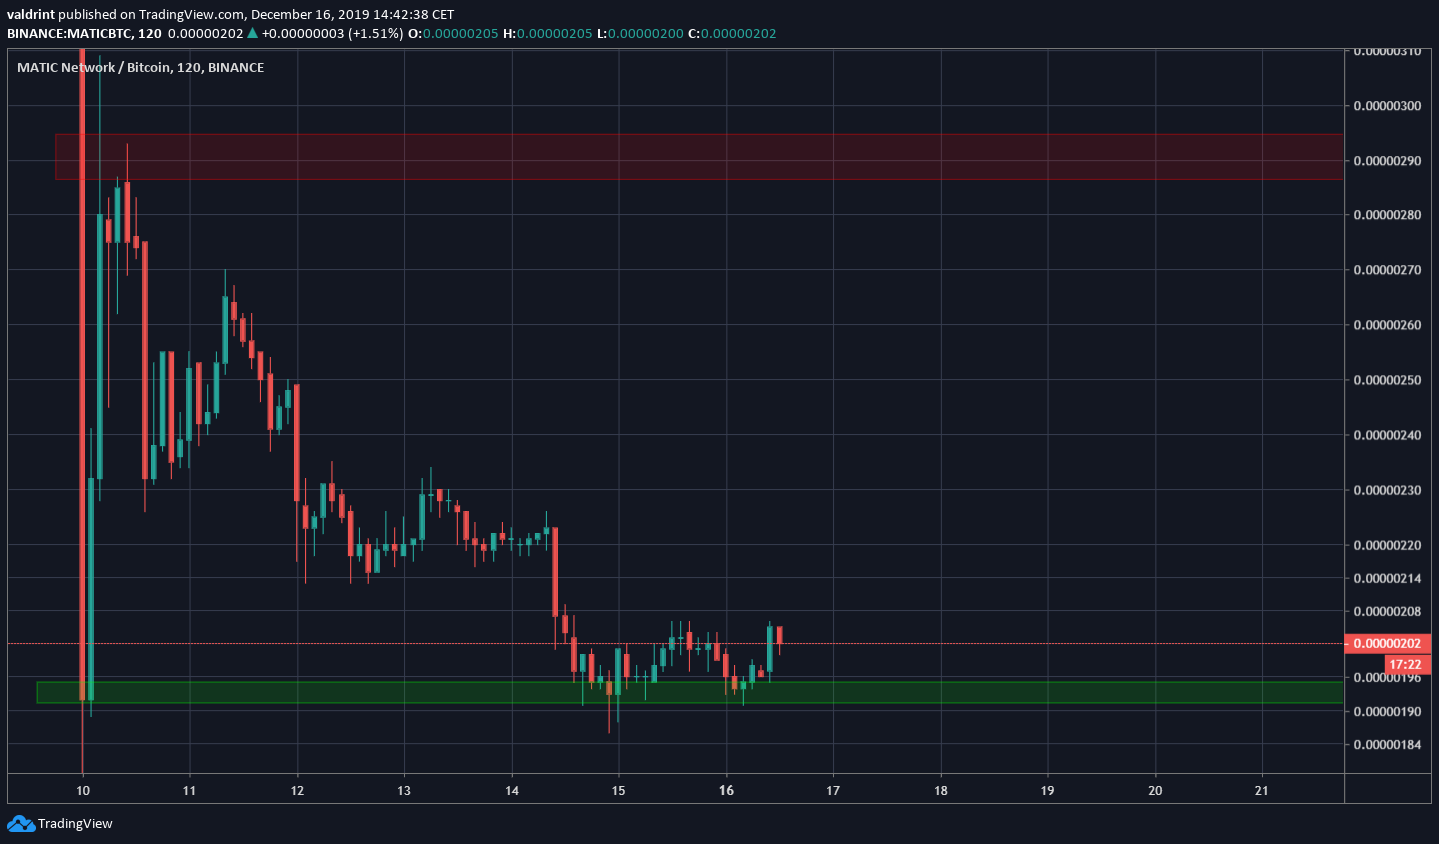
To conclude, the MATIC is likely done with its corrective period characterized by a rapid price decrease. In the future, we expect it to trade in a range between 190 and 290 satoshis.


