Bitcoin Gold (BTG), Bitcoin SV (BSV) and Bitcoin Cash (BCH) have all had tough times so far in 2020. Each has fallen below important support areas.
However, it looks like BTG is currently in the process of initiating a reversal, while BSV and BCH are still lagging behind.
Bitcoin Gold (BTG)
The BTG price has been decreasing since reaching a high on Jan 14, 2020. With that said, it has recently shown signs of life, especially on June 28, when it increased by 25%, as noted by cryptocurrency enthusiast @ZackVoell.
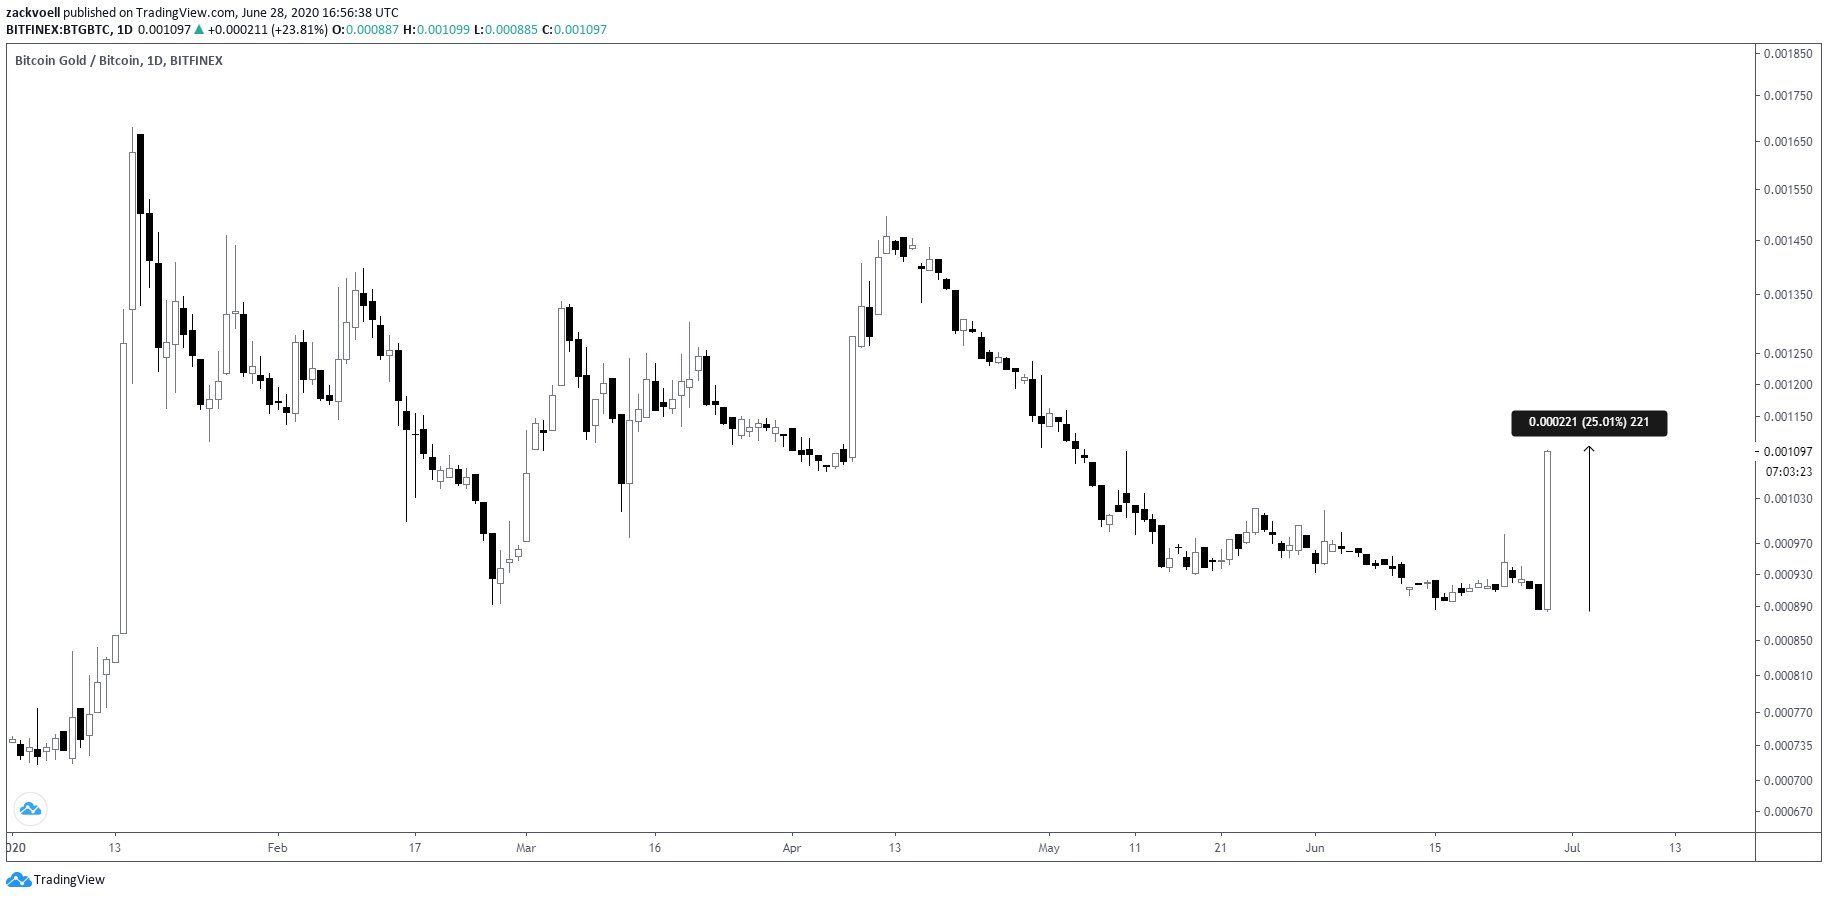
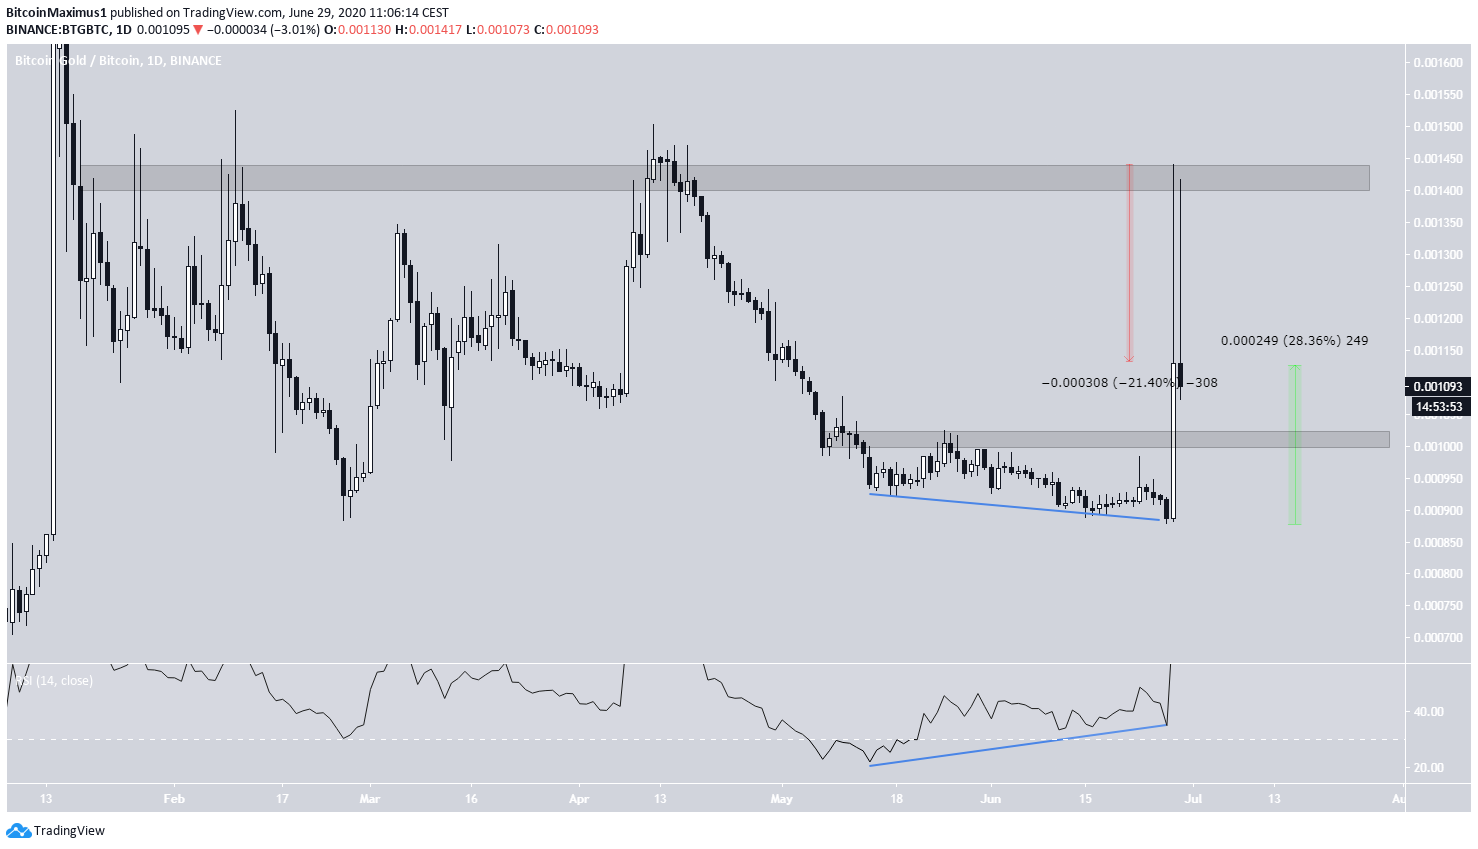
Since then, however, the price has created an enormous long upper-wick and decreased considerably. While the body had a length of 28%, the upper wick measured 21%.
Today, the price made another attempt at moving upwards, but was rejected by the ₿0.0014 area once more and created another long upper-wick. This is a sign of selling pressure that suggests the price will likely move down.
If so, it could decrease towards the support area at ₿0.001. However, this entire move was preceded by very significant bullish divergence in the daily RSI, a normal sign of a trend reversal. Therefore, as long as the aforementioned support area holds, BTG would be expected to continue moving upwards.
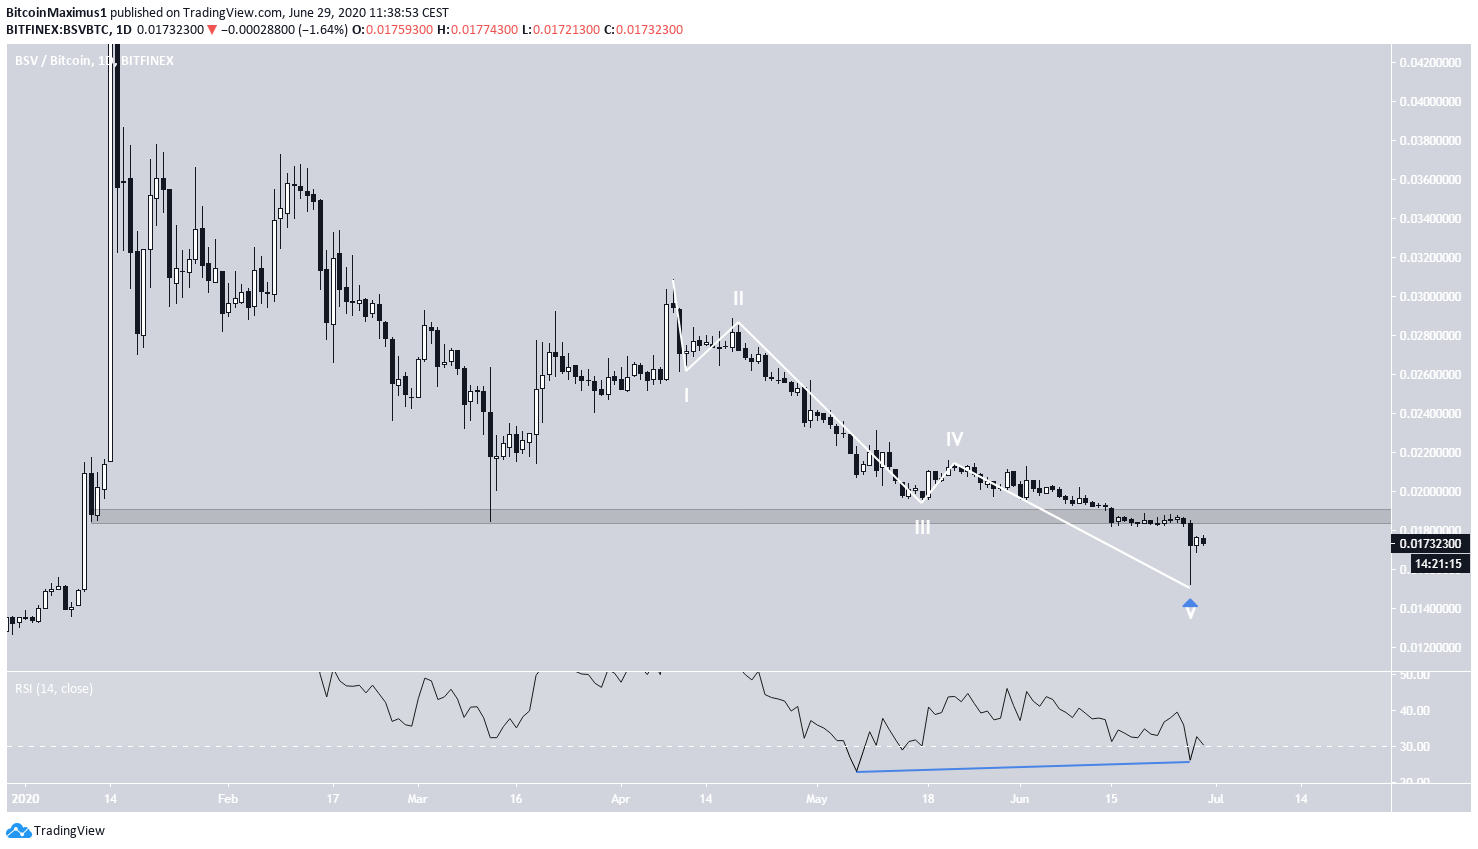
Bitcoin SV (BSV)
BSV has been decreasing since April 9, 2020. The movement since then closely resembles a five-wave Elliott formation, which ended with the long lower-wick of June 27. If correct, the price would be expected to increase from here. This is supported by the considerable bullish divergence in the daily time-frame of the RSI.
However, the price has also fallen below the ₿0.0185 support area, which stood for almost the entirety of 2020. Therefore, in order for the price to continue moving upwards, it has to flip this area and confirm it as support.
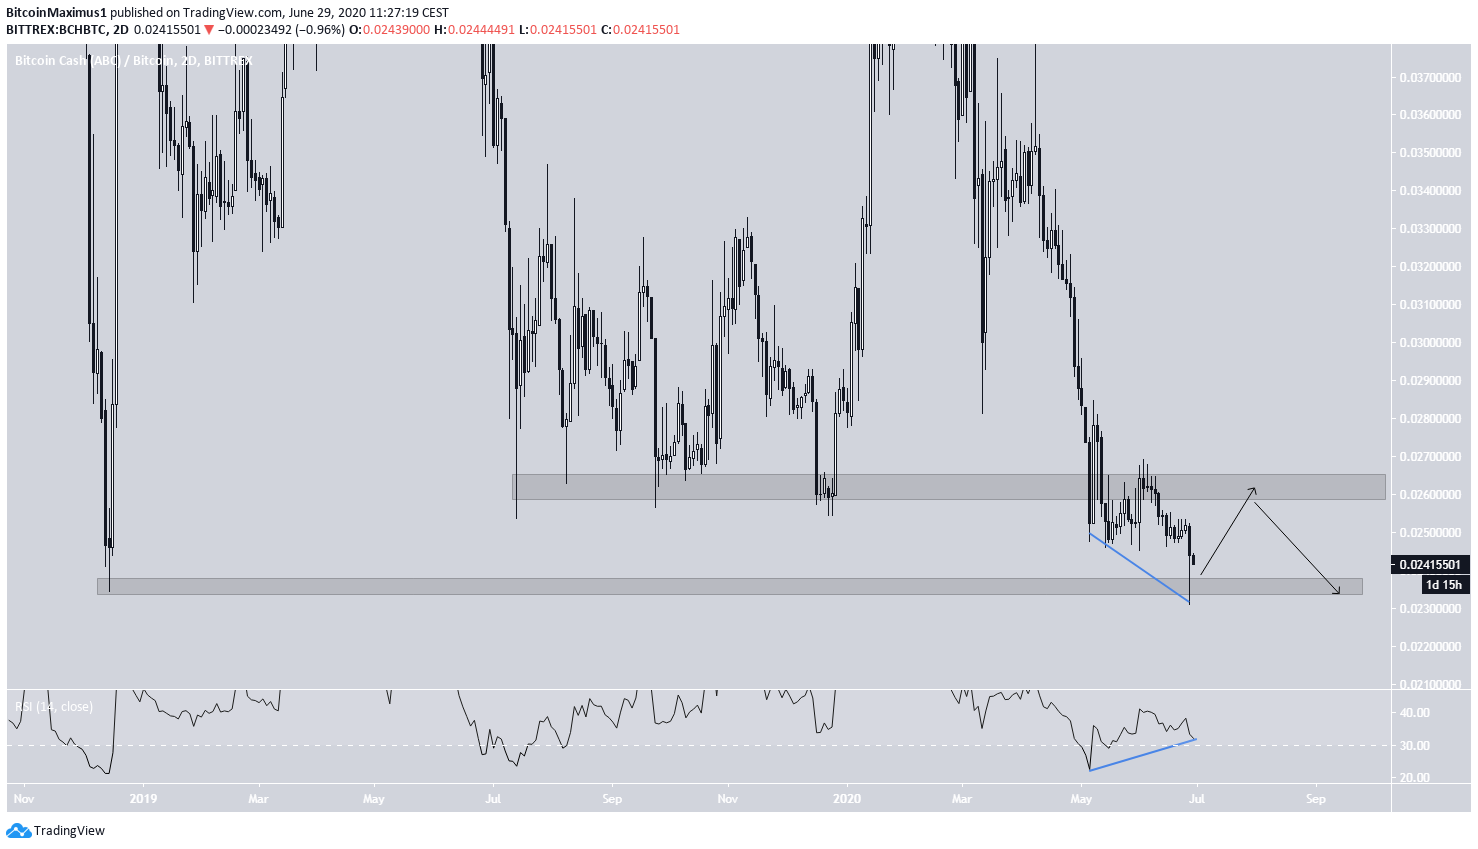
Bitcoin Cash (BCH)
Since July 2019, the BCH price had been trading above the ₿0.0263 support area, initiating numerous bounces above it. However, the price fell below this area on May 20, validated it as resistance, and has been decreasing since.
On June 27, it briefly dropped below the ₿0.0235 area, reaching an all-time low, but created a long lower-wick and moving back up.
Due to the considerable bullish divergence and long lower-wick, an upward move towards the ₿0.026 area is expected. However, we cannot state with certainty whether the price will break out above this level.