
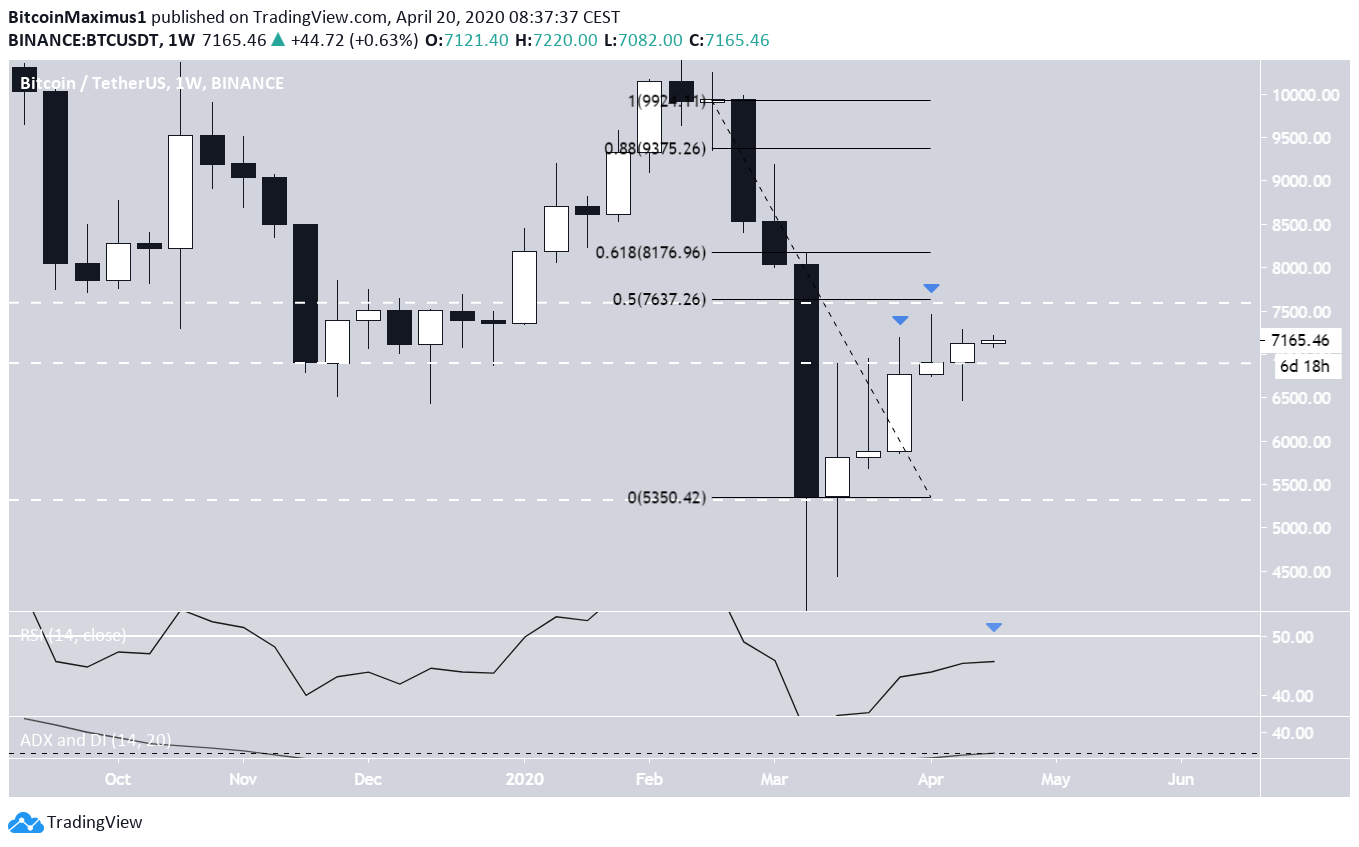
During the week of April 13-20, the Bitcoin (BTC) price reached a weekly close of $7120. This was the highest weekly close since the rapid decrease on March 12.
Weekly Outlook
In the weekly time-frame, the Bitcoin price has finally reached a close above the $6900 area — something it had been unsuccessfully trying to do for the past four weeks. However, it still has not cleared the entire wick resistance from these weeks.
The next closest resistance level is found at $7600. At the moment, the price was trading inside a strong resistance area, found between $6900-$7600.
There is a pronounced lack of resistance/support above/below these areas. Therefore, whenever the price leaves this area, whether that is in the form of a breakout or a breakdown, it could trigger a rapid movement in either direction. As long as the price is trading inside this area, both possibilities remain.
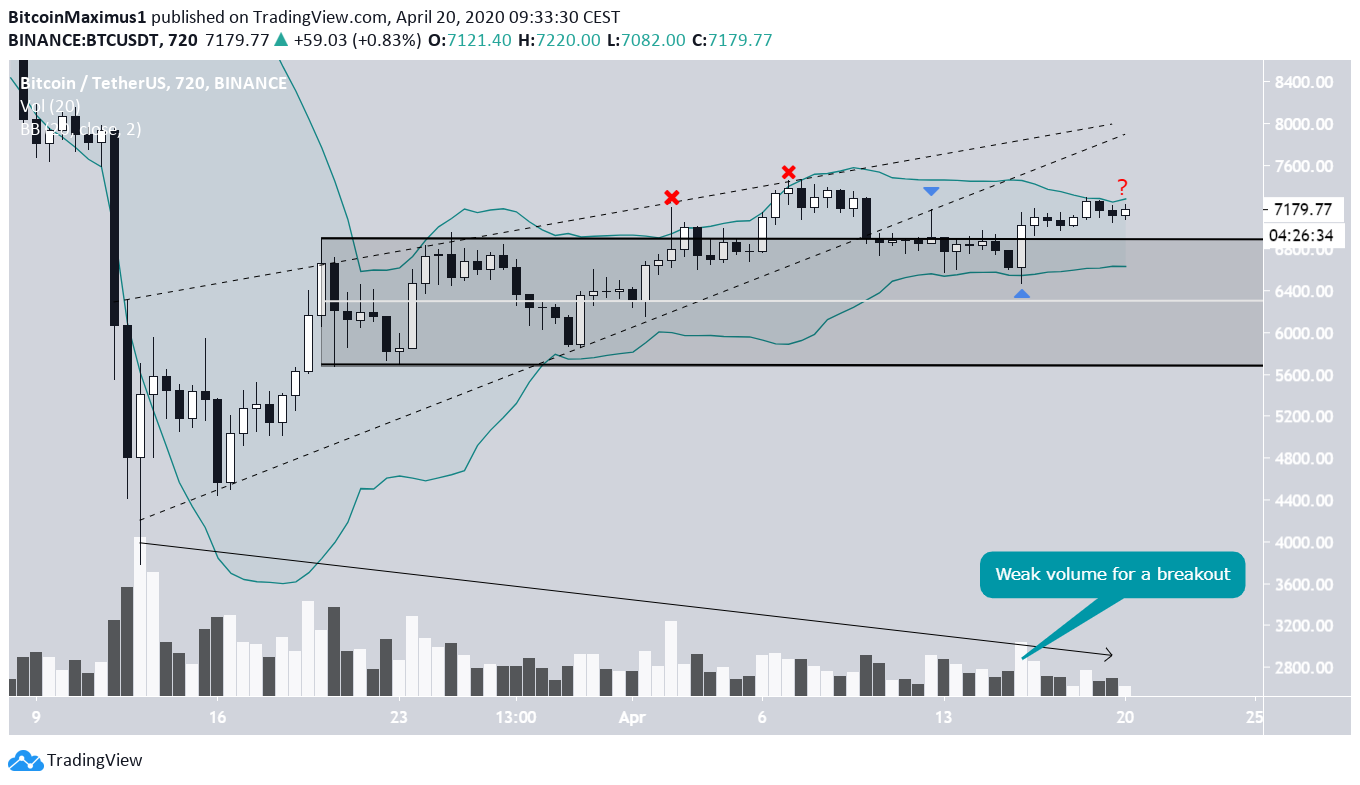
Trading Range
A lower time-frame chart shows that the Bitcoin price has already broken down from an ascending wedge and validated it as resistance afterward. In addition, it gives us a trading range, between $5700-$6900.
Once the price broke down from the wedge, it re-entered the range, implying that it is heading towards the range low. However, on April 16, it reversed the trend and created a bullish engulfing candlestick, breaking out above the resistance area.
One indicator which gives a slightly bearish scenario is the Bollinger Band. The price has twice moved above the upper band and reversed afterward. At the time of writing, it was in the process of doing so once more, a movement that could indicate the price will fall back inside the range once more.
Furthermore, the volume has been consistently decreasing since the beginning of the wedge and was not significant enough during the April 16 breakout.
Short-Term Movement
In the short-term, the price is trading inside an ascending channel and has flipped the $7120 area as support. Combining this with the longer-term analysis, the most likely scenario seems to be continued trading inside this channel followed by an eventual breakdown.
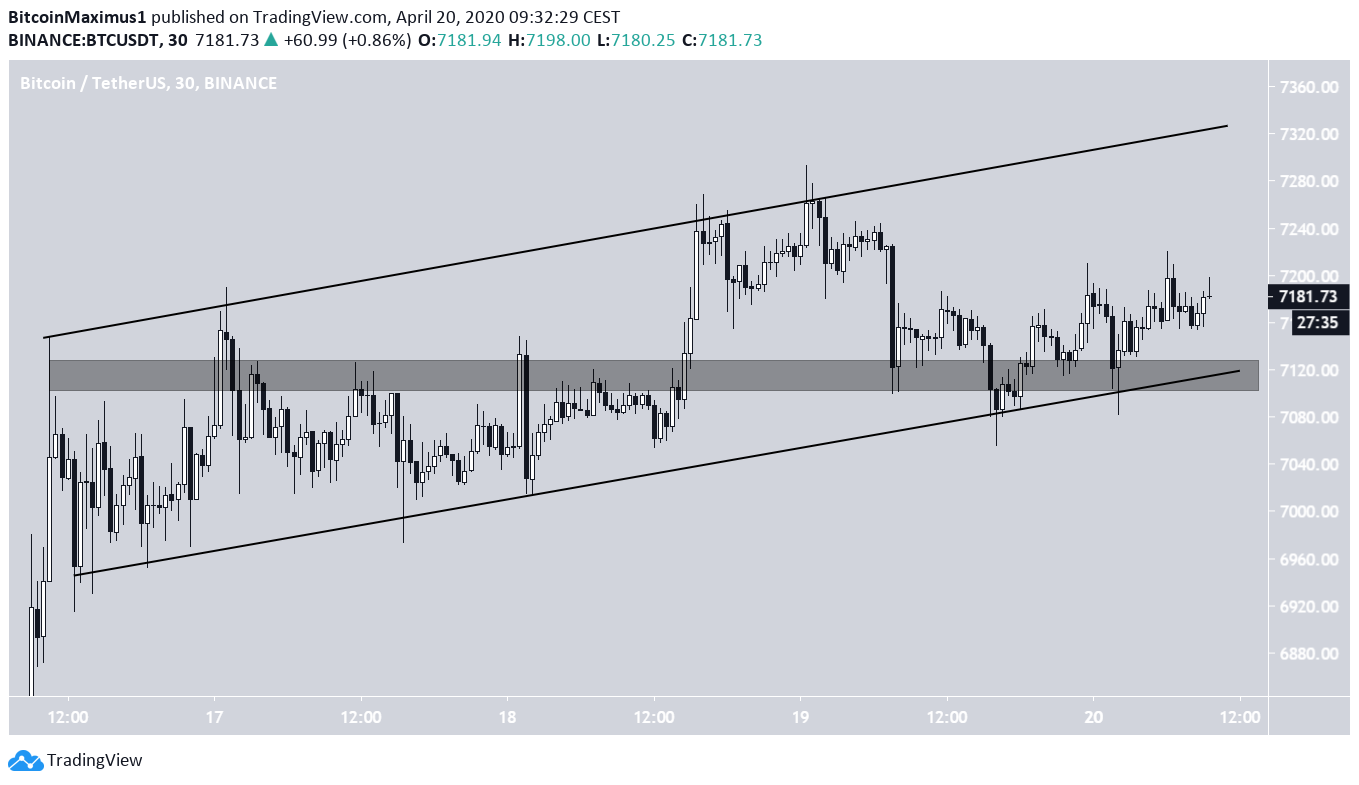
To conclude, the Bitcoin price has reached a bullish close above an important resistance level, but it has yet to clear the entirety of its overhead resistance. The previous breakdown from its pattern and lack of volume in the reversal makes it more likely that the price will eventually get rejected and initiate a downward move.
For those interested in BeInCrypto’s previous Bitcoin analysis, click here.
