


Last year, Bitcoin whales relying on technical analysis added a new weapon to their trading arsenal. This weapon is a chart pattern, known on social media as simply Bart. Who exactly is Bart and why is he rekt-ing inexperienced margin traders over and over again?
It all started after the big boom of 2017 when Bitcoin showed its first signs of weakness. The price collapsed and so did the liquidity on all cryptocurrency exchanges. The bull market was over.
As a result, whales and exchanges alike had to come up with a different way to make money and survive. What followed next can be seen clearly on the Bitcoin (BTC) price chart.
At first glance, it looks like a regular pump-and-dump scheme — and, to some degree, it is exactly that. Cryptocurrency critics gave the pattern a catchy name, turning it into a meme on all social media: Bart.
What Is The Bart Pattern?
The name is based on ‘The Simpsons’ character Bart Simpson.
Bart usually appears during quiet trading sessions, when nothing seems to happen in terms of price moves. He wakes the Bitcoin market up with a big spike upward or downward — a big buying or selling order.
After the spike, things return to normal and price consolidates at the new level, for a certain period of time — usually days. Since Bart is a prankster, the consolidation is just the calm before the storm and is followed by another spike, comparable to the initial one, or even bigger.
If the initial move is upward, Bart will leave the stage with a move downward. If the spike was a dump, Bart would take the profits with an even bigger pump.
Why Bart in particular? Because the so-called consolidation phase in the chart pattern resembles Bart’s head shape.
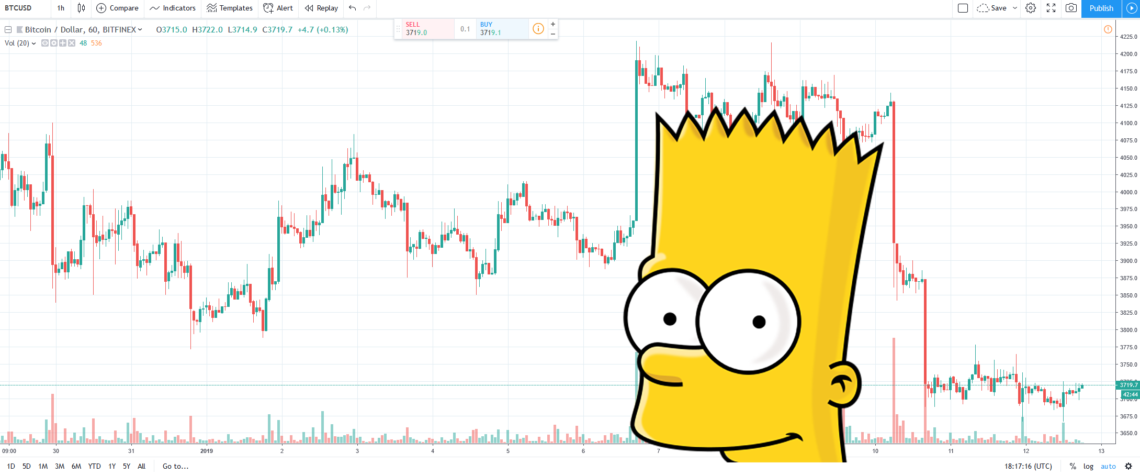
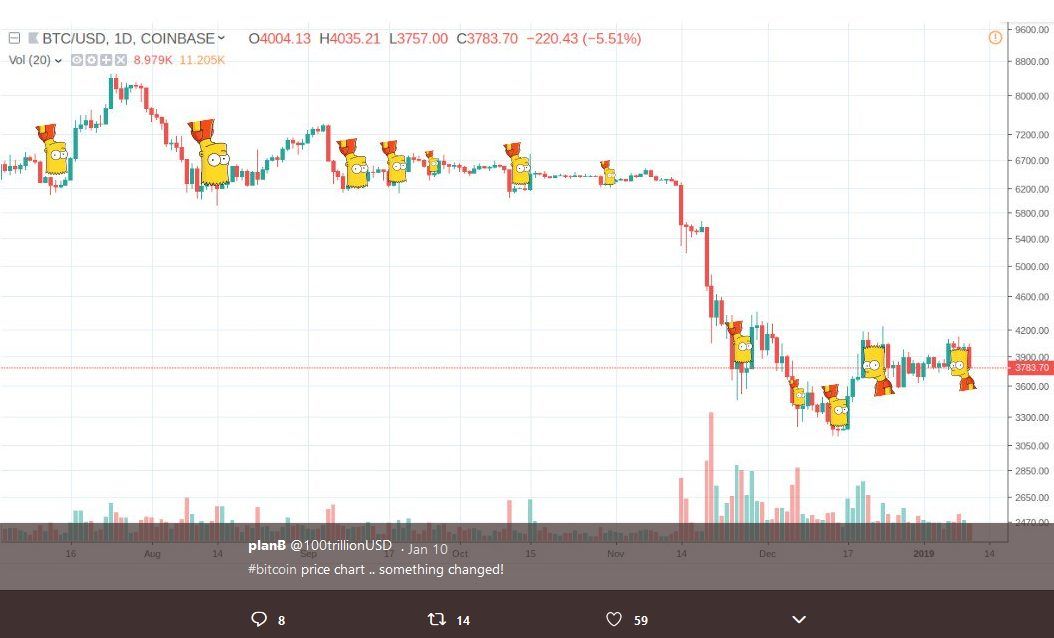
The above Bitcoin price chart is a picture perfect Bart pattern from Jan 6, 2019, to January 11 on the hourly timeline.
You can also spot Bart if you zoom out and look at a daily chart from the second semester of 2018, for example.
What Causes The Bart Pattern?
Most traders agree the pattern is a direct result of a lack of liquidity in the Bitcoin market.
After 2017 and the first quarter of 2018, when money poured into the market, big speculators cashed out and didn’t show signs of coming back in. Thus, the price crashed from five digits to low four digits, cryptocurrency pump-and-dump schemes ran rampant with some degree of success, and any whale could influence cryptocurrency prices significantly with a decent enough order.
If you also factor in trading bots taking over the market and exchanges arbitrating their order books, the picture is complete.
For what purpose though? To take advantage of inexperienced investors who trade on big margins.
The "Bart" patterns that have been a feature in Bitcoin since 2018 are a sign that the market is over-leveraged
… this makes it too easy for so-called 'whales' to counter-trade you and take your margin from you
It used to be OKCoin, now its BitMex traders— Alistair Milne (@alistairmilne) January 11, 2019
Simply put, when enough margin traders go short — meaning they think Bitcoin will further depreciate — the ‘whales’ enter the market with a big buy order and liquidate the short margins.
After the big spike upward, the margin traders will think the move is just the beginning of a much bigger pump to new short-term highs. Thus, they will go long and wait for the Bitcoin price to rise some more. When there are enough such orders, ‘whales’ will show up and dump their bitcoins.
The price will collapse and, once again, the margin traders will get rekt.
Bot Trading Or Exchange Spoofing?
Who are these ‘whales,’ though?
Some say they are actual speculators with large sums of money who got tired of the bot-filled stock market and decided to give Bitcoin a try.
Others point the finger at Wall Street. They believe Wall Street never fully cashed out of the Bitcoin market and created an army of trading bots or algorithms that profit from newbies’ mistakes — time and time again.
There is also another camp that blames the cryptocurrency exchanges. These exchanges paint the tape to create the appearance of substantial trading activity and use different market manipulation techniques against their customers.
One such technique is spoofing or phantom bids. The exchange places a buy order only to cancel it second/minutes later, or just before a trader wants to actually fill the order and sell his bitcoins. As soon as the order is placed, the price jumps, giving a false sense there is actually strong demand for Bitcoin.
Which one is it, at this point in time, is anyone’s guess. One fact is certain, however: trade Bitcoin on a margin and you will most likely get rekt.
What do you think? Who is actually manipulating the market by creating the infamous Bart pattern, over and over again? Please share your opinions in the comment below!


