


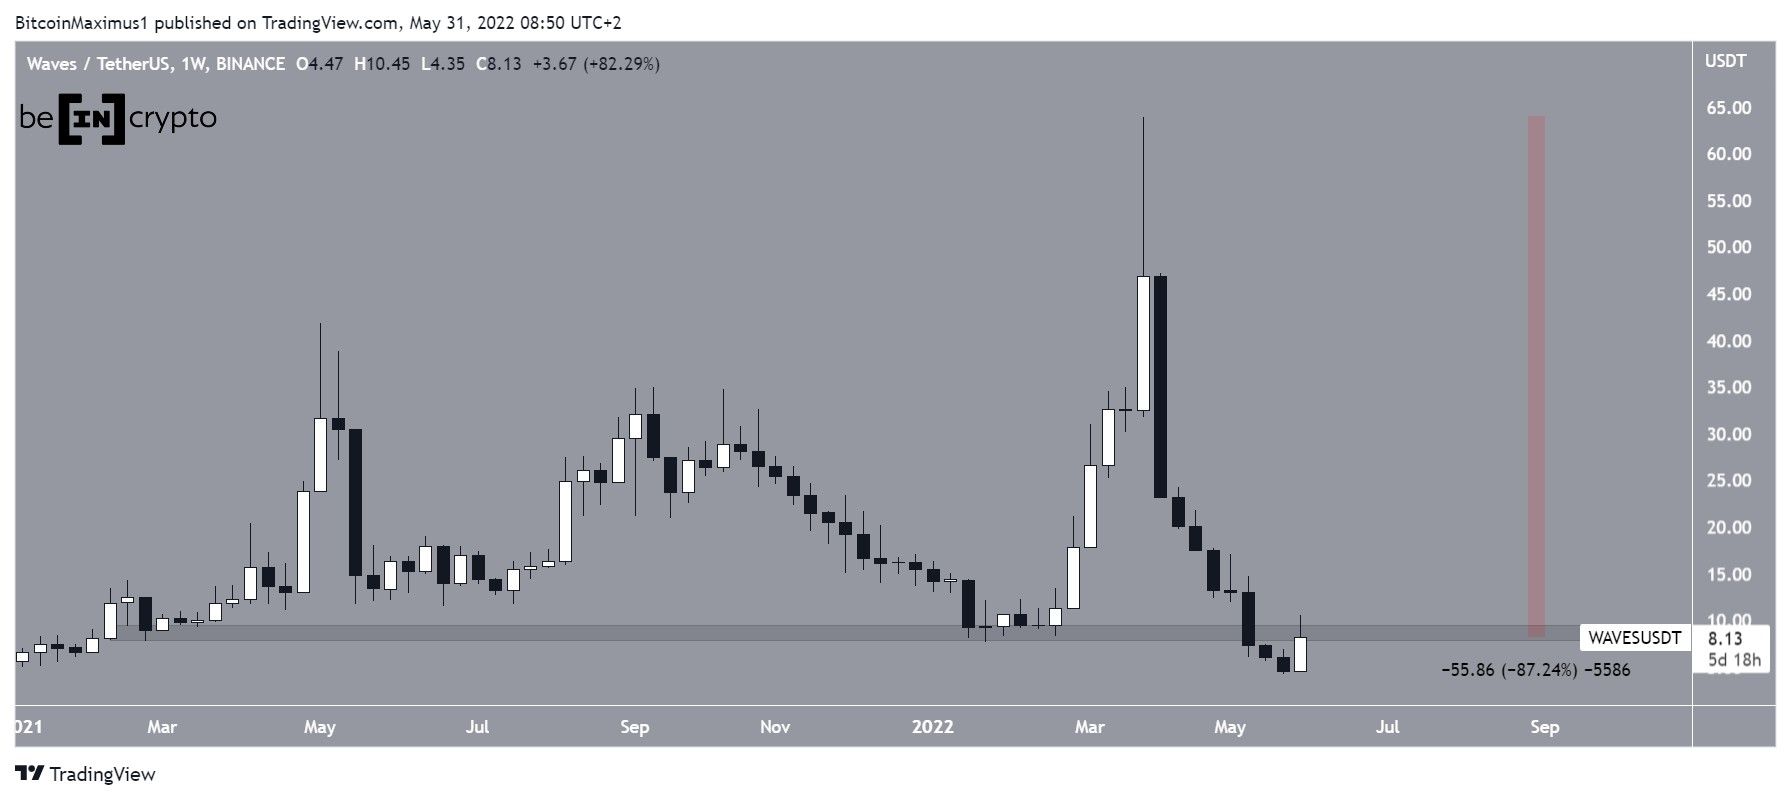
While Waves (WAVES) has broken out from a descending resistance line, it has yet to reclaim a crucial horizontal resistance level at $8.60.
WAVES has been falling since reaching an all-time high price of $63.88 on March 31. The downward movement has so far led to a low of $4.13 on May 28. This decrease also caused a breakdown from the $8.60 horizontal support area.
Previously, the area had acted as support since March 2021. Due to the fact that it was such a long-time support level, whether the price validates it as resistance or reclaims it will likely determine the direction of the future trend. The latter would mean that the breakdown was only a deviation and would be expected to lead to an upward movement. Conversely, the former would lead to lower prices.
Measuring from the all-time high, the price has fallen by 87%.
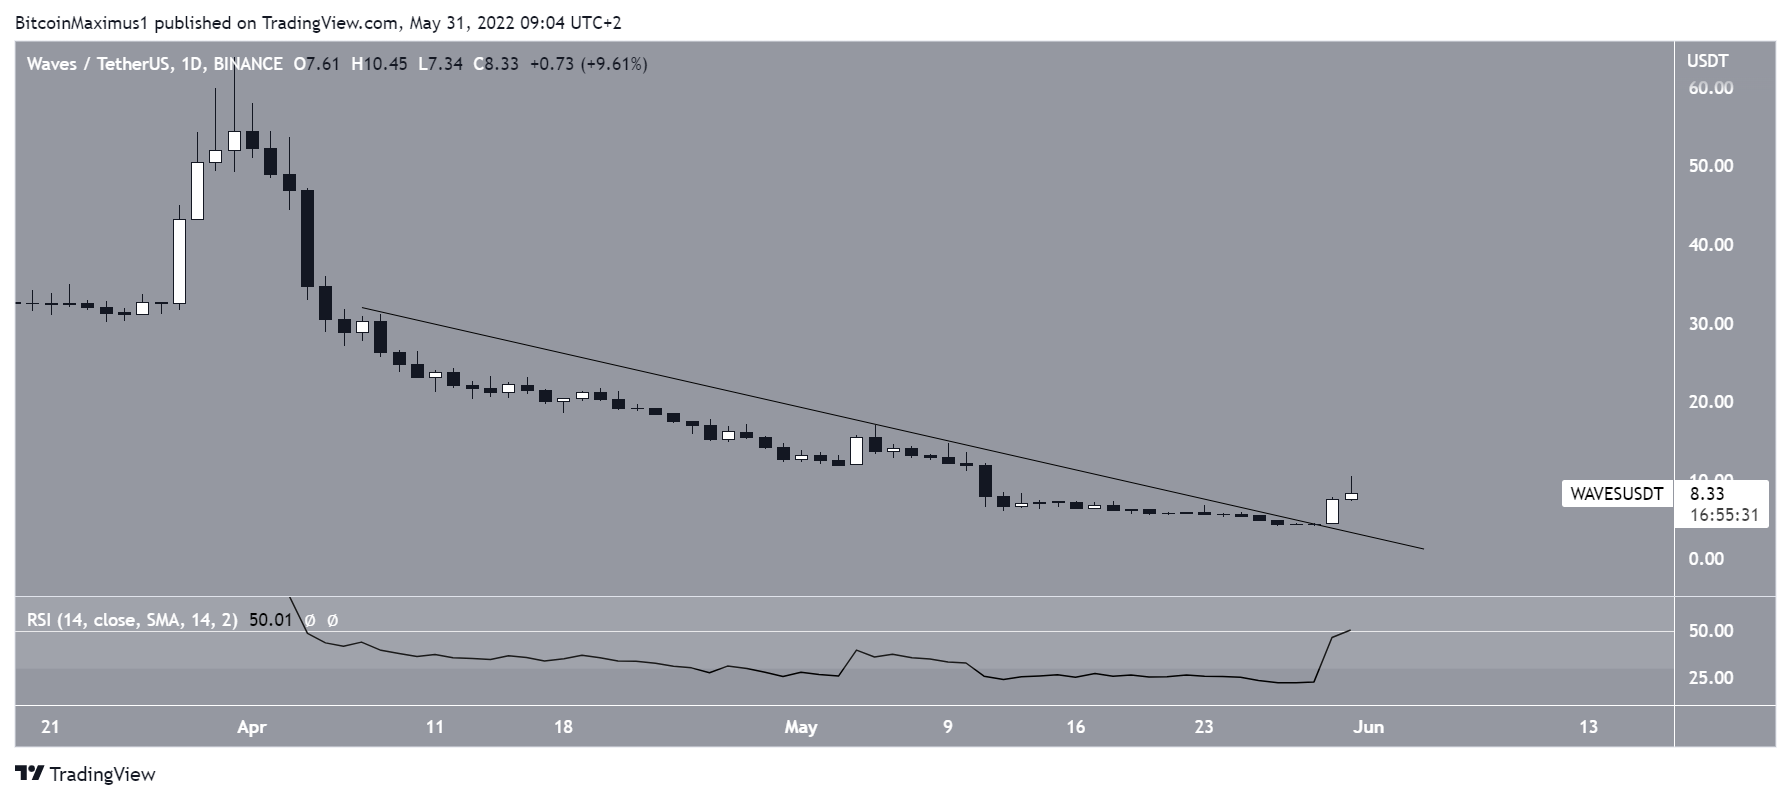
Ongoing WAVES bounce
The daily chart shows that WAVES was subject to a significant increase on May 30, in which it moved upwards by nearly 70%. This also caused a breakout from a descending resistance line that had been in place since the beginning of April.
Additionally, the RSI moved outside of its oversold territory, inside which it had been for the entirety of May. Despite this occurrence, the indicator is still below the 50 line, which is considered a threshold for a bullish/bearish trend.
So, both the RSI and the long-term price action are facing crucial resistance. Until they are reclaimed, the trend cannot be considered bullish.
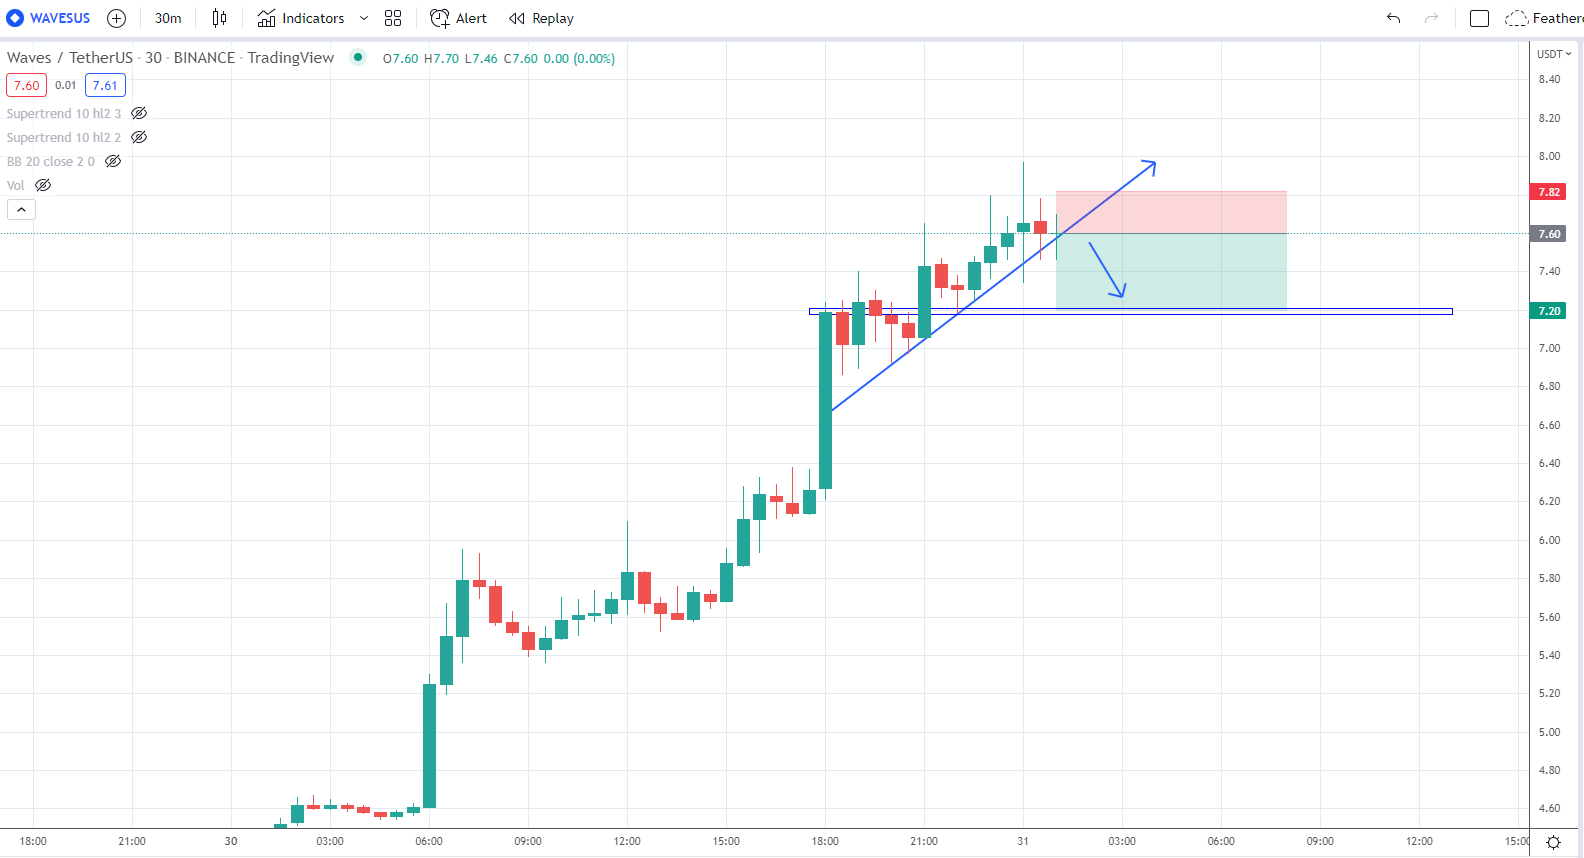
Short-term movement
Cryptocurrency trader and analyst @IncomeSharks tweeted a chart of WAVES, which shows a short-term breakdown and a proposed movement towards $7.20.
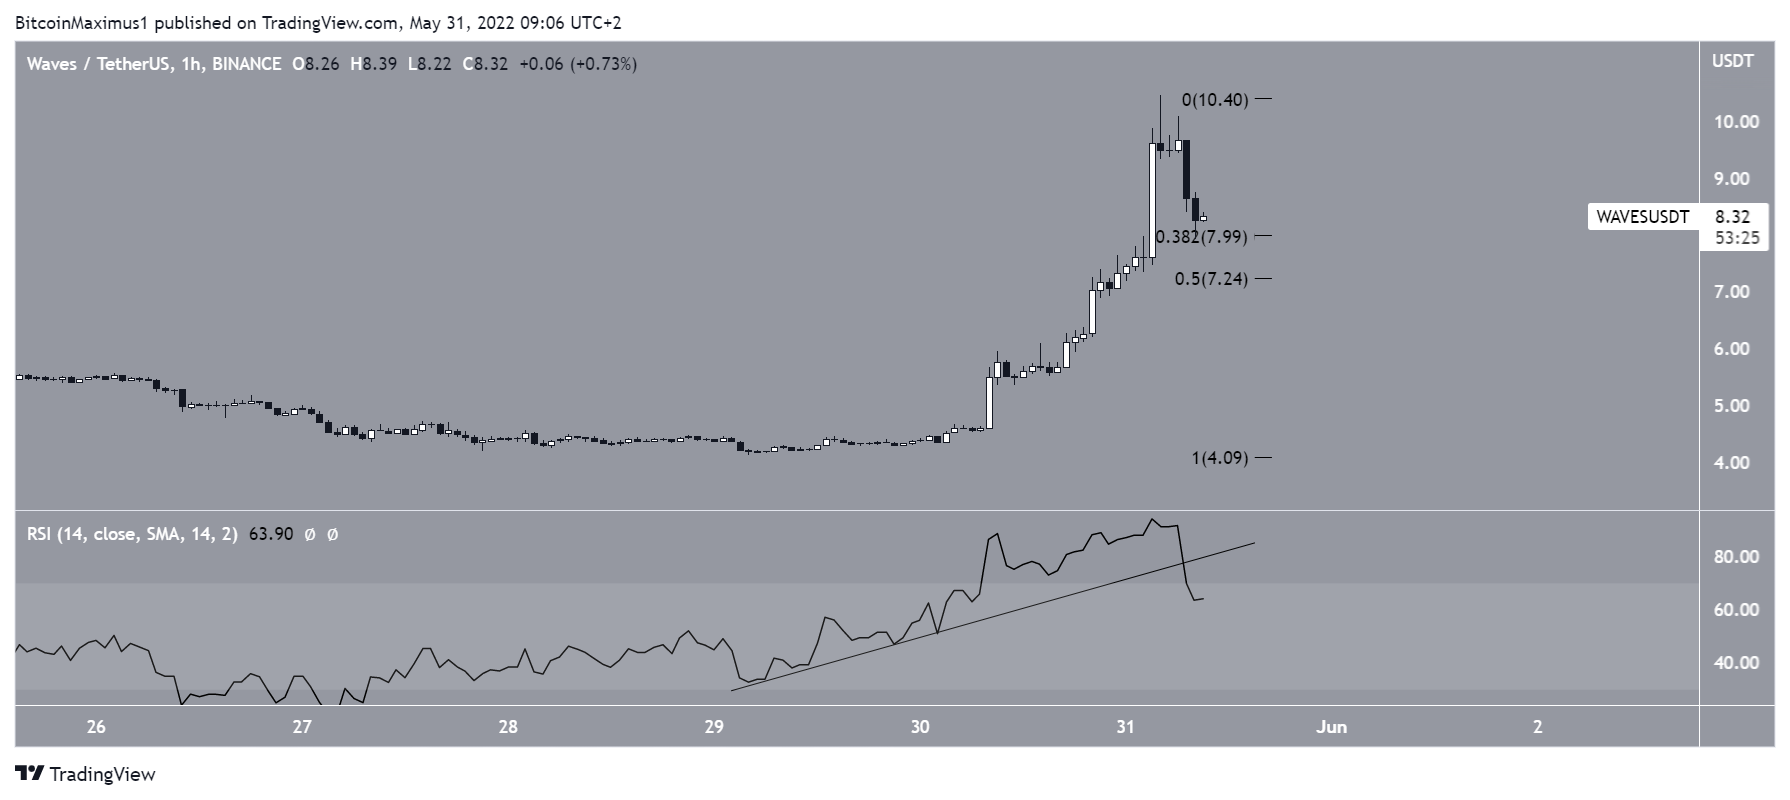
The price has not fallen since, rather it pumped and reached a high of $10.40. However, it fell afterward and is currently trading at $8.30.
Interestingly, the RSI has already broken down from its ascending support line. This often precedes price decreases, and did so in the cases of WAVES.
If the downward movement continues, the closest support area is between $7.20 and $8. It is created by the 0.382 – 0.5 Fib retracement support levels.
Be[in]Crypto’s latest bitcoin (BTC) analysis, click here


