
The Waves (WAVES) price has broken out from a long-term resistance area and validated it as support after.
WAVES is expected to continue increasing in the near future, reaching a possible high of $13.40.
Waves Long-Term Breakout
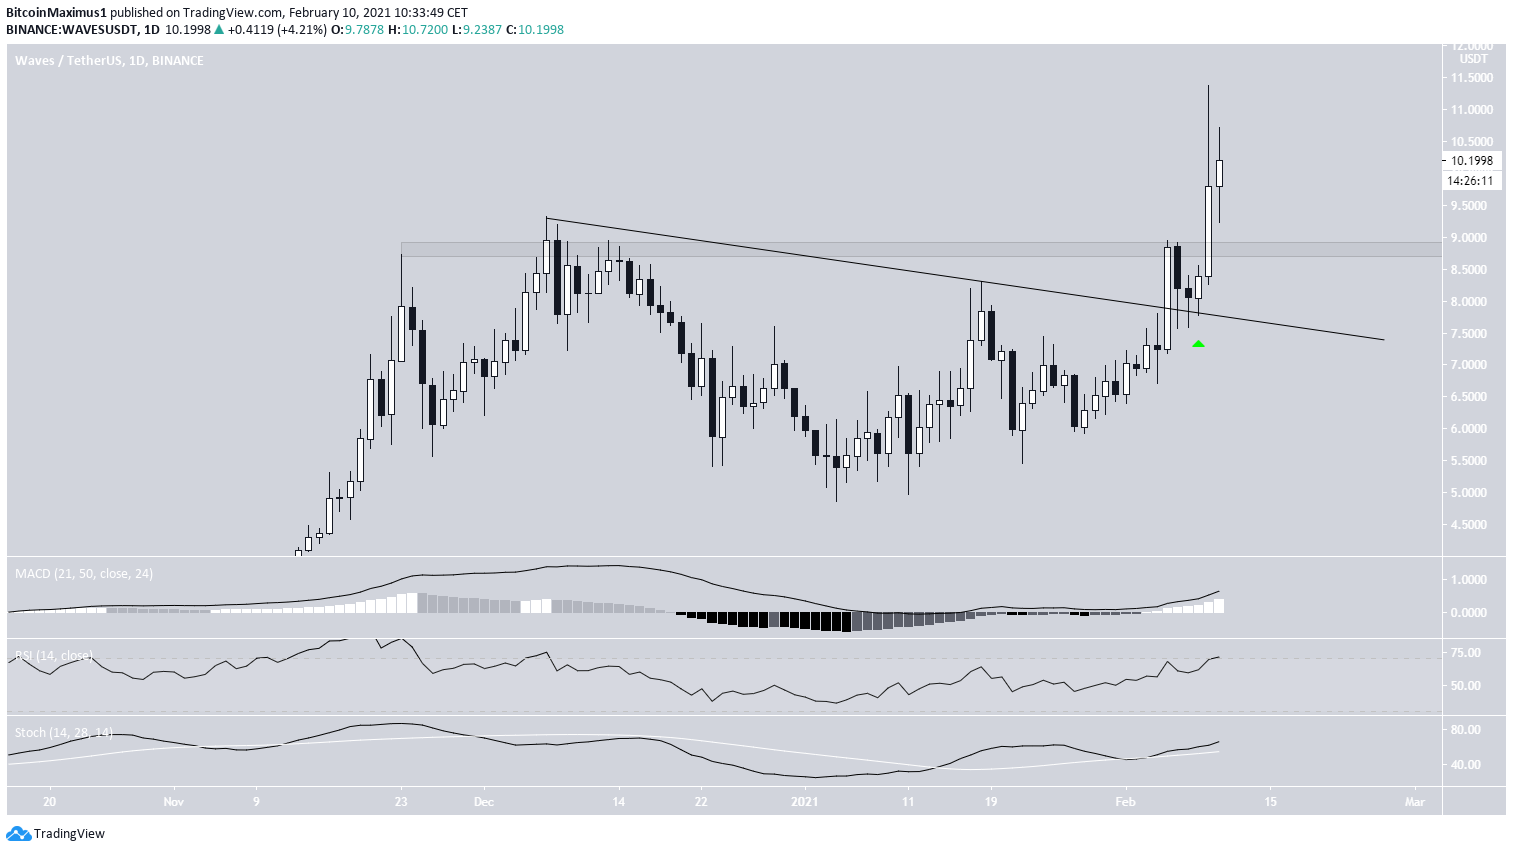
WAVES has been increasing significantly since reaching a bottom at the beginning of March 2020. In December of the same year, it was rejected by the long-term $8.50 resistance area, which has been in place since the beginning of 2018.
However, WAVES made another attempt at breaking out and was successful in doing so on Feb. 9, 2021. So far, it has reached a high of $11.38.
Technical indicators in the weekly time-frame are bullish, supporting the continuation of the upward movement.
The closest resistance area is found at $14.43 (0.618 Fib retracement level). The next resistance beyond that is the all-time high at $23.34 (according to Binance figures).
Current Movement
Cryptocurrency trader @ScottMelker outlined a WAVES chart, stating that he expects a significant increase after a breakout from the parallel descending channel that WAVES has been trading in.

Since the tweet, WAVES has re-tested the level and proceeded to move above the aforementioned $8.50 resistance area.
Technical indicators in the daily time-frame are also bullish, aligning with those from the weekly chart.
WAVES Wave Count
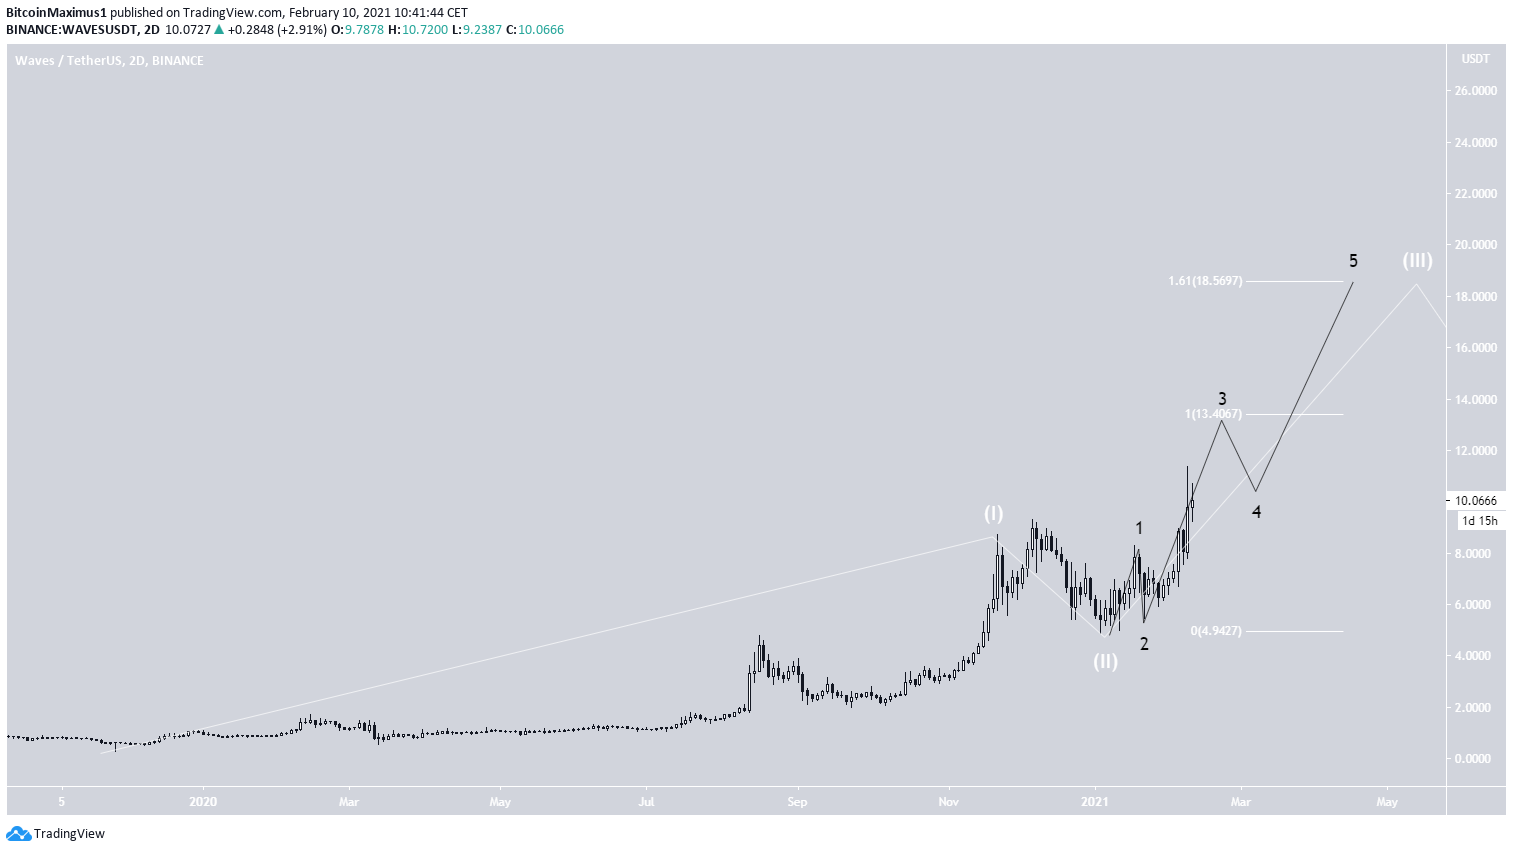
The wave count suggests that WAVES has completed a long-term wave one and two (white), and has now begun wave three.
The sub-wave count is given in black, indicating that Waves is in sub-wave three.
The two most likely targets for the top of the upward move are found at $13.40 and $18.56. These targets would give waves one and three a 1:1 and 1:1.61 ratio respectively.
WAVES/BTC
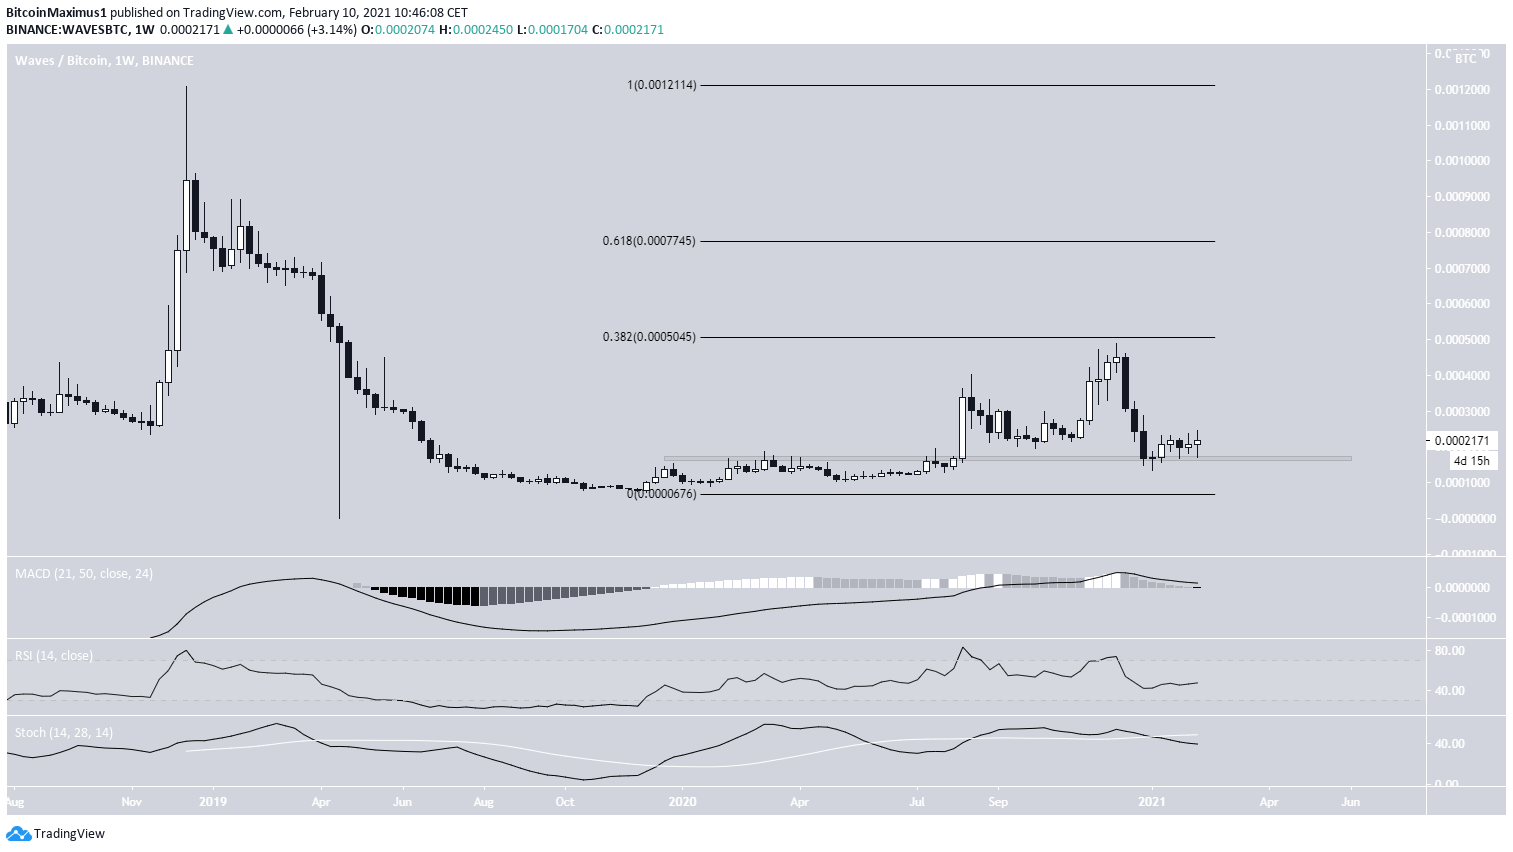
The WAVES/BTC chart shows that the price has reclaimed the 16,500 satoshi area, which is now likely to act as support.
Despite the bullish reclamation, technical indicators are bearish and fail to confirm the possibility of an upward move.
If one occurs, the closest resistance areas would be found at 50,000 and 77,450 satoshis.
Conclusion
WAVES/USD seems to be in a bullish trend and is expected to increase to the neighborhood of $13.40.
The direction of the trend for WAVES/BTC is not yet clear.
For BeInCrypto’s latest Bitcoin (BTC) analysis, click here
