
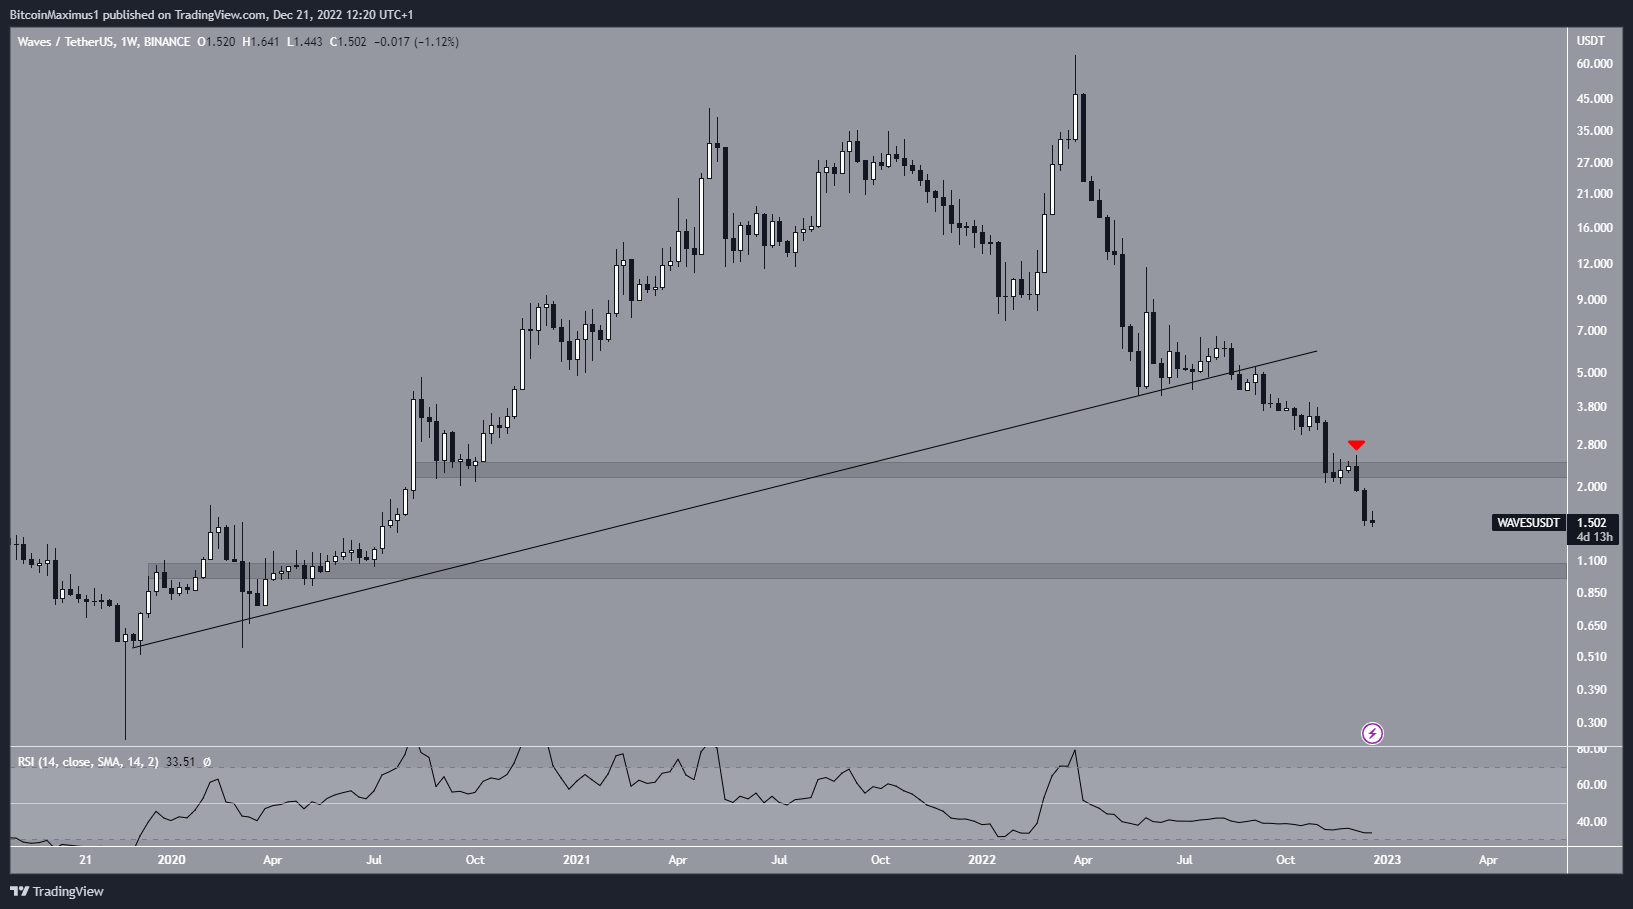
The Waves (WAVES) price has broken down from crucial horizontal and diagonal levels, likely due to the USDN depeg.
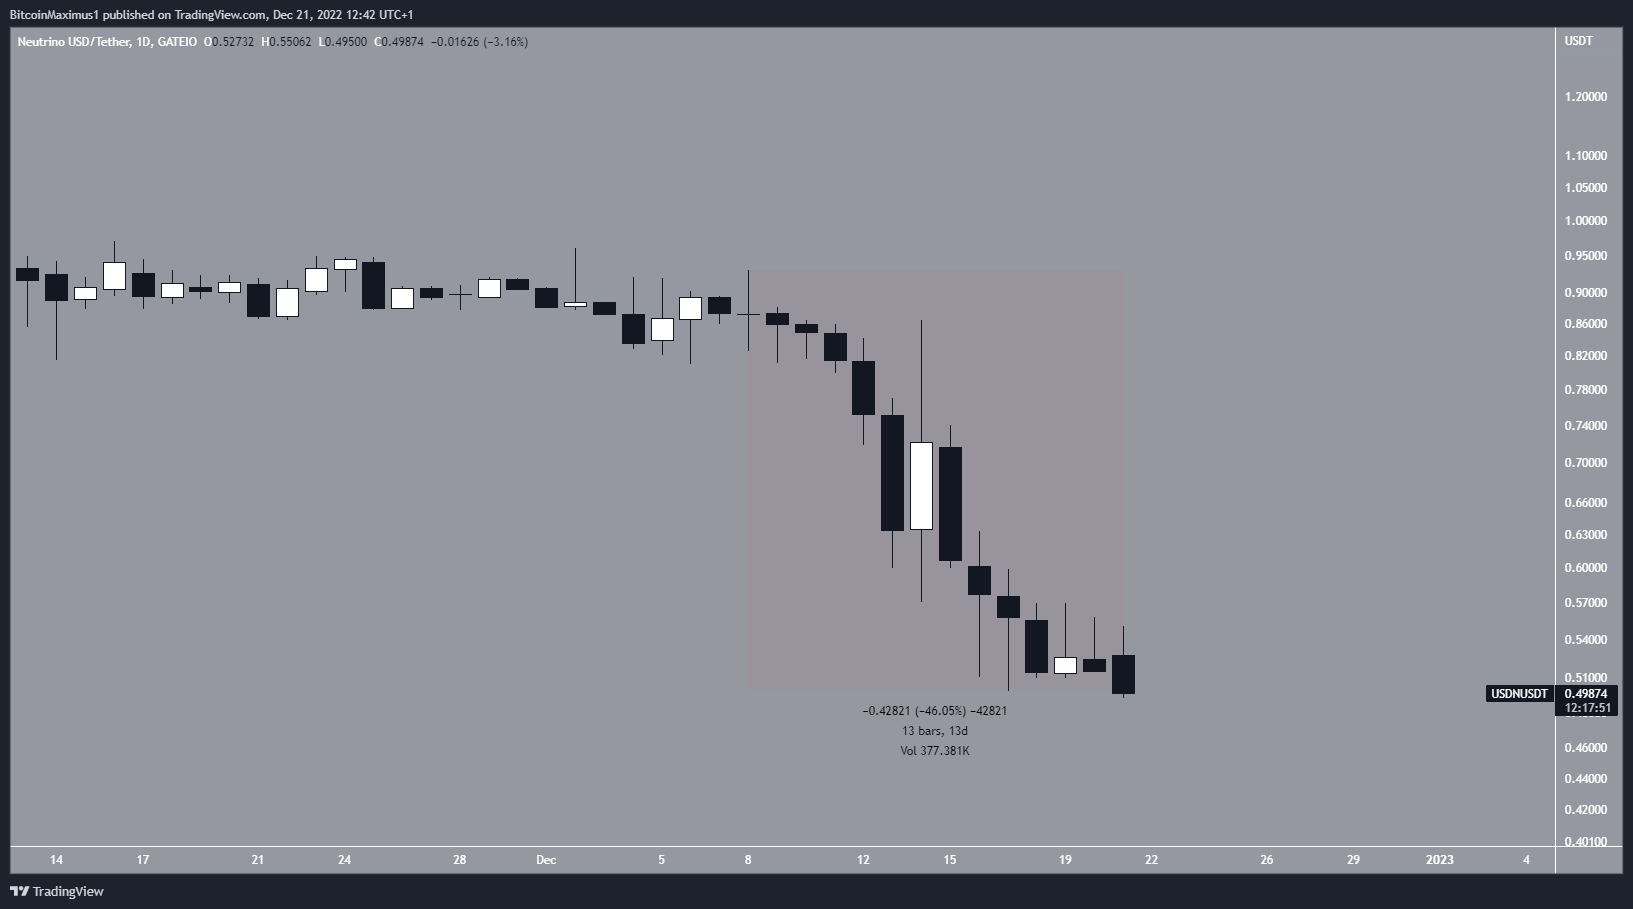
It is possible that the WAVES price drop occurred as a result of the Neutrino USD (USDN) depeg. USDN is the algorithmic stablecoin of the WAVES blockchain platform, which has struggled to maintain its peg to the U.S. dollar during the past few months. In order to mint USDN, users are required to stake WAVES in Neutrino, a protocol based on WAVES.
Sasha Ivanov, the founder of the WAVES protocol, has attempted to calm fears about a death spiral by announcing that USDN will be fine and WAVES will not go to zero. However, he also announced that he is planning to issue a new stablecoin after setting in motion his plan to resolute the USDN depeg, which is currently at $0.50. USDN has decreased by 46% over the past 13 days.
WAVES Price Breaks Down From Crucial Support
The WAVES price has fallen since reaching an all-time high price $63.88. The downward movement led to a low of $1.44 on Dec. 21.
During the decrease, the WAVES price broke down from an ascending support line and the $2.30 resistance area (red icon). Both are considered decisive bearish signs.
Technical indicators also provide a bearish outlook. This is visible in the weekly RSI, which is decreasing and is below 50.
If the downward movement continues, the closest support area would be at $1. Currently, this seems to be the most likely WAVES price projection.
Therefore, the trend cannot be considered bullish until WAVES reclaims the $2.30 horizontal area and validates it as support.
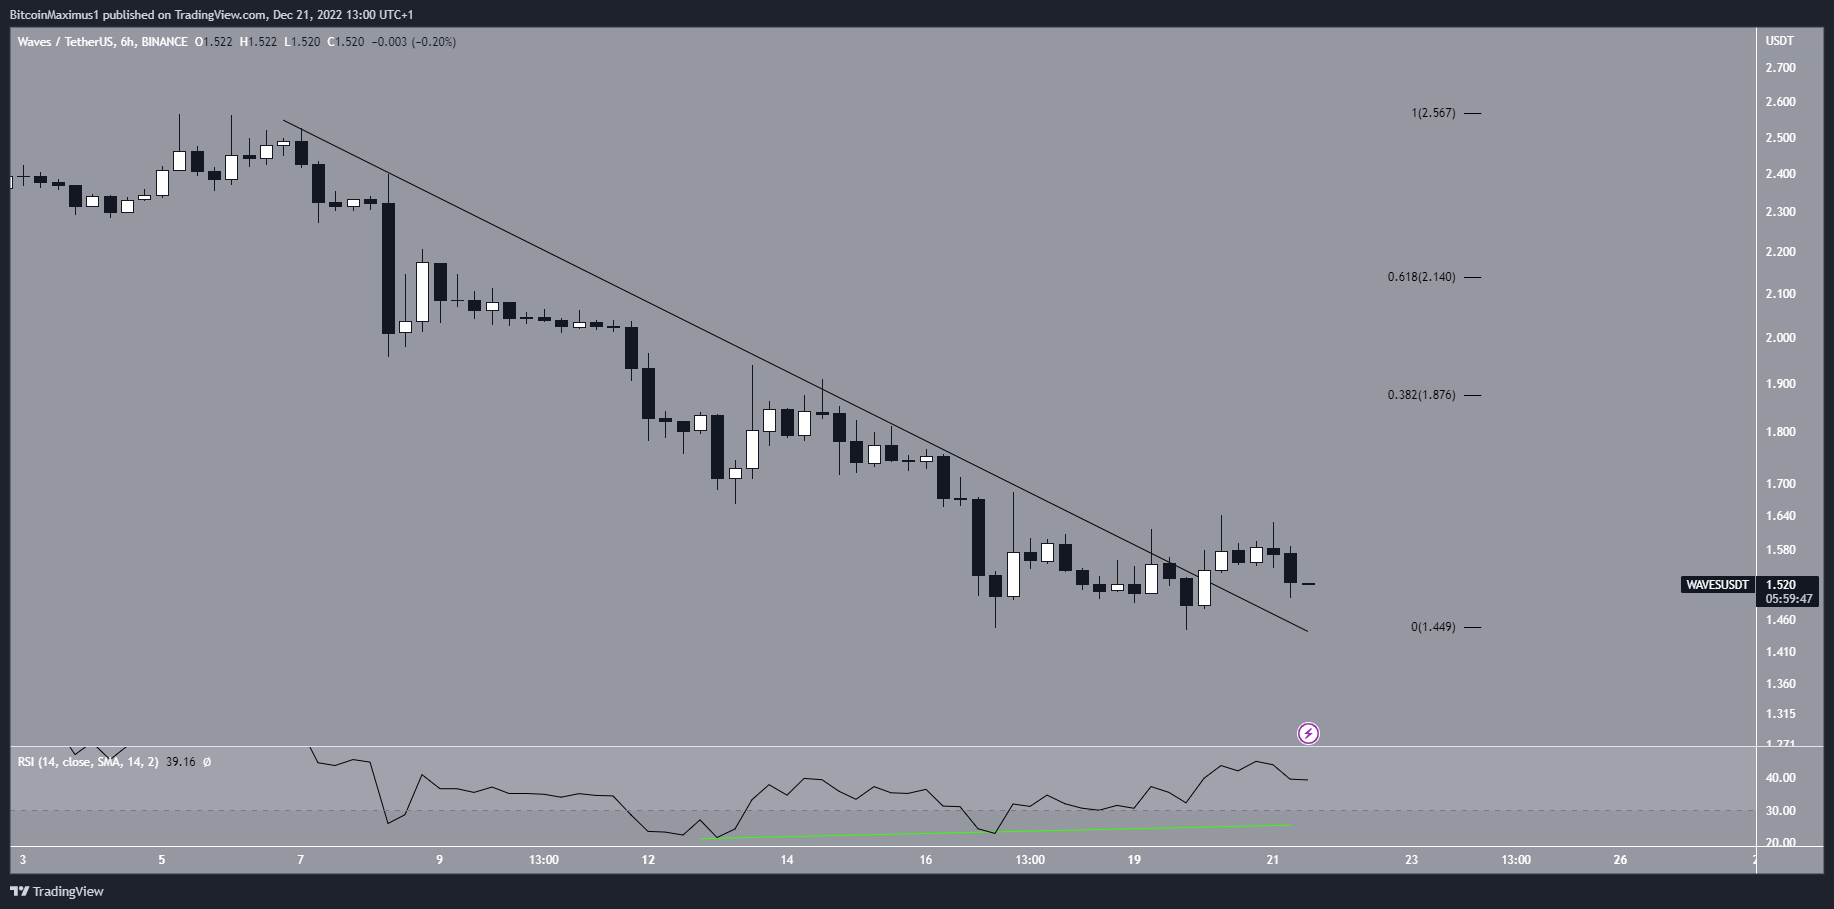
Possibility For Short-Term Relief
Finally, the six-hour chart shows that the WAVES token price broke out from a descending resistance line in the 24 hours after the RSI generated bullish divergence (green line). The trendline of the divergence is still intact.
The six-hour readings allow for a relief rally toward $1.88 or $2.14, the 0.382 and 0.618 Fib retracement resistance levels, respectively.
However, due to the bearish readings from the daily time frame, a downward movement would be expected afterward.
To conclude, the long-term readings for WAVES are bearish due to breakdowns from crucial support levels. Moreover, the USDN stablecoin depeg has aided this downward movement. As a result, the most likely WAVES price forecast is a drop toward $1. Reclaiming the $2.10 area would invalidate this bearish hypothesis.
For BeInCrypto’s latest crypto market analysis, click here.
