


The Waves (WAVES) price has broken down from a long-term horizontal support area and could decrease until $2.30. The Decentraland (MANA) price has broken down from the $0.73 support area and validated it as resistance afterward (red icon). Meanwhile, the Helium (HNT) price has completed an upward correction and is poised to resume its downward movement.
WAVES Price Breaks Down Below Horizontal Support
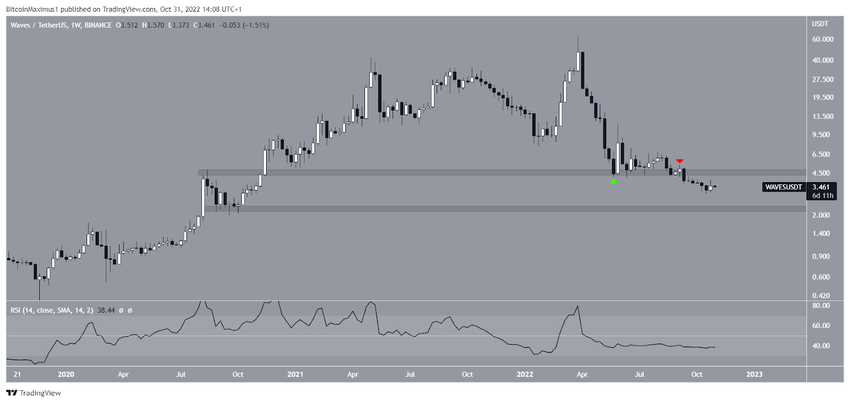
The WAVES price has been falling since reaching an all-time high price of $63.88 in March 2022. Throughout this period, WAVES has been one of the biggest losers in the crypto market and has decreased by 94.50%.
In Sept. 2022, the WAVES price broke down from the $4.60 horizontal area, which had been acting as support since the beginning of 2021. Afterward, it validated the area as resistance (red icon).
Breakdowns from such long-term structures usually lead to sustained downward movements. If the decrease continues, the closest support area would be at $2.30.
The weekly RSI is also decreasing and is still below 50, another sign of a bearish trend.
The invalidation of the bearish hypothesis would be a weekly close above the $4.60 area. However, this seems unlikely at the current time.
MANA Price Gets Rejected by Resistance
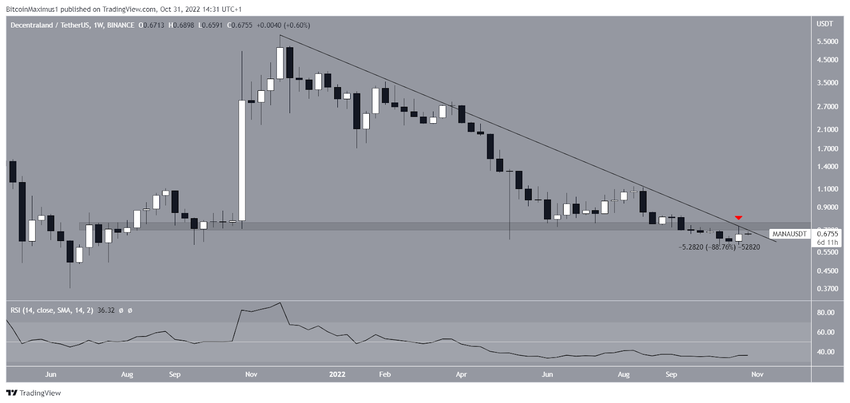
In similar fashion to WAVES, MANA has been one of the biggest losers in the cryptocurrency market over the past year. Since the $5.90 all-time high of Nov. 2021, market data shows that the MANA price has decreased by 89%. Throughout this period, it followed a long-term descending resistance line.
The line has been validated several times, most recently on Oct. 26 (red icon). The rejection also coincided with the $0.73 horizontal resistance area, increasing its significance.
In the beginning of Sept. MANA also broke down from the $0.75 area. Until there is a weekly close above both the line and the $0.73 area, the trend cannot be considered bullish.
If the downward movement continues, the MANA price could fall to $0.45.
HNT Price Completes Upward Correction
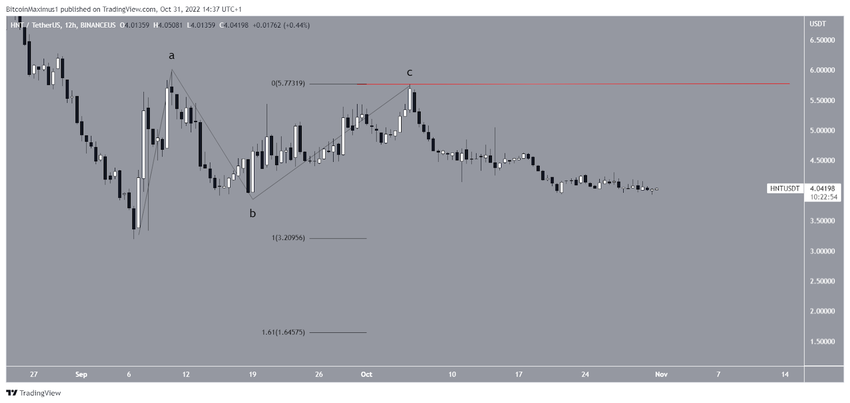
The HNT price has been moving upward since falling to a low of $3.19 on Sept. 5. However, the upward movement looks like a completed A-B-C (black) short-term correction. If so, it would follow that the HNT price has now begun another downward movement.
While the downward movement has stalled over the past 24 hours, there are no bullish reversal signs in place. As a result, the most likely scenario is a decrease towards the 1.61 external Fib retracement at $1.65.
Conversely, an increase above the wave C high (red line) at $5.76 would invalidate the bearish hypothesis and suggest that new highs are expected.
For the latest BeInCrypto Bitcoin (BTC) and crypto market analysis, click here
Disclaimer: BeInCrypto strives to provide accurate and up-to-date information, but it will not be responsible for any missing facts or inaccurate information. You comply and understand that you should use any of this information at your own risk. Cryptocurrencies are highly volatile financial assets, so research and make your own financial decisions.


