
The Waves (WAVES) price has been declining since reaching a high on Nov. 23. Despite an upward move last week, the breakdown from the current short-term pattern suggests the price will head lower.
Rejection From Long-Term Resistance
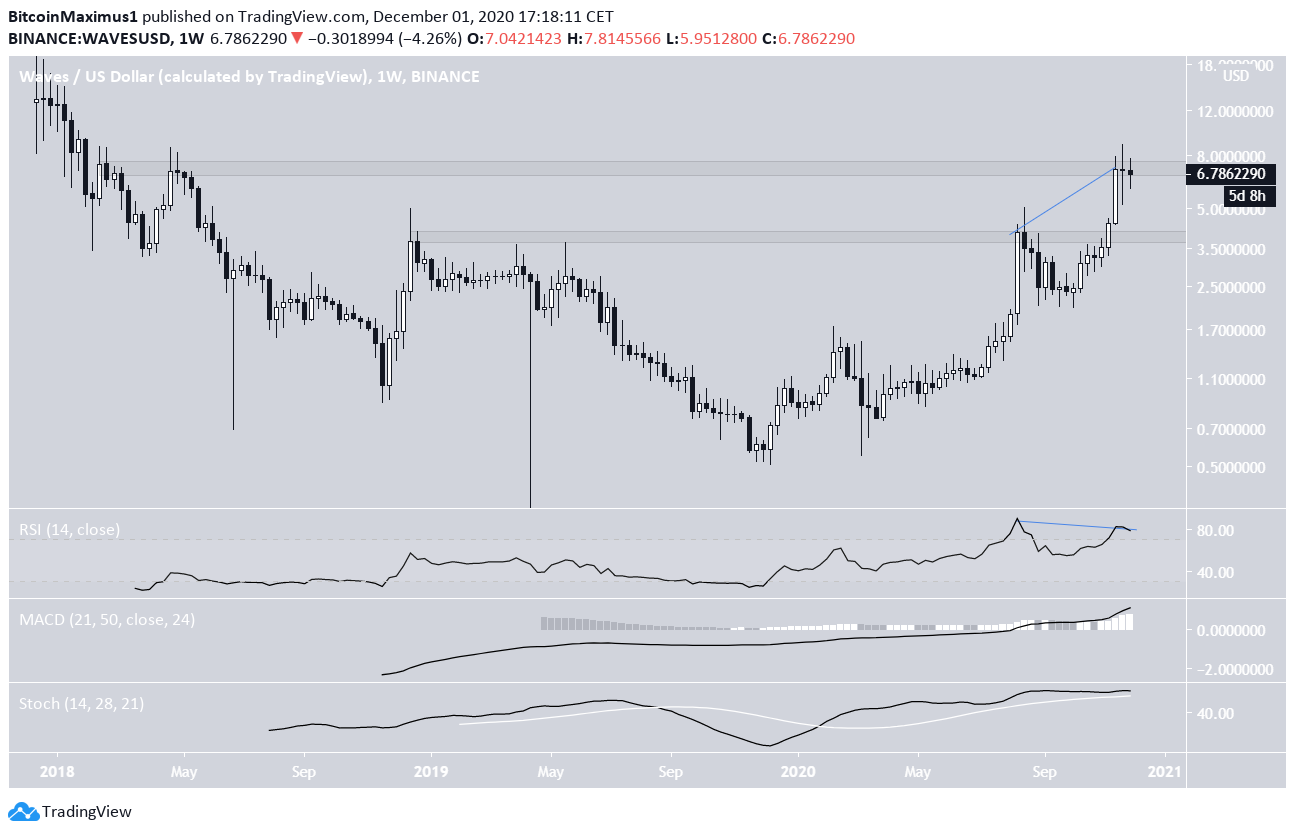
On Nov. 23, the WAVES price reached a high of $8.86 before dropping sharply. While the high was above the $7.20 long-term resistance area, the price has fallen back below it, solidifying its significance.
While the MACD and Stochastic Oscillator are still increasing, there is a massive bearish divergence that has developed on the weekly RSI, which is often a sign of a trend reversal.
On the weekly time-frame, the closest support area is at $4.
(Note: The logarithmic chart is used in the image below to better visualize large price fluctuations)
Future Movement
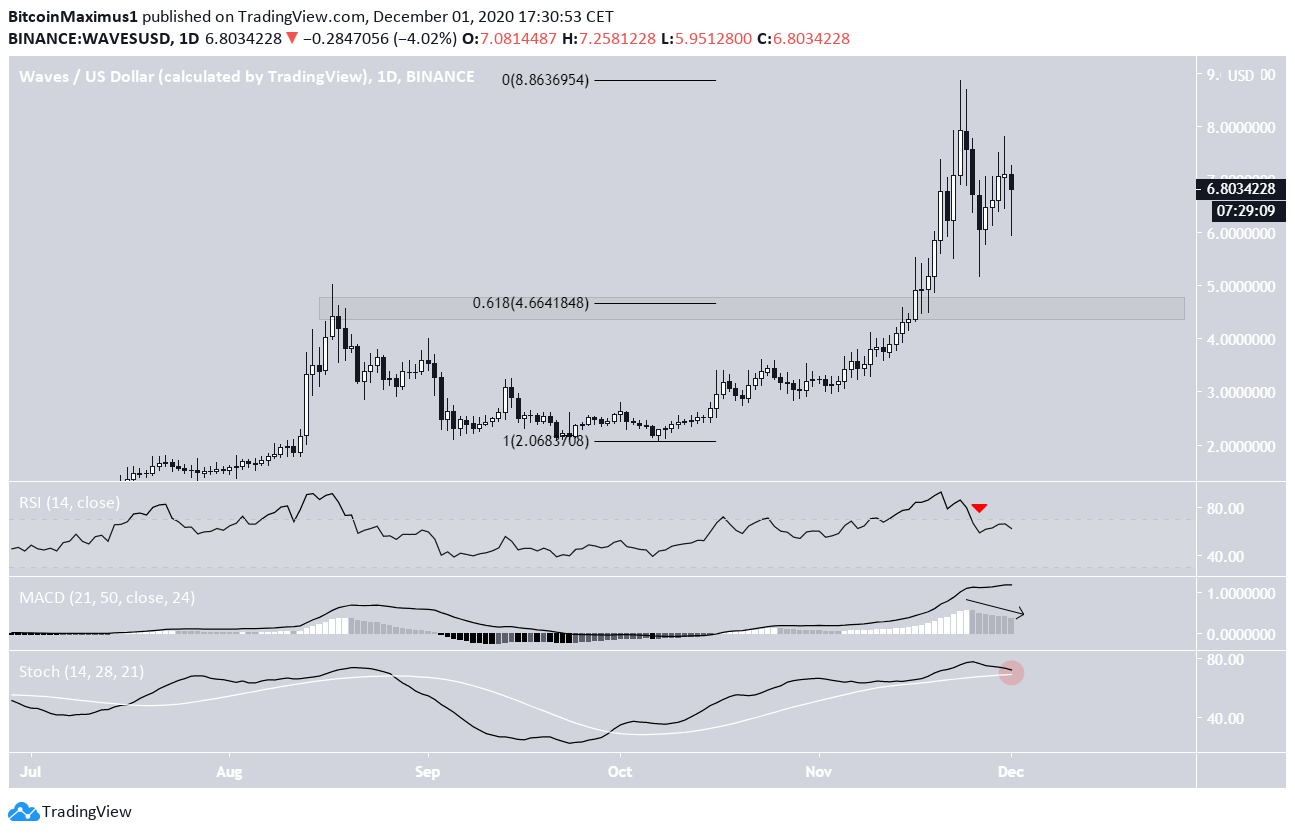
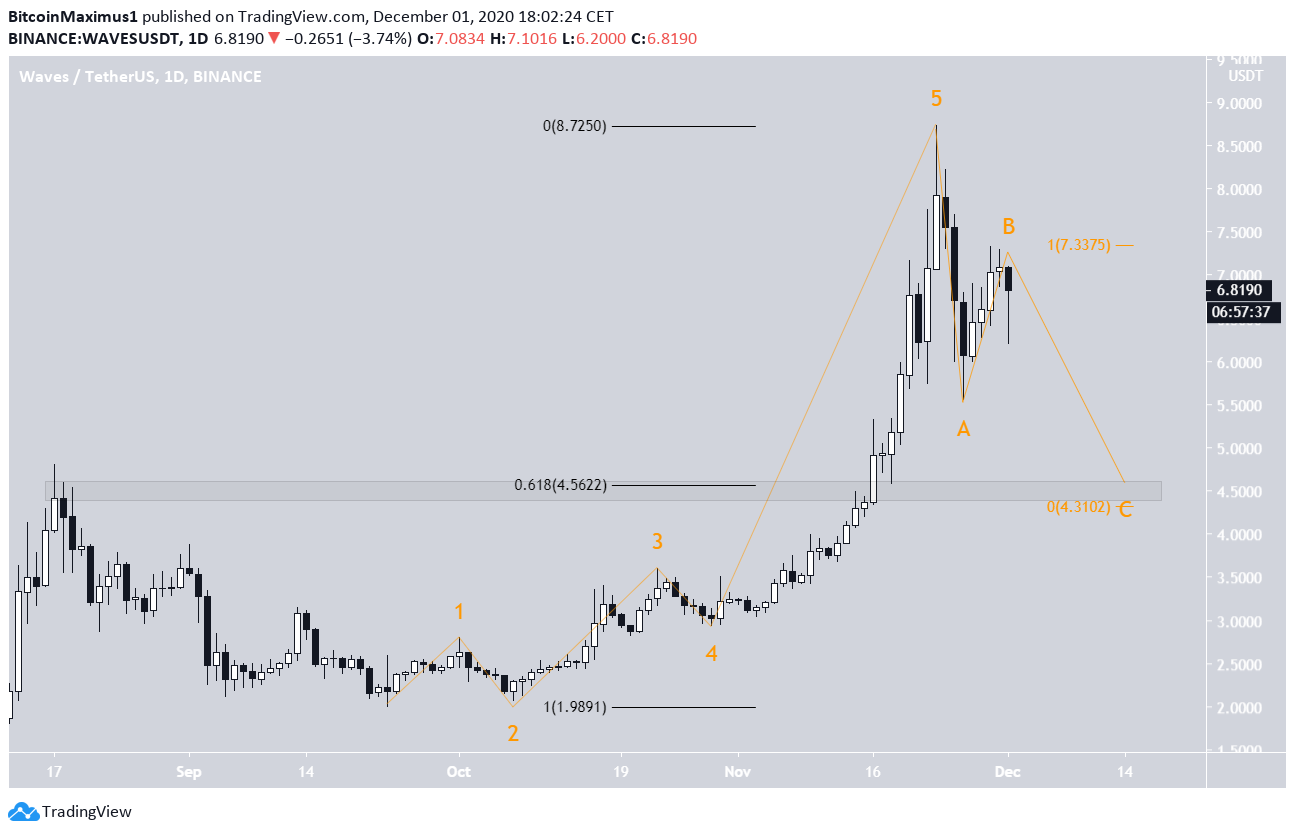
The daily chart for WAVES provides a more bearish outlook.
First, we can note several long upper wicks during the recent highs, a sign of selling pressure.
Second, indicators have begun to turn bearish. All three of the RSI, MACD, and Stochastic Oscillators are falling, the latter being very close to making a bearish cross. Furthermore, the RSI has fallen below 70 after forming bearish divergence.
The closest support area is at $4.66, being both the August highs and the 0.618 Fib retracement level of the most recent upward move.
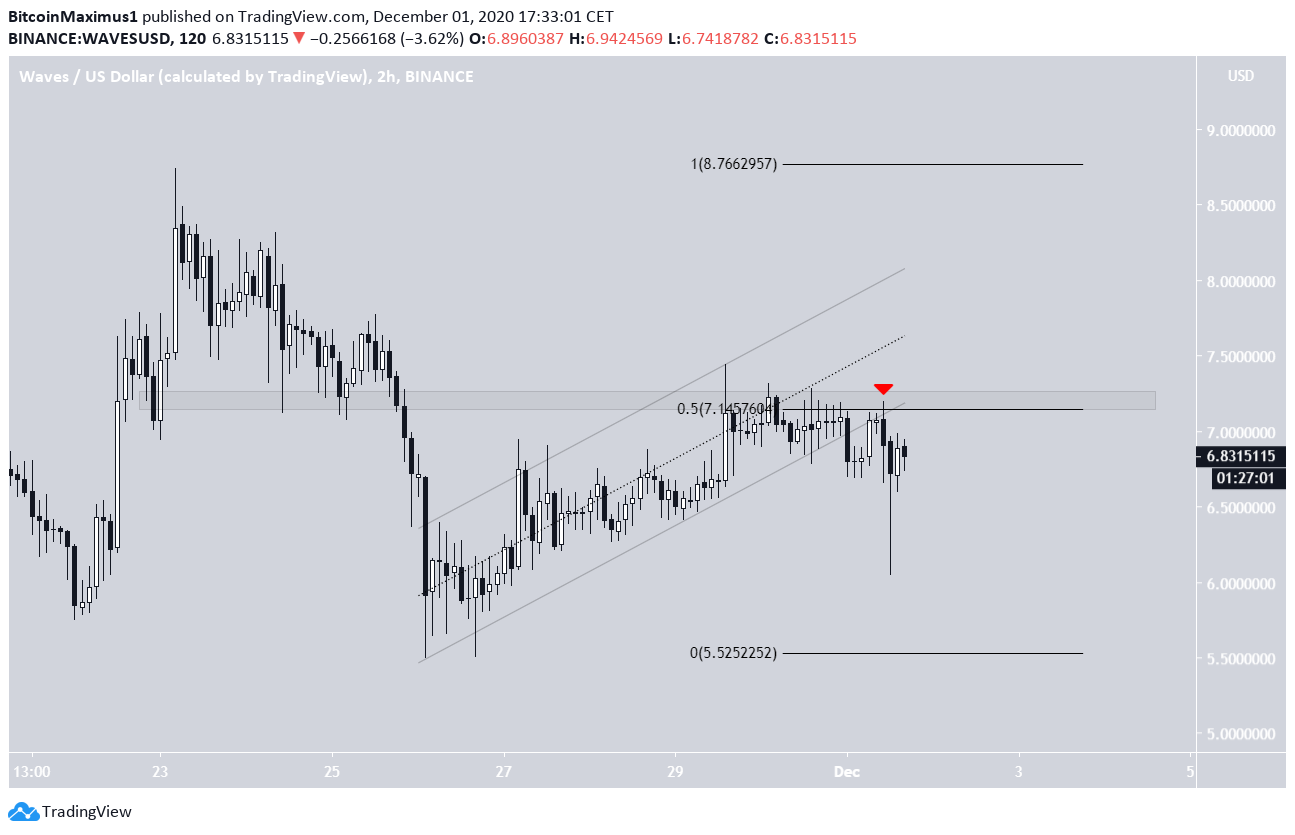
The shorter-term two-hour chart supports the possibility of a decline since the 0.5 Fib retracement level and the $7.15 resistance area rejected the price, causing a sharp decline afterward.
Furthermore, the price has broken down from a parallel ascending channel, confirming that it’s heading lower.
Wave Count
Cryptocurrency trader @TheEWguy outlined a WAVES chart, stating that the price is in an extended upward move and will eventually reach highs above $15.
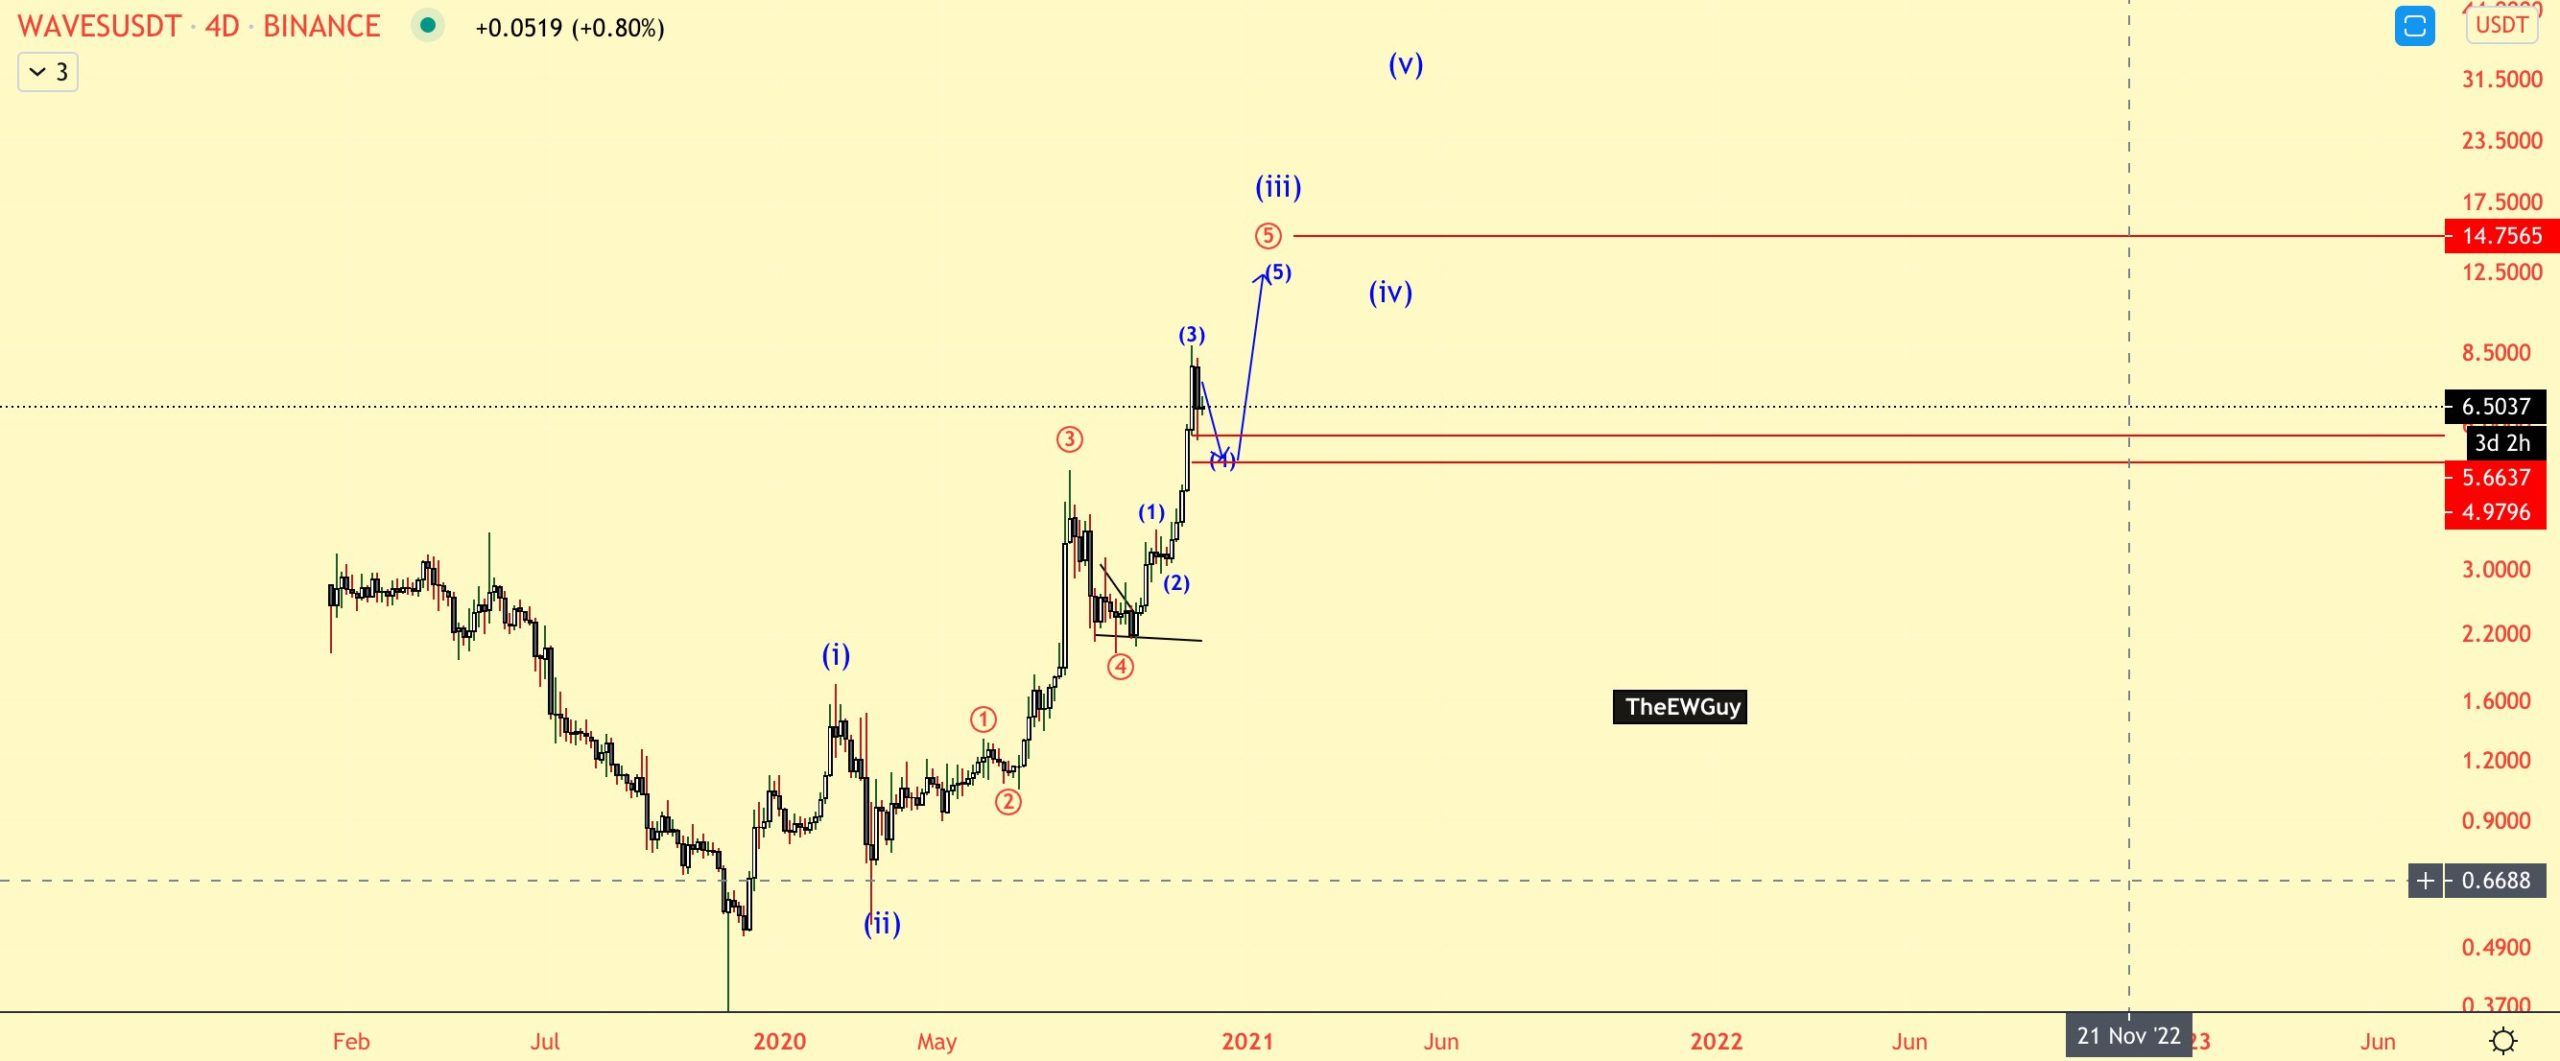
While it’s possible that the longer-term count and movement will take the price above $15, the short-term count suggests that another decrease is in store.
The price seems to have completed a bullish impulse (shown in orange below) and is now inside an A-B-C corrective structure (orange). The breakdown from the channel also supports the structure as a B wave.
If the A:C waves have a 1:1 ratio, the WAVES price would fall all the way to $4.31, only slightly below the previously outlined $4.66 support area, thus providing confluence for the potential bottom.
Conclusion
To conclude, the WAVES price is likely to move downwards towards $4.66 before potentially beginning yet another upward movement.
For BeInCrypto’s latest Bitcoin analysis, click here!
Disclaimer: Cryptocurrency trading carries a high level of risk and may not be suitable for all investors. The views expressed in this article do not reflect those of BeInCrypto
