


The Waves (WAVES) price is at risk of breaking down from a bullish structure that has been in place over the past two months.
Technical indicators and the wave count suggest that this is the most likely possibility.
WAVES Reaches New Yearly High
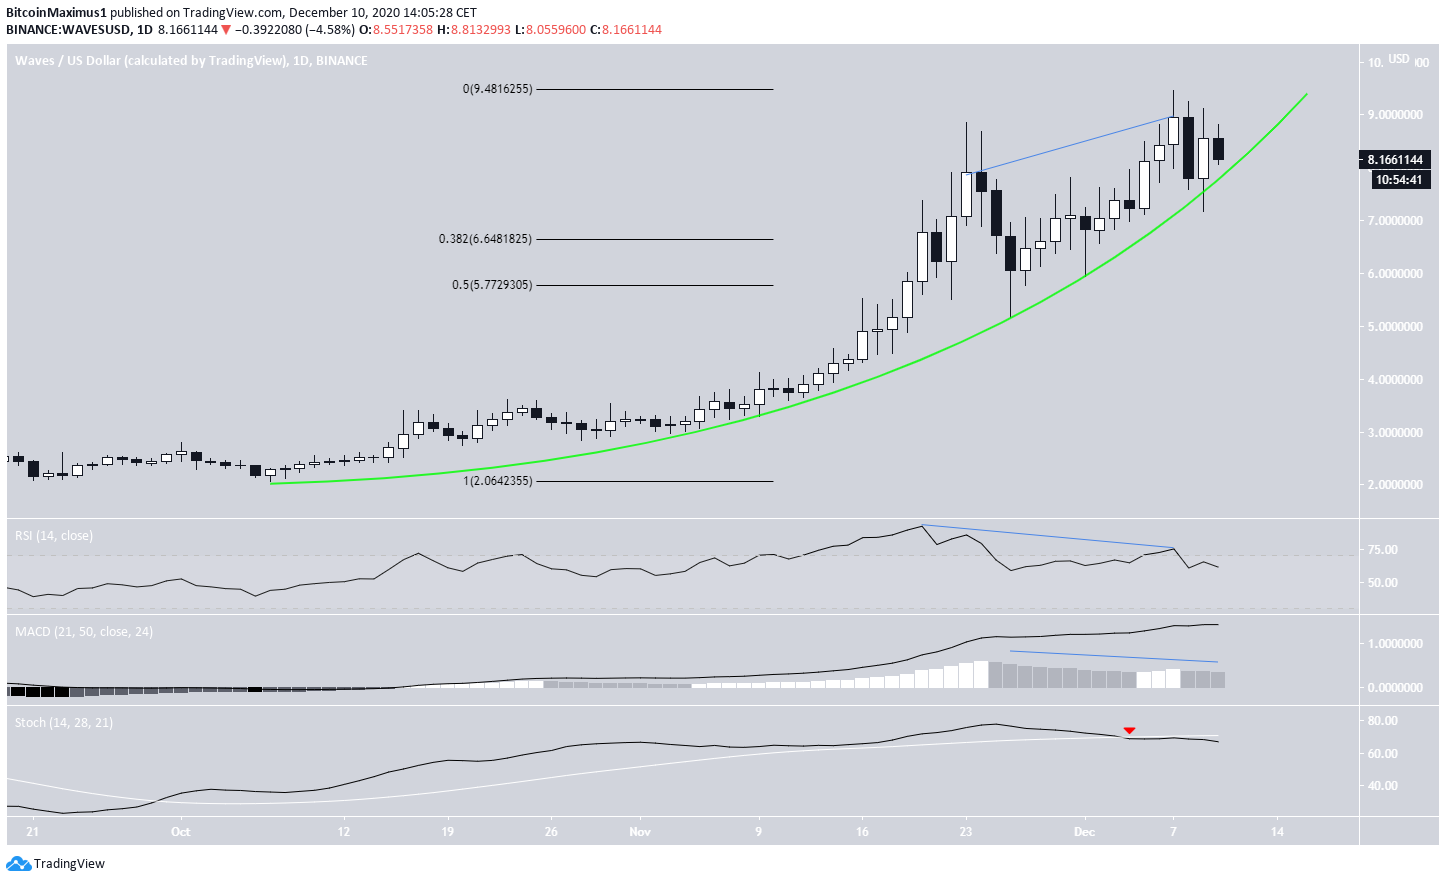
The WAVES price has been increasing alongside a parabolic ascending support line since the beginning of Oct. On Nov. 23, it touched a new yearly high but proceeded to fall and validate the parabolic support line again.
This caused another bounce, which culminated in a new yearly high of $9.45 on Dec. 7.
However, these two highs are characterized by long upper wicks. There is also bearish divergence on the RSI, which has now fallen below 0.
Furthermore, the MACD has lost its strength and the Stochastic Oscillator has made a bearish cross. This suggests that the price could break down from the parabolic support line.
If it does, the closest support levels would be at $6.65 and $5.75.
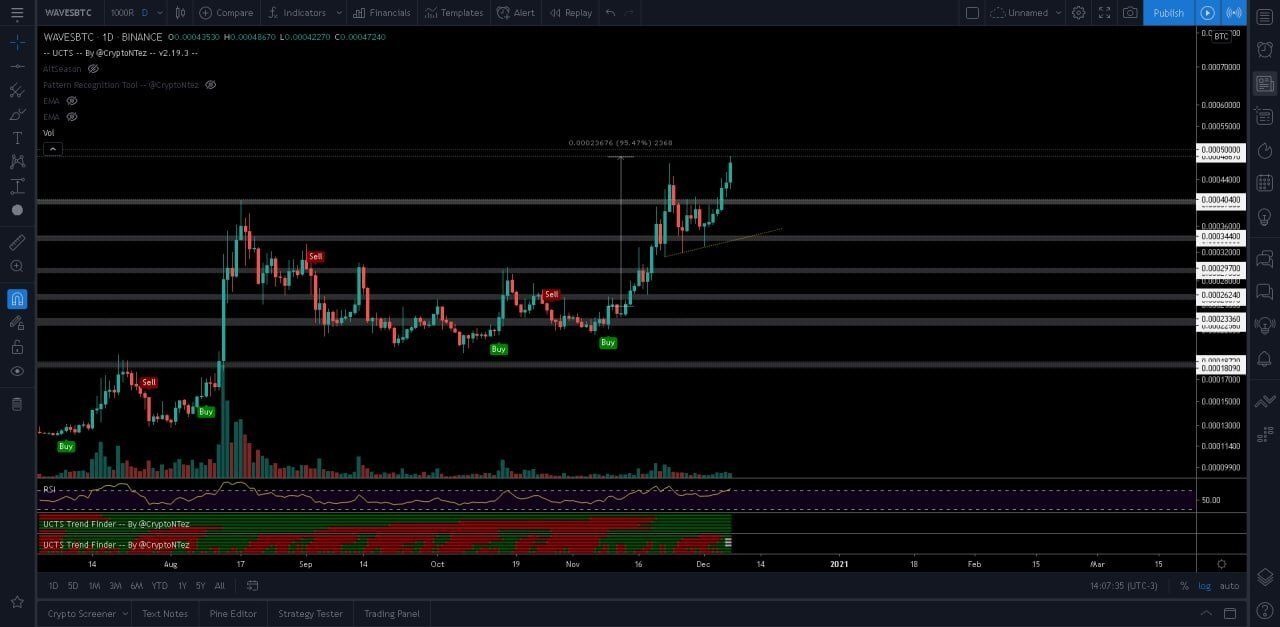
Cryptocurrency trader @CryptoNTez outlined a chart that shows a new yearly high on Dec. 7. However, since the tweet, WAVES has dropped considerably and is at risk of breaking down from its bullish structure.
Short-Term Movement
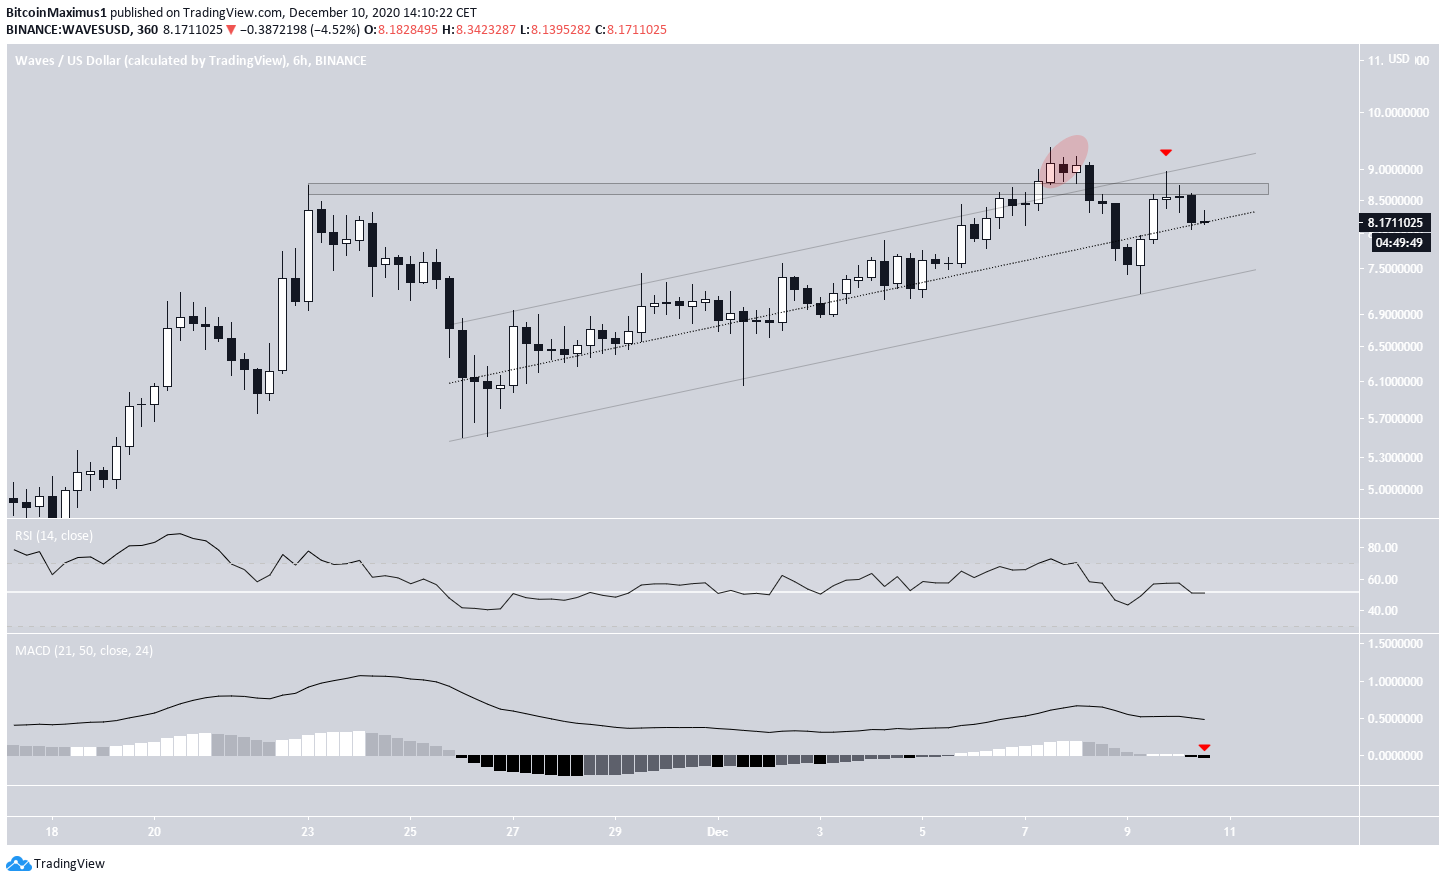
A look at the six-hour chart shows that WAVES has been trading inside a parallel ascending channel since Nov. 26.
The previous Dec. 7 high caused a deviation above this channel, but it fell back shortly afterwards, and validated the $8.60 area as resistance.
Currently, the price is trading in the middle of the channel and indicators are neutral or slightly bearish.
Parallel channels are usually corrective structures. Combine this with the daily time-frame readings and a breakdown seems likely.
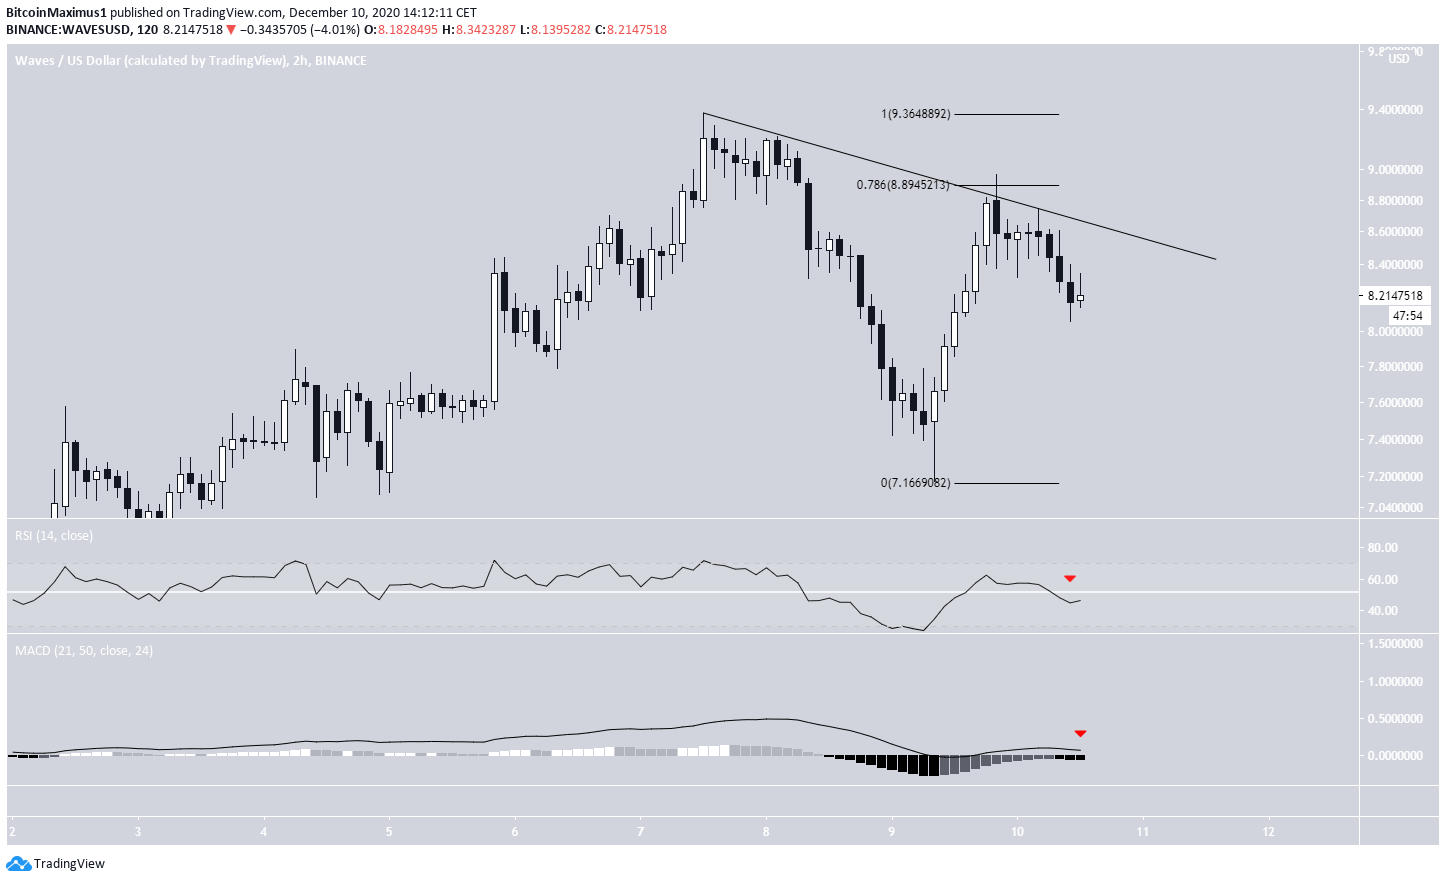
The two-hour chart shows a short-term descending resistance line in place since the decline began after Dec.7.
The line alongside the 0.786 Fib retracement level caused a rejection yesterday before it resumed its downward momentum.
A breakout above this line would put the previous scenario in doubt and suggest that WAVES is heading for another yearly high instead.
Wave Count
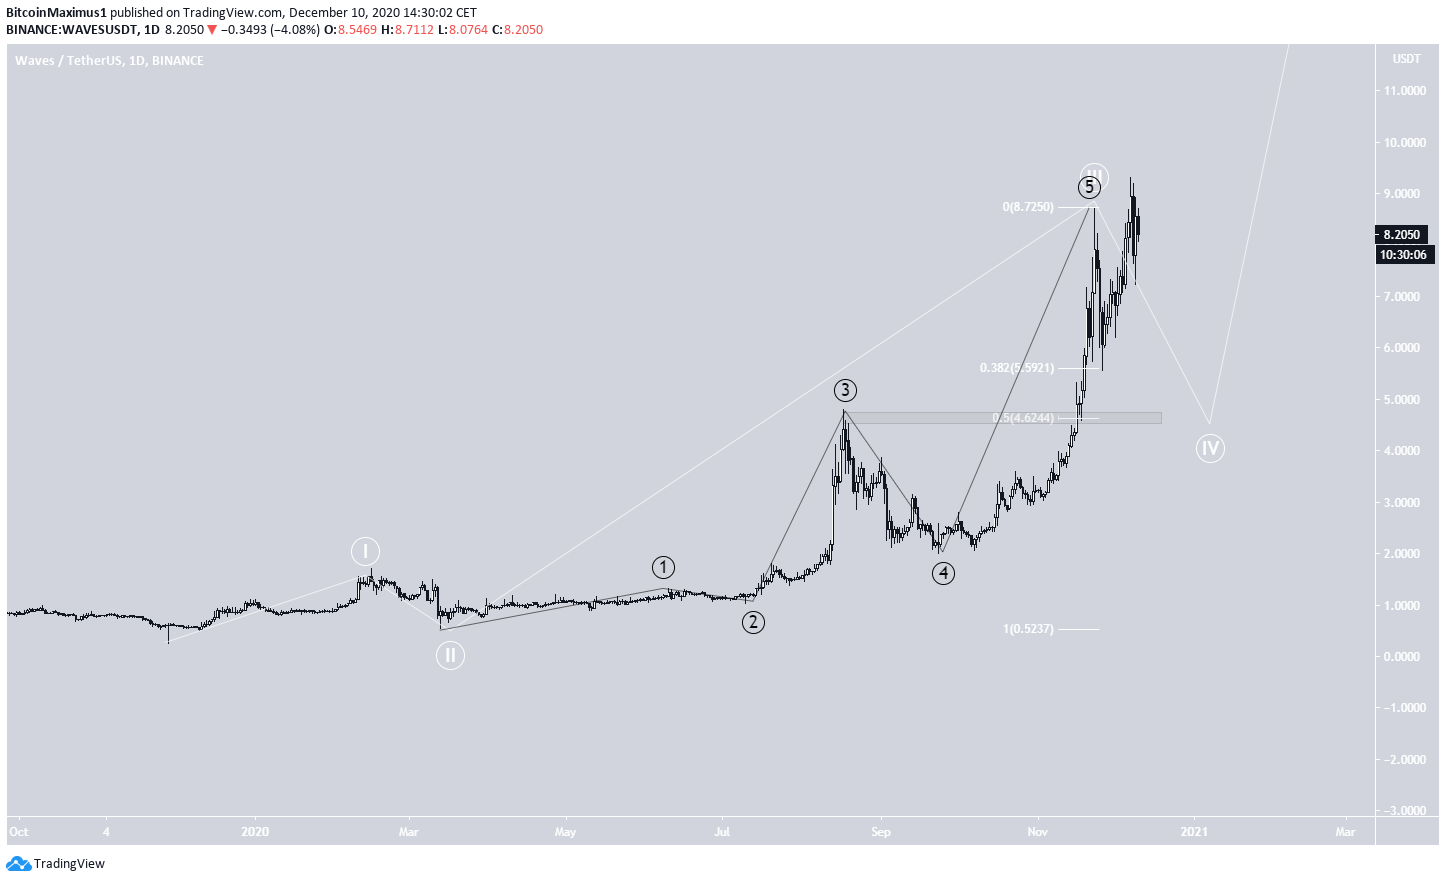
The wave count since Oct 2019 suggests that it has begun a bullish impulse (shown in white below) and has just completed wave 3. Therefore, a corrective wave 4 is likely before another upward move.
The first important support level at $5.60 coincides with that outlined in the first section at $5.75, making it likely to act as the bottom. If not, the top of sub-wave 3 at $4.60 is both a horizontal support level and the 0.5 Fib retracement of wave 3.
The sub count for wave 3 is shown in black.
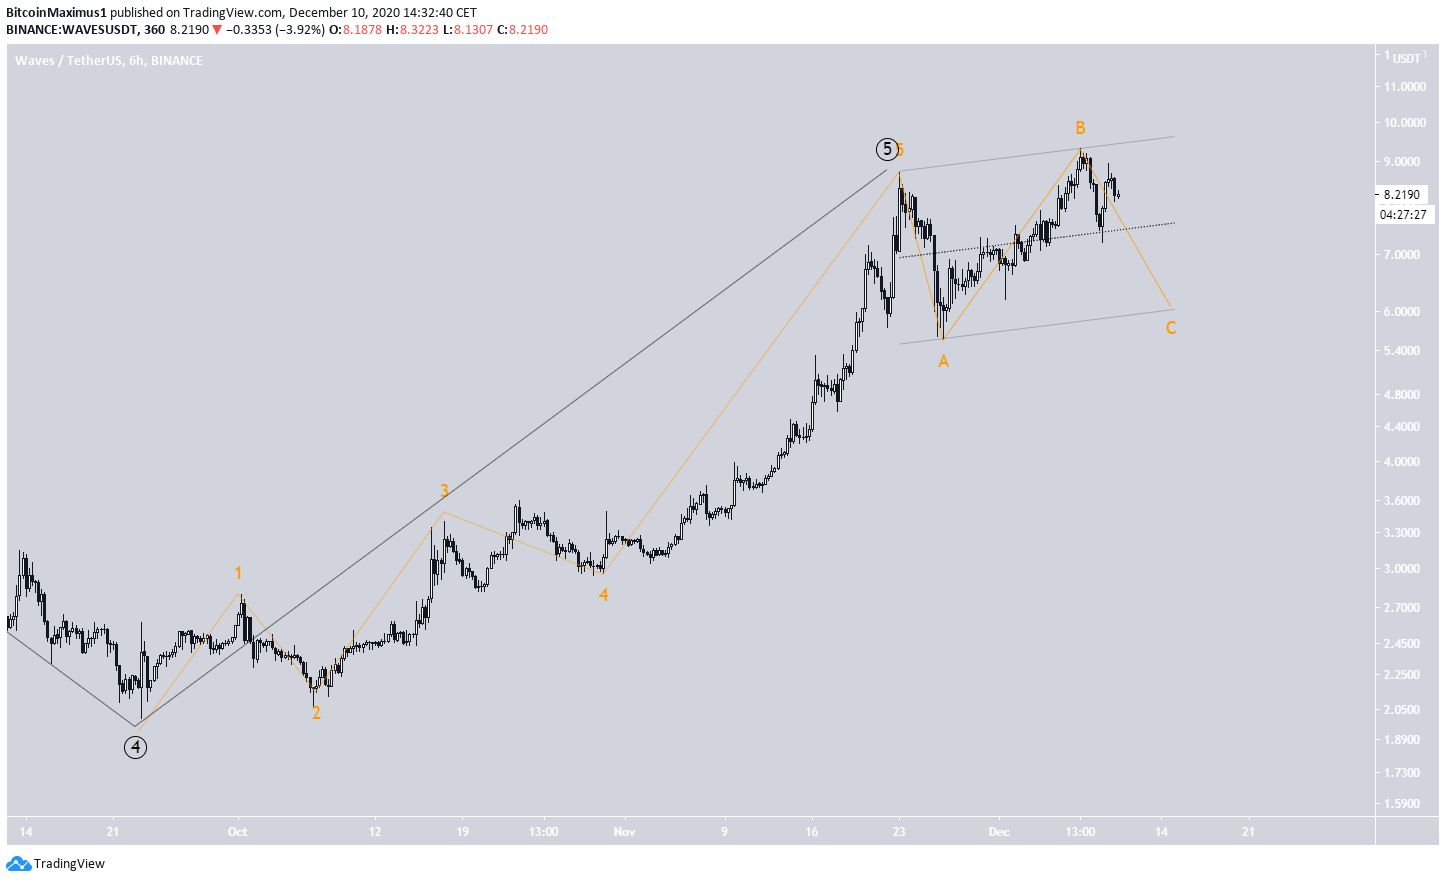
A closer look at sub-wave 5 reveals a completed minor sub-wave count (orange) and possibly an A-B-C flat corrective structure.
The most likely level for this to end would be at $6.10, the support line of the parallel channel in which the correction is taking place.
However, since wave 3 has been going on since March, this is likely to be the first part of an extended corrective structure, which would eventually take prices towards the support levels outlined.
Conclusion
To conclude, the WAVES price should break down from the short-term parallel channel and the long-term parabolic support line afterwards.
It is possibly heading towards $6.10 and $5.77, in what could be an extended correction.
A daily close above $8.60 would invalidate this possibility and suggest that WAVES is heading towards yet a new yearly high instead.
For BeInCrypto’s latest BNB analysis, click here!
Disclaimer: Cryptocurrency trading carries a high level of risk and may not be suitable for all investors. The views expressed in this article do not reflect those of BeInCrypto.


