
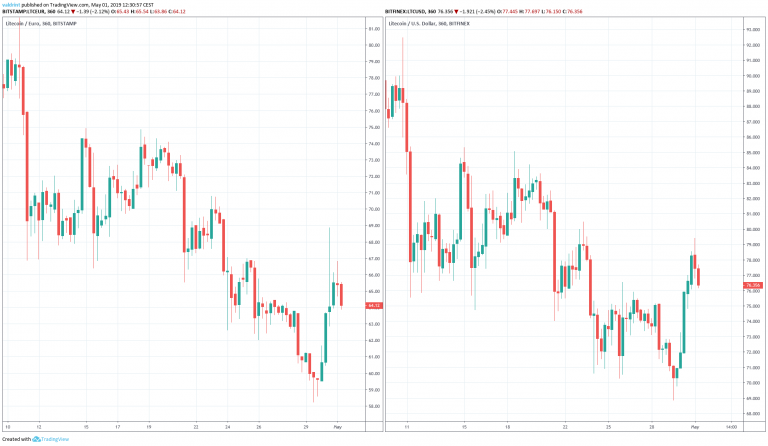
On Apr 11, 2019, the price of Litecoin reached an hourly high of $88.47 and €78.73.
Since then, Litecoin has experienced steady, gradual price losses. Lows of $68.8 and €58.2 were reached on Apr 29
Will Litecoin keep decreasing or will a reversal start an uptrend?
Let’s find out!
Litecoin (LTC): Trends And Highlights For May 1, 2019
- Both LTC/USD and LTC/EUR have been on a downtrend since Apr 11.
- LTC was trading inside a descending wedge.
- It broke out on Apr 30.
- The breakout occurred on below-average volume.
- There is resistance near $81/€70 and support near $74/€62.5.
Horizontal Channel
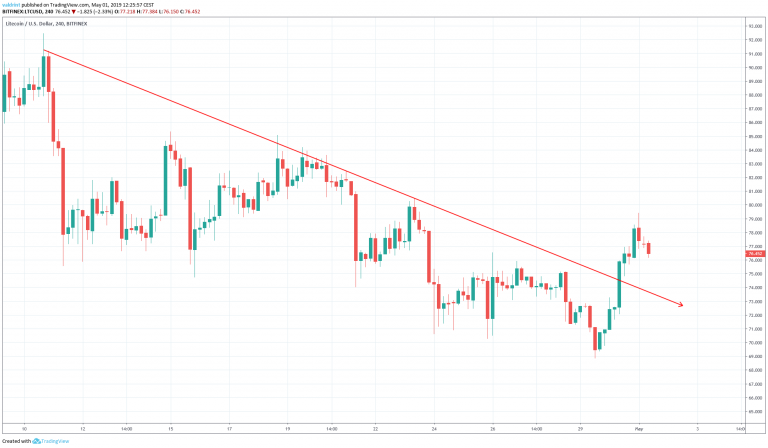
On Apr 11, the price reached a high of $78.73. Several market cycles have been completed. The price has reached lower highs each time.
Tracing these highs gives us a descending resistance line:
On Apr 11, the price reached a low of $66.84. A gradual increase was followed by a gradual decrease. After every cycle, the price has created lower lows. Tracing these lows gives us a descending support line.
The support and resistance lines combine to create a descending wedge:
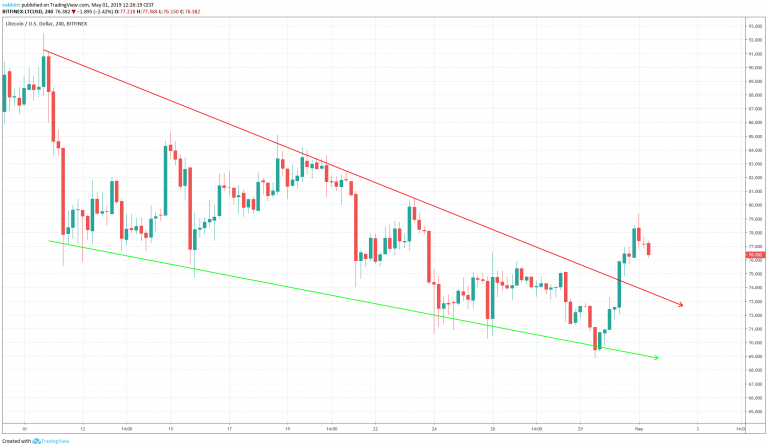
The price broke out from the wedge on Apr 30. In order to test the validity of the breakout and future price movement, we need to take a look at technical indicators.
Technical Indicators
We begin by analyzing volume alongside the price of Litecoin.
Both price and volume are shown in the graph below:
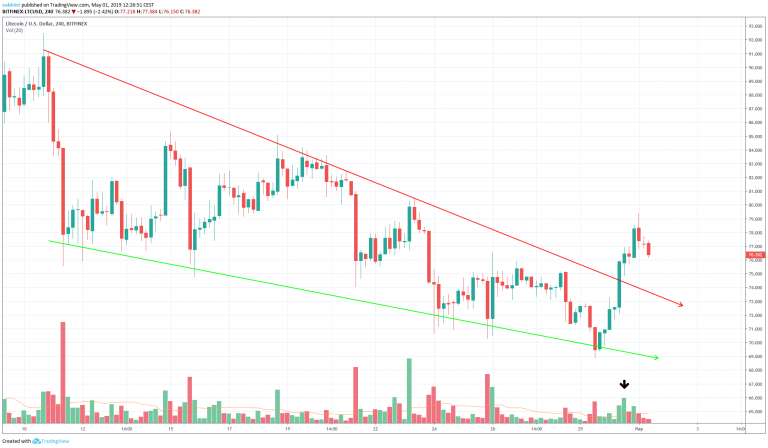
The breakout occurred with slightly above average volume. However, multiple candles during the period in which LTC traded inside the wedge were trading with above-average volume.
The use of this indicator combined with previous price movement suggests that the price will decrease and reach one of the support areas outlined in the next section.
Future Movement
To better determine actual future price levels, we examine resistance and support areas.
One resistance and one support area is shown for LTC/USD in the first graph and another for LTC/EUR in the second graph:
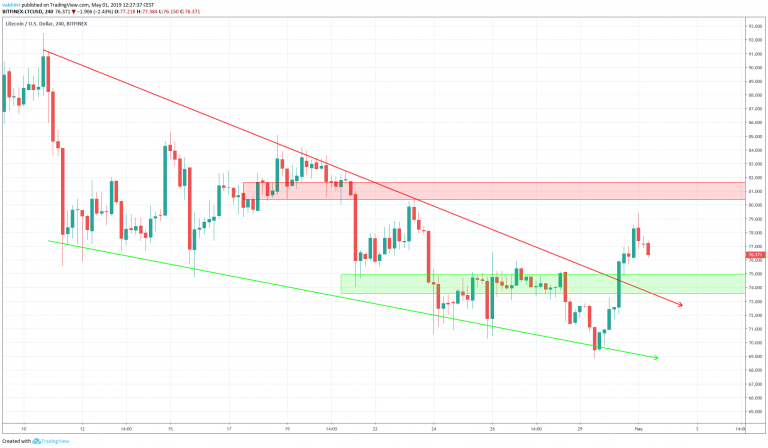
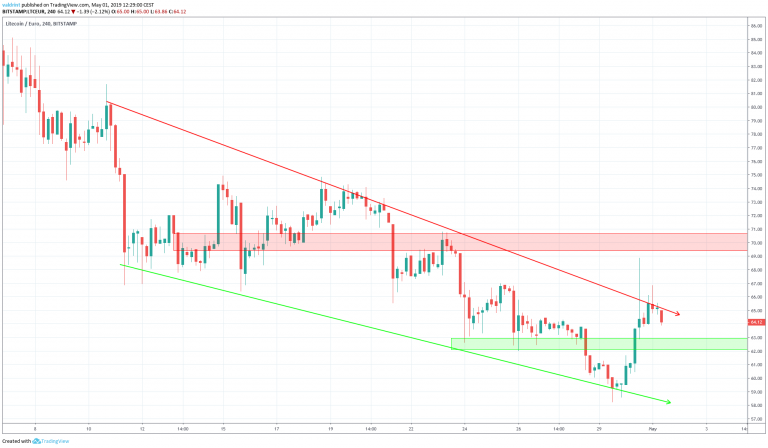
The closest support area is found near $74/€62.5. we believe that the price will eventually reach this area.
The closest resistance area is found near $81/€70. We do not believe the price will increase towards this area. However, if it does, we believe it will act as a ceiling to price. Therefore, we believe a breakout above this area to be very unlikely.
Summary Of Analysis
Based on this analysis, it is likely that the price will decrease towards the support area we have outlined above. However, if it begins to increase, we believe it will make a top near $81/€70. Afterward, it is likely to continue its decrease towards the support area at $74/€62.5. Do you think the price of LTC will reach the support area? Let us know in the comments below.
If you’re interested in 2019 and 2020 price predictions for Litecoin in dollars, click on the blue button below
Disclaimer: This article is not trading advice and should not be construed as such. Always consult a trained financial professional before investing in cryptocurrencies, as the market is particularly volatile.
