


VeChain (VET) has been increasing since July 20 but has failed to move above the $0.142 horizontal resistance area.
The token has broken down from a short-term ascending support line and is currently attempting to find support.
VET attempts to break out
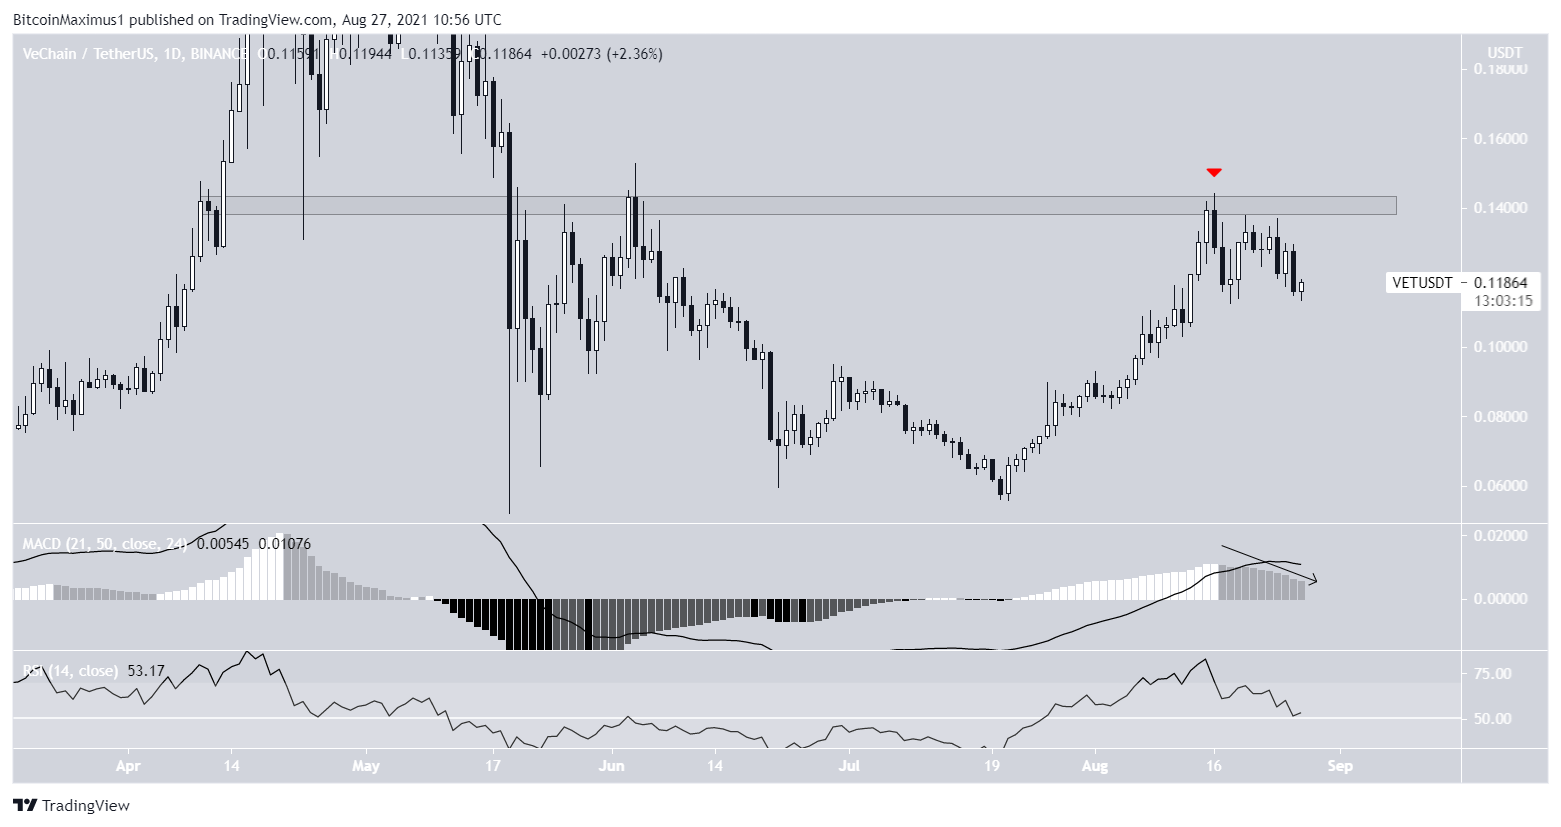
VET has been moving upwards since July 20, when it reached a low of $0.056. The upward movement continued until Aug. 16, then the token managed to reach a high of $0.144.
However, it failed to break out and was rejected by the $0.142 resistance area instead. As a result it has been moving downwards since.
Furthermore, the MACD has given a bearish reversal signal and the RSI is decreasing, even though it is still above 50.
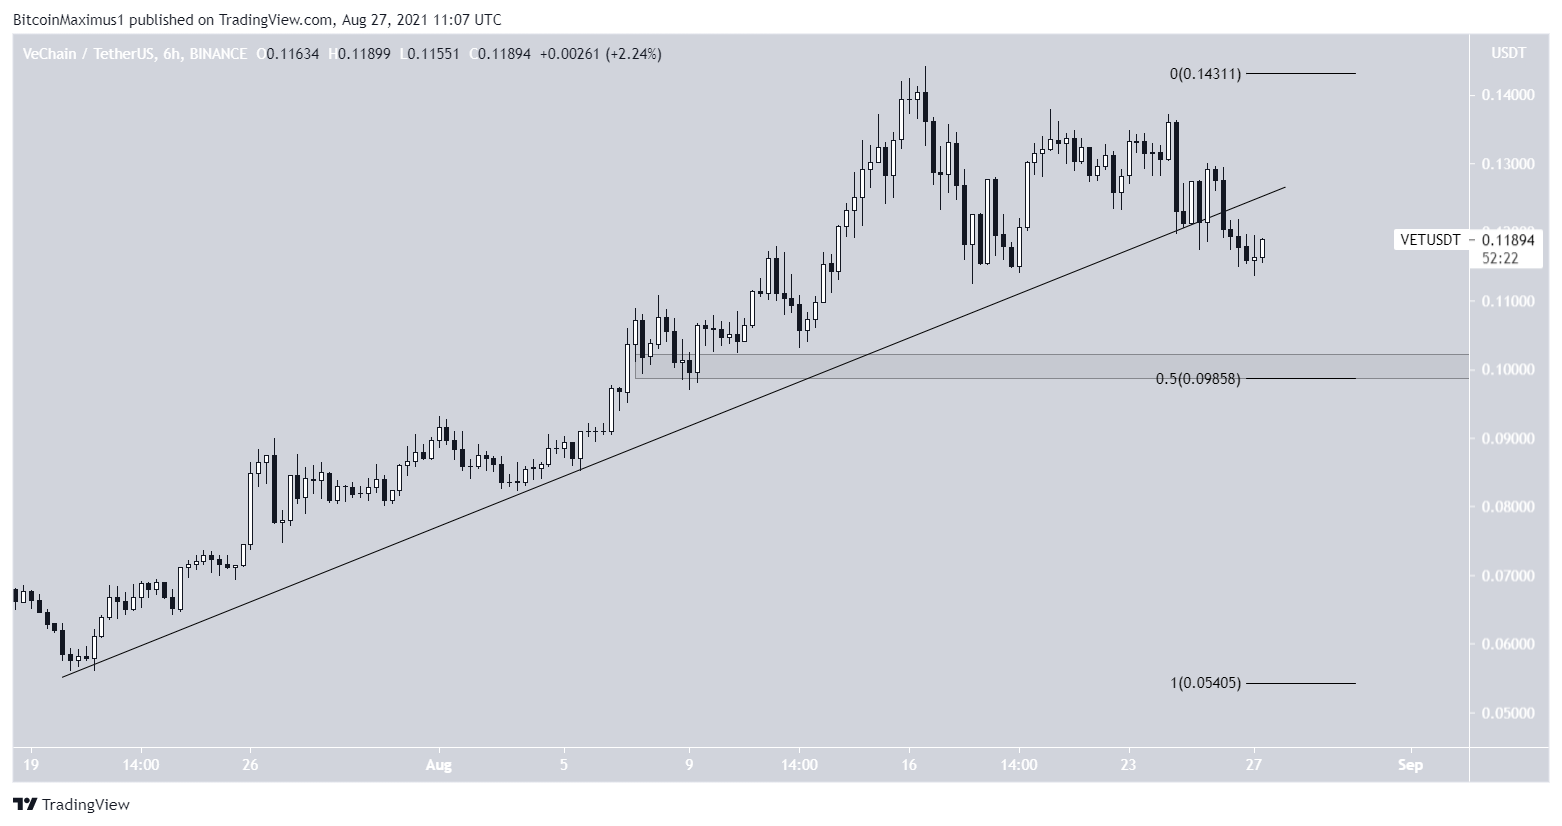
The shorter-term six-hour chart shows that VET has broken down from an ascending support line that had been in place since July 20. This could be a sign that the short-term upward movement has ended.
If so, VET would be expected to decrease towards the closest support area at $0.1. This is the 0.5 Fib retracement support level and a horizontal support area.
Wave count
Cryptocurrency trader @24KCrypto outlined a VET chart, stating that the token has completed wave four and has now begun the fifth and final wave towards a new all-time high price.
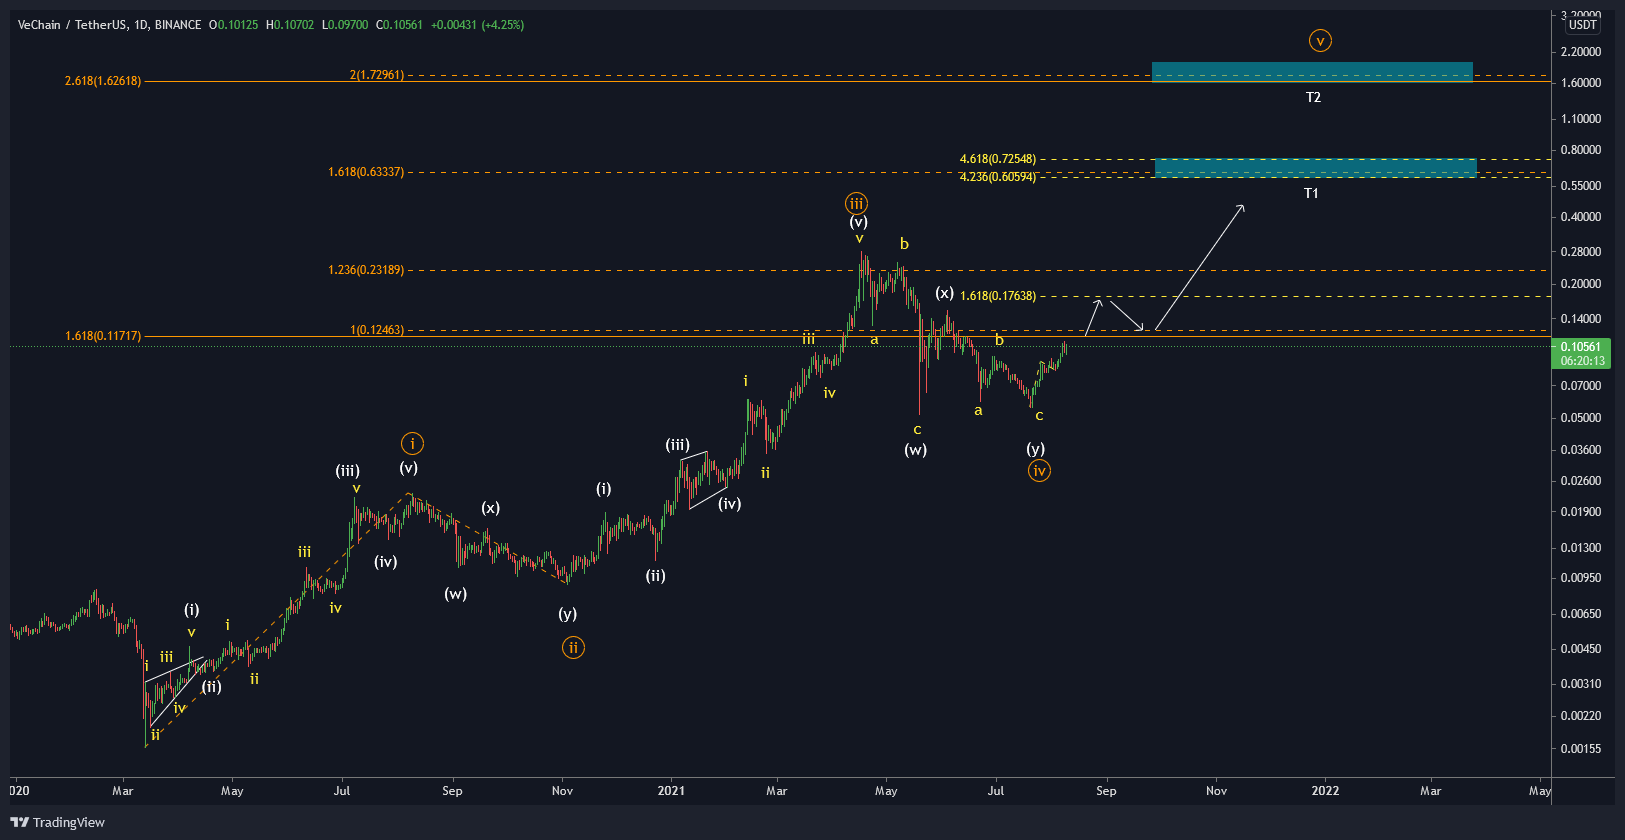
Due to the fact that the 2-4 trendline has not been broken, the count seems to be legitimate. If correct, VET has completed a fourth wave pullback.
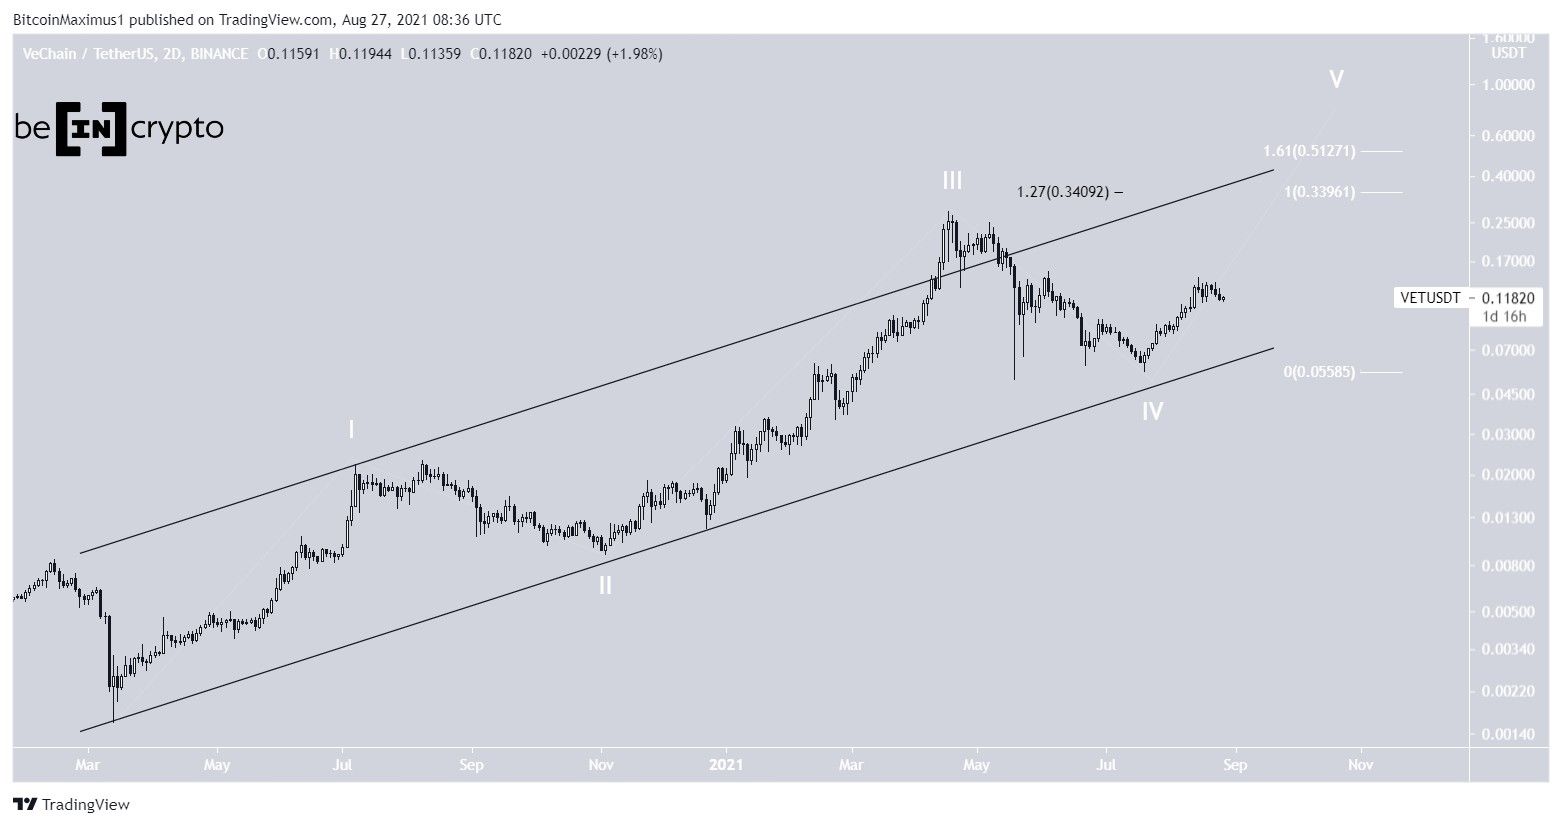
In the long-term, the two most likely targets for the top of wave five are at $0.34 and $0.53. The former is the projection of the length of waves 1-3 to the bottom of wave four (white), and using an external retracement on the same wave four (black). The latter is the 1.61 length of waves 1-3.
A decrease below the July 20 low of $0.0056 would invalidate this particular wave count.
For BeInCrypto’s latest Bitcoin (BTC) analysis, click here.
