
The Vechain (VET) price has been increasing rapidly since July 1. While a short-term retracement seems likely, VET is not yet done with its upward move.
Long-Term Movement
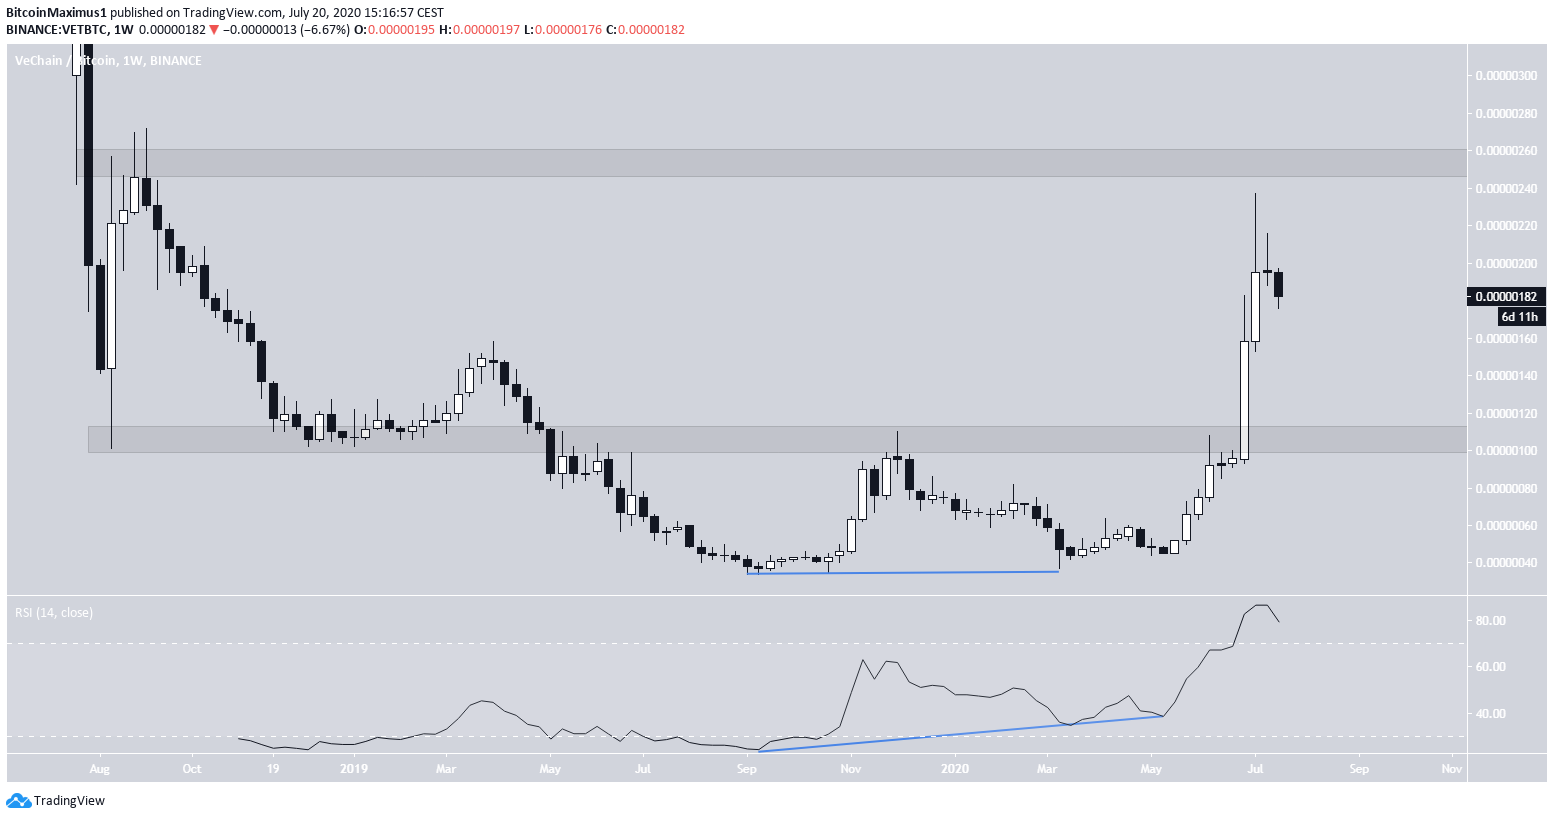
The VET price reached a low of 37 satoshis on March 13 to complete a double-bottom, which is strengthened by significant bullish divergence on the weekly RSI.
Once the price broke out from the 105 satoshi resistance area, it continued to rally at a parabolic pace. This same area should now act as support. The closest resistance area is found at 255 satoshis. The price has yet to reach it, even though it came close with a long upper-wick.
While the weekly RSI is overbought, it has yet to form any type of bearish divergence, so it’s possible that the upward move will continue.
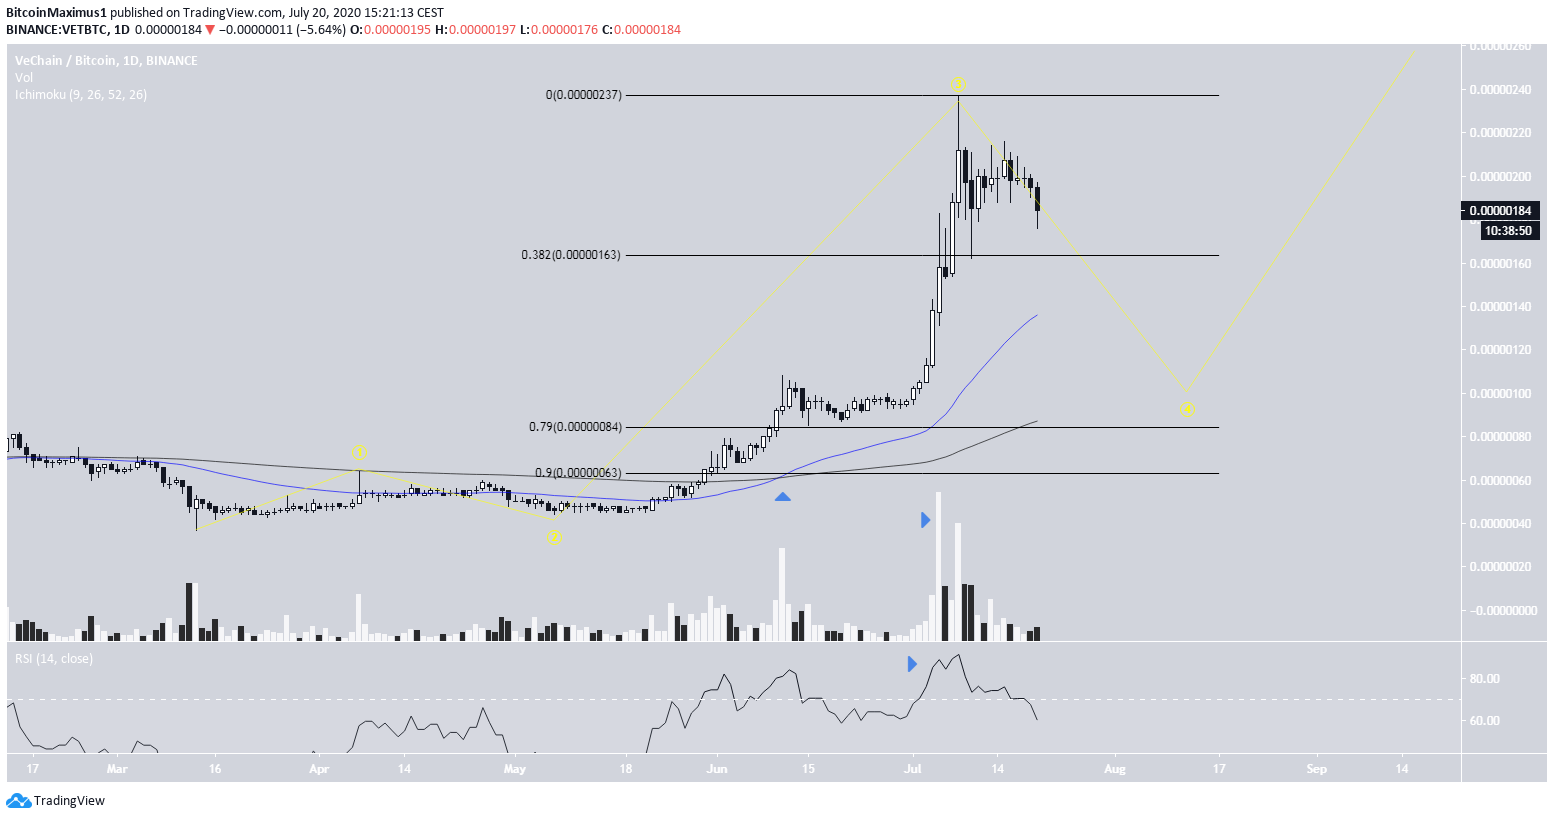
The daily chart reveals that a bullish cross has taken place between the 50 and 200-day moving averages (MA), a sign that a bullish trend has begun. However, the price is overextended and trades considerably above both the MAs, so a retracement is due.
While the price action resembles a five-wave Elliott formation, technical indicators suggest that it’s more likely an extended third wave. Volume has been increasing throughout the upward move, and there is no bearish divergence on the daily RSI.
Both of these are signs of a fifth wave which is not currently present in VET. Therefore, after a retracement, which could reach a bottom anywhere between 85 – 155 satoshis, the price could initiate another upward move and reach the previously mentioned 255 satoshi resistance area.
Current Decline
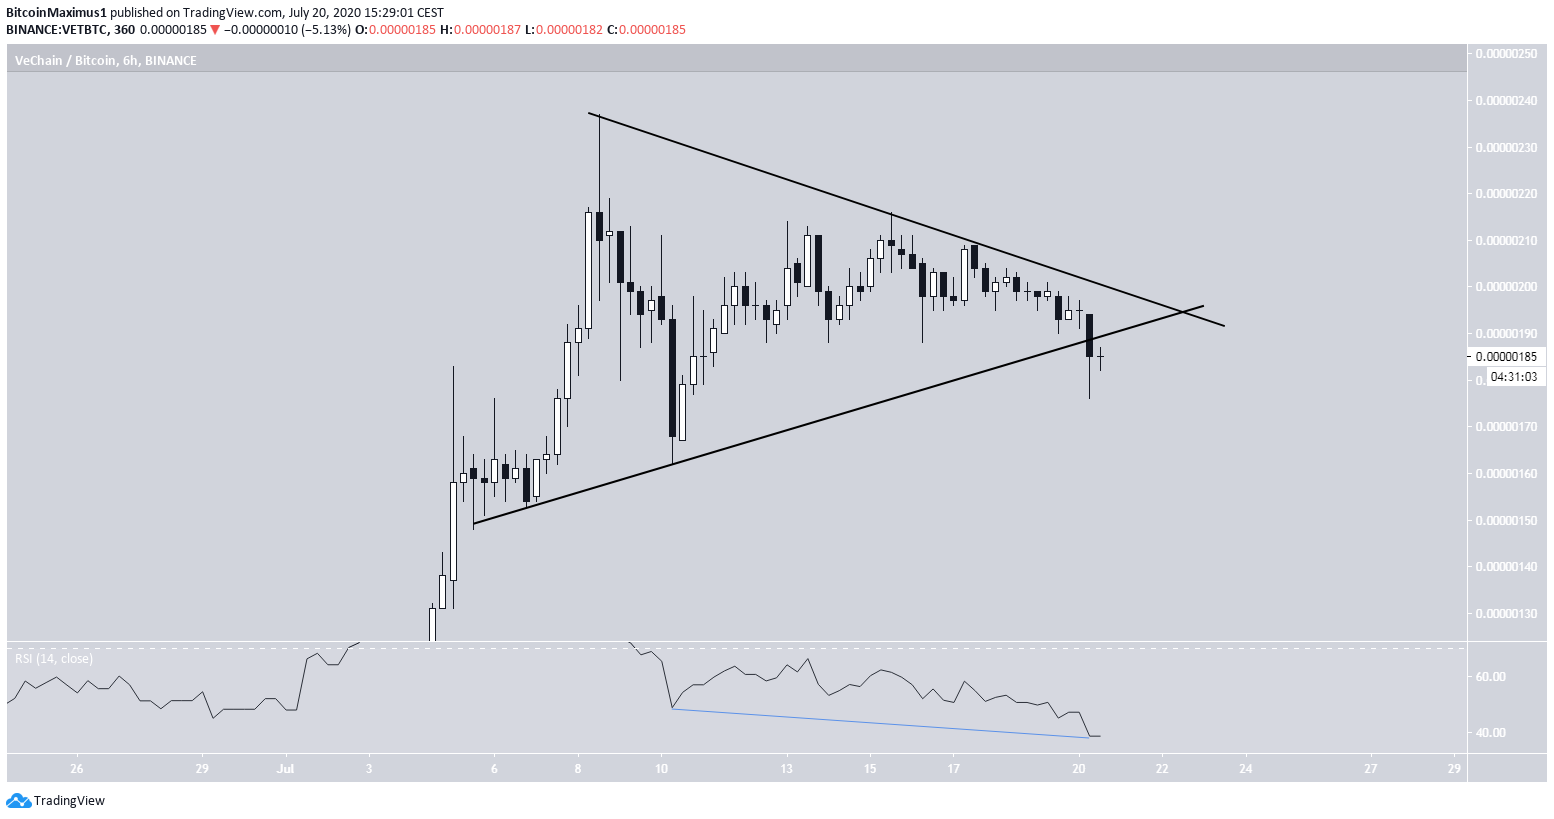
A closer look at the VET price shows that a symmetrical triangle has been in place since July 8. At the time of writing, however, VET had just broken down from this pattern.
There is hidden bullish divergence developing on the RSI, so VET could soon find support and initiate a reversal.
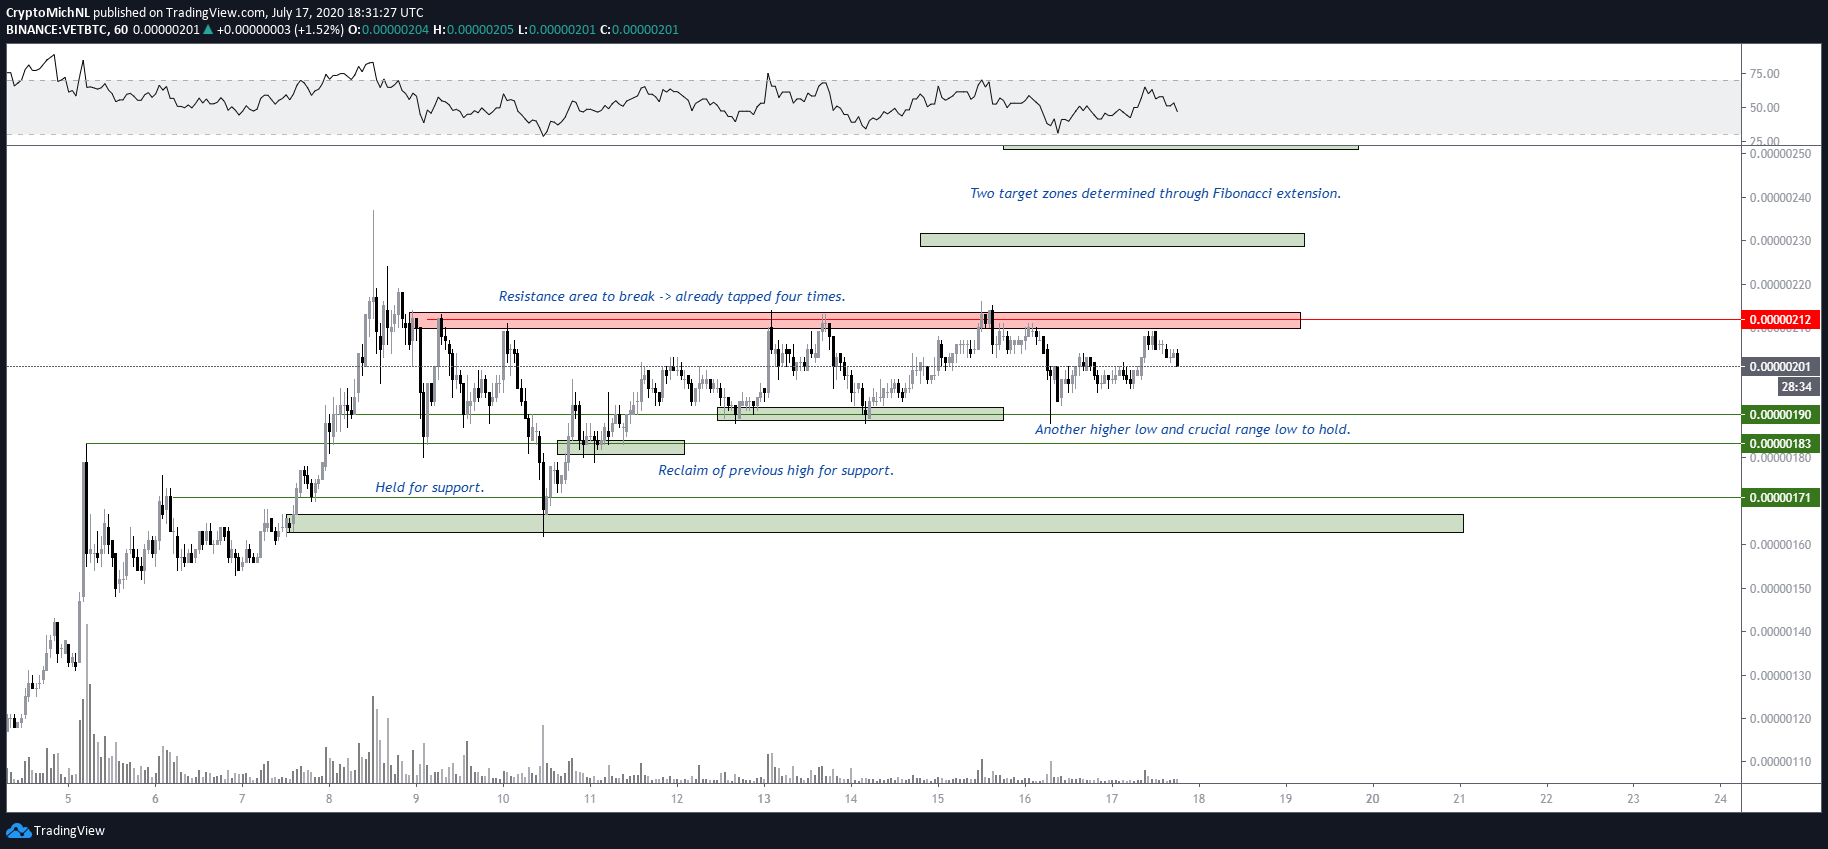
Cryptocurrency trader @CryptoMichNL outlined a VET chart, stating that if the price manages to create another higher-low, it should break out above the current resistance area, targeting 230 sats.
However, as we saw in the previous image, the price has already broken down, so it may find support near 165 satoshis.
VET Wave Count
Since the July 8 local high, VET has been correcting inside an A-B-C formation. At the time of writing, the price seemed to be completing the C wave, which could end near 140 satoshis, based on the length of the A wave.
The increased volume during the recent decline, which also caused a breakdown from the symmetrical triangle, is a sign that the price is still correcting.
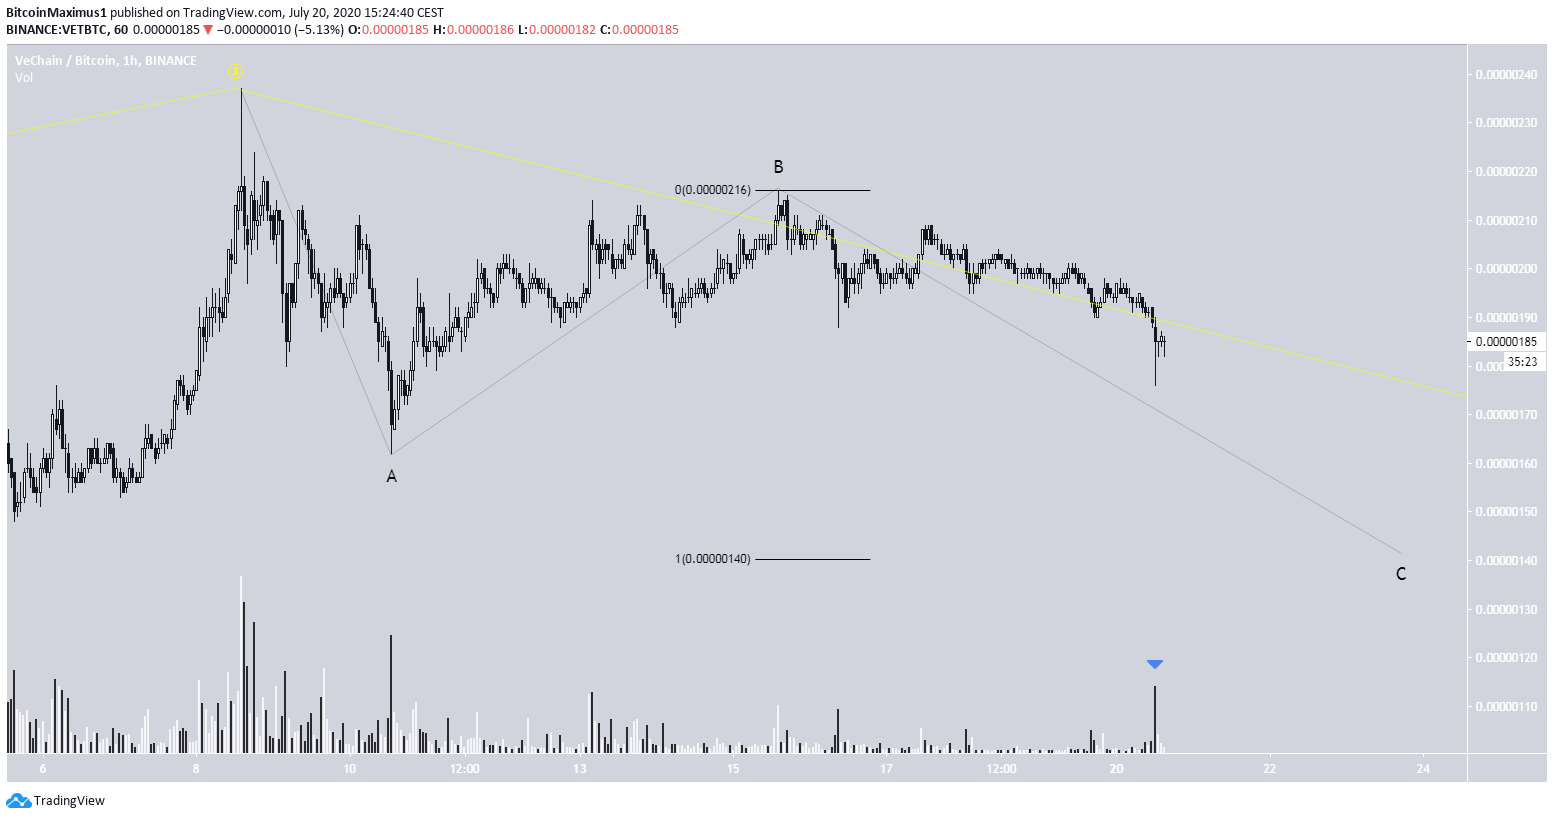
To conclude, the VET price has been retracing since reaching a high on July 8. The retracement should end near 140 satoshis, after which VET could continue increasing towards the resistance area outlined above.
