VeChain (VET) has reached a confluence of support levels that are suitable for a bottom. However, there are no bullish reversal signs in place yet.
VeChain Price Prediction: Potential Trend Reversal | Coin of The Week – YouTube
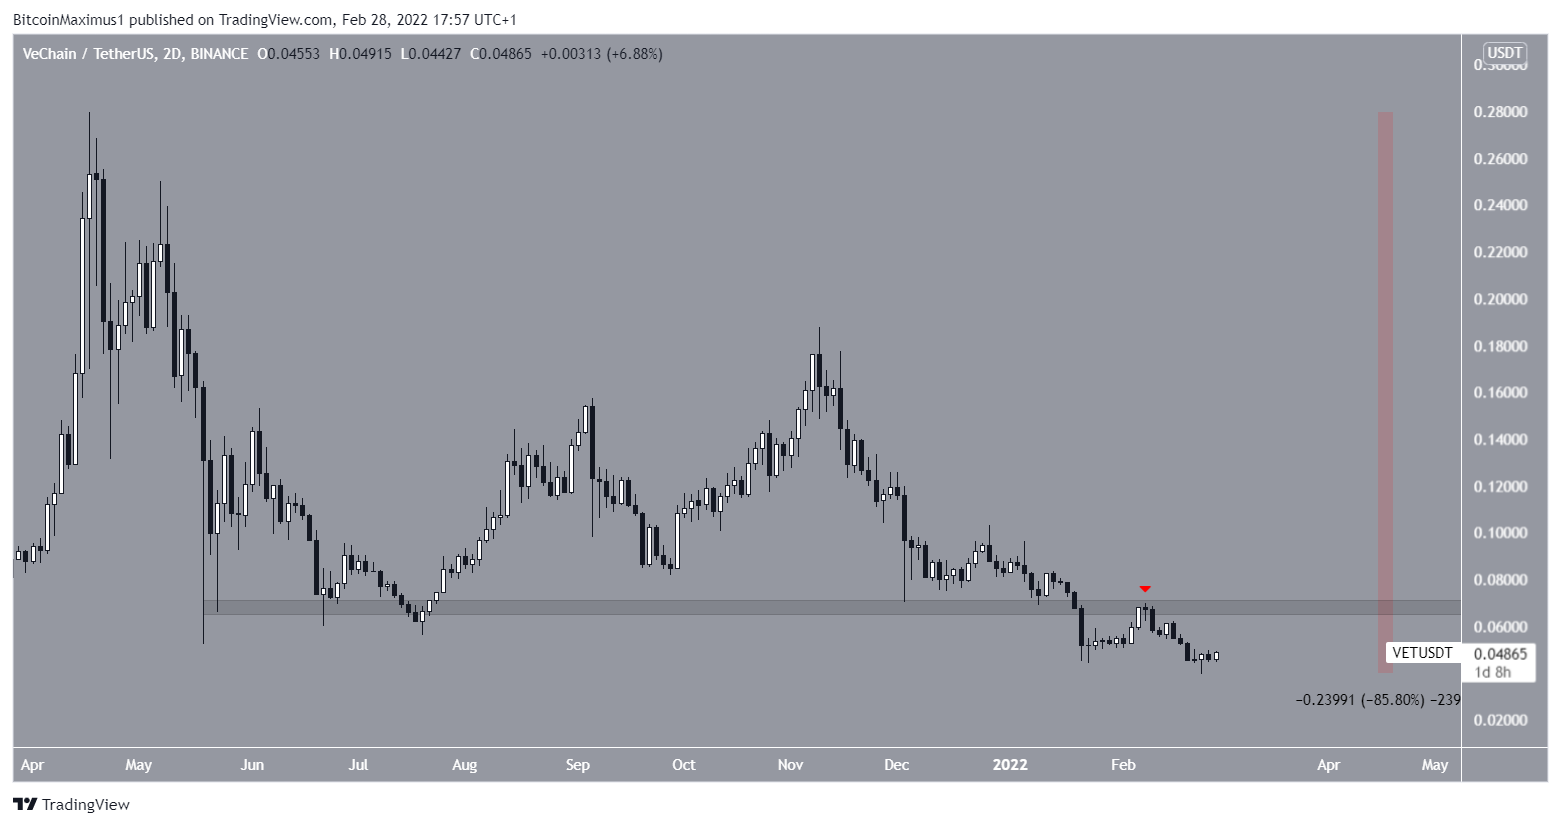
VET has been falling since reaching an all-time high price of $0.279 on April 17. The downward movement led to a low of $0.039 on Feb 24. Measuring from the all-time high, this amounted to a decrease of 86%.
While the price has bounced slightly since then, it is still trading well below the $0.068 resistance area. The level had previously acted as support since May 21, prior to the Jan 2022 breakdown, and afterward turned to resistance (red icon).
Until this level is reclaimed, the trend cannot be considered bullish.
VET develops bullish divergences
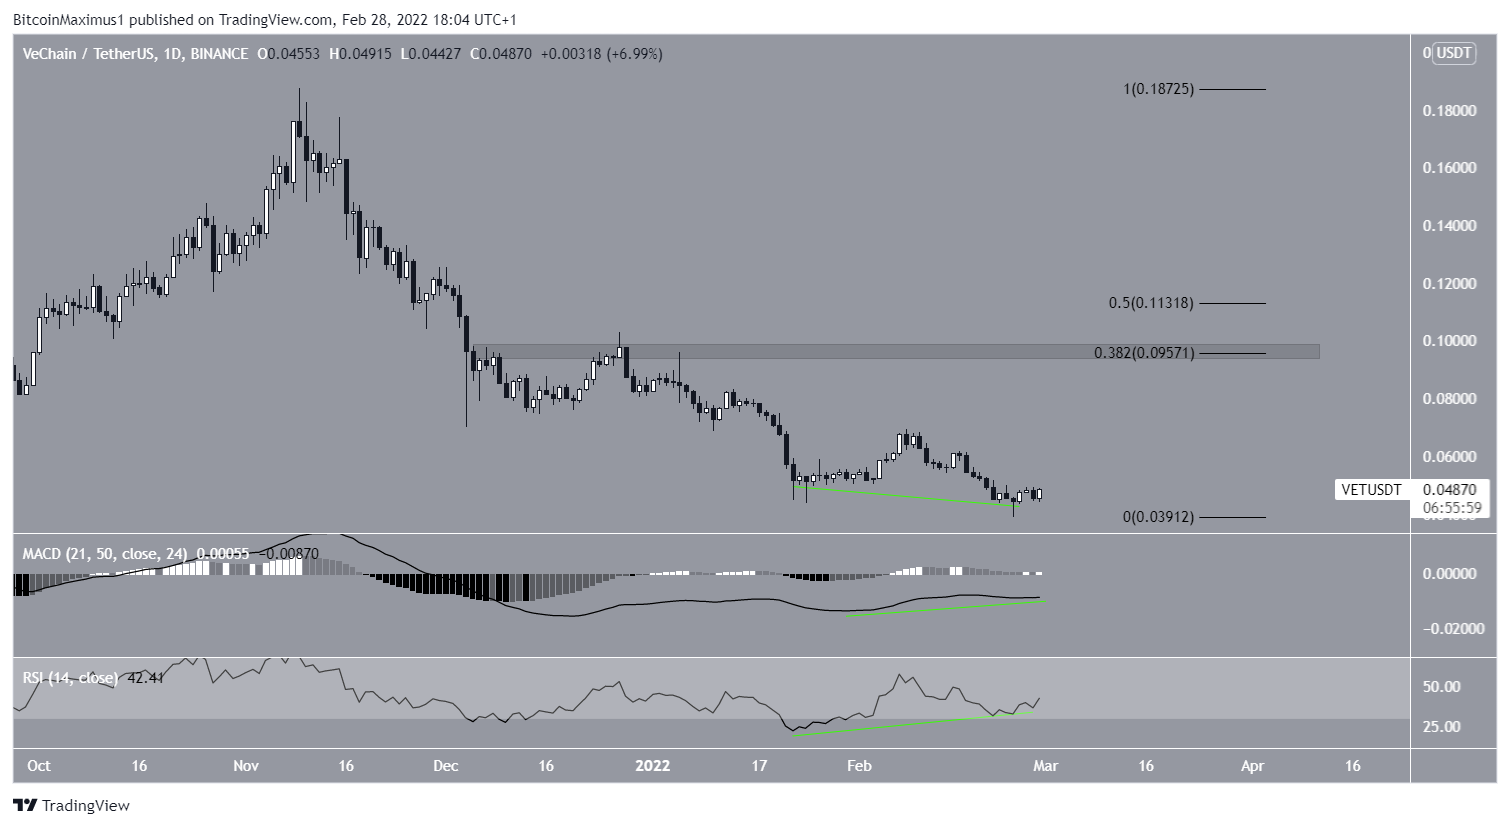
The daily chart provides a relatively bullish outlook. The main reason for this is the considerable bullish divergence that has developed in both the RSI and MACD (green lines). Such significant bullish divergences very often precede bullish trend reversal.
In the case of the RSI, which is a momentum indicator, the RSI developed after the indicator reached the lowest value since the March 2020 crash.
If an upward movement begins, the closest resistance area would be at $0.095. This is the 0.382 Fib retracement resistance level and a horizontal resistance area.
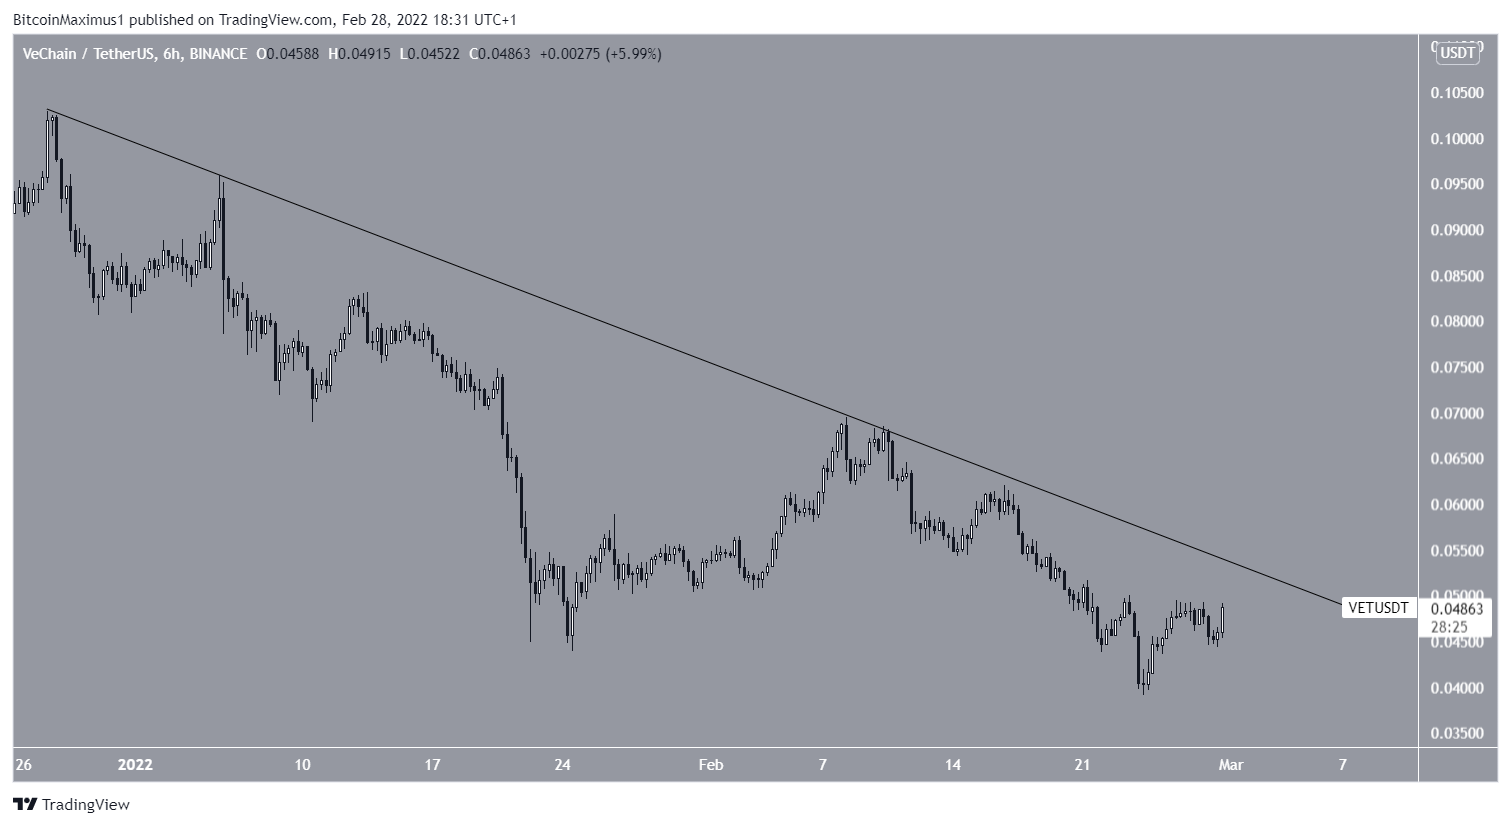
The six-hour chart shows that VET is following a descending resistance line that has been in place since Dec 27.
A breakout from it would go a long way in confirming that the upward movement as a result of the bullish divergences has begun.
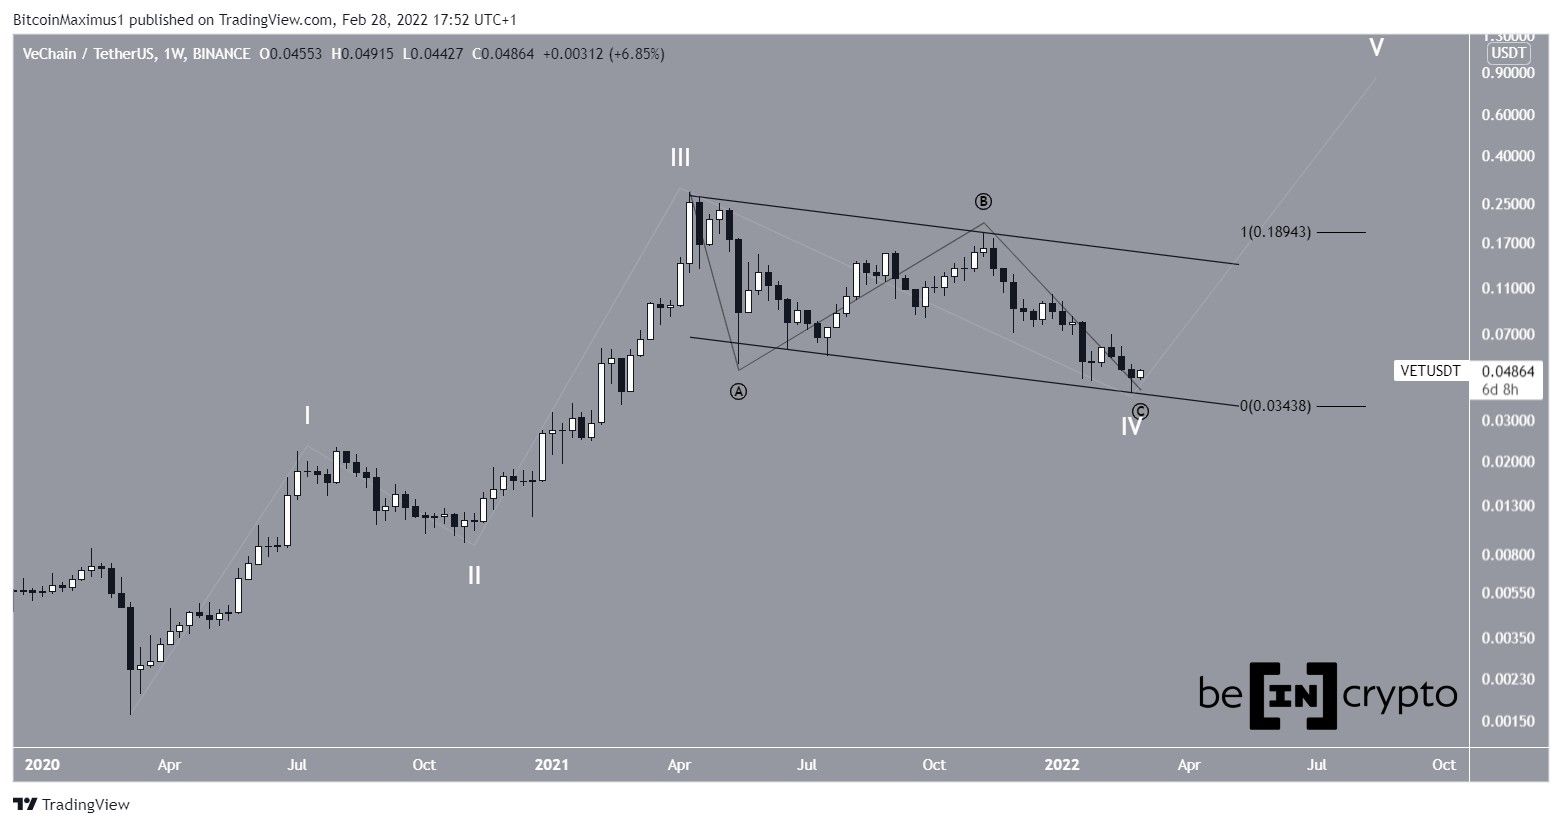
Wave count analysis
Cryptocurrency trader @Crypto618 tweeted a chart of VET, stating that the decrease is contained in a channel and could be part of a correction.
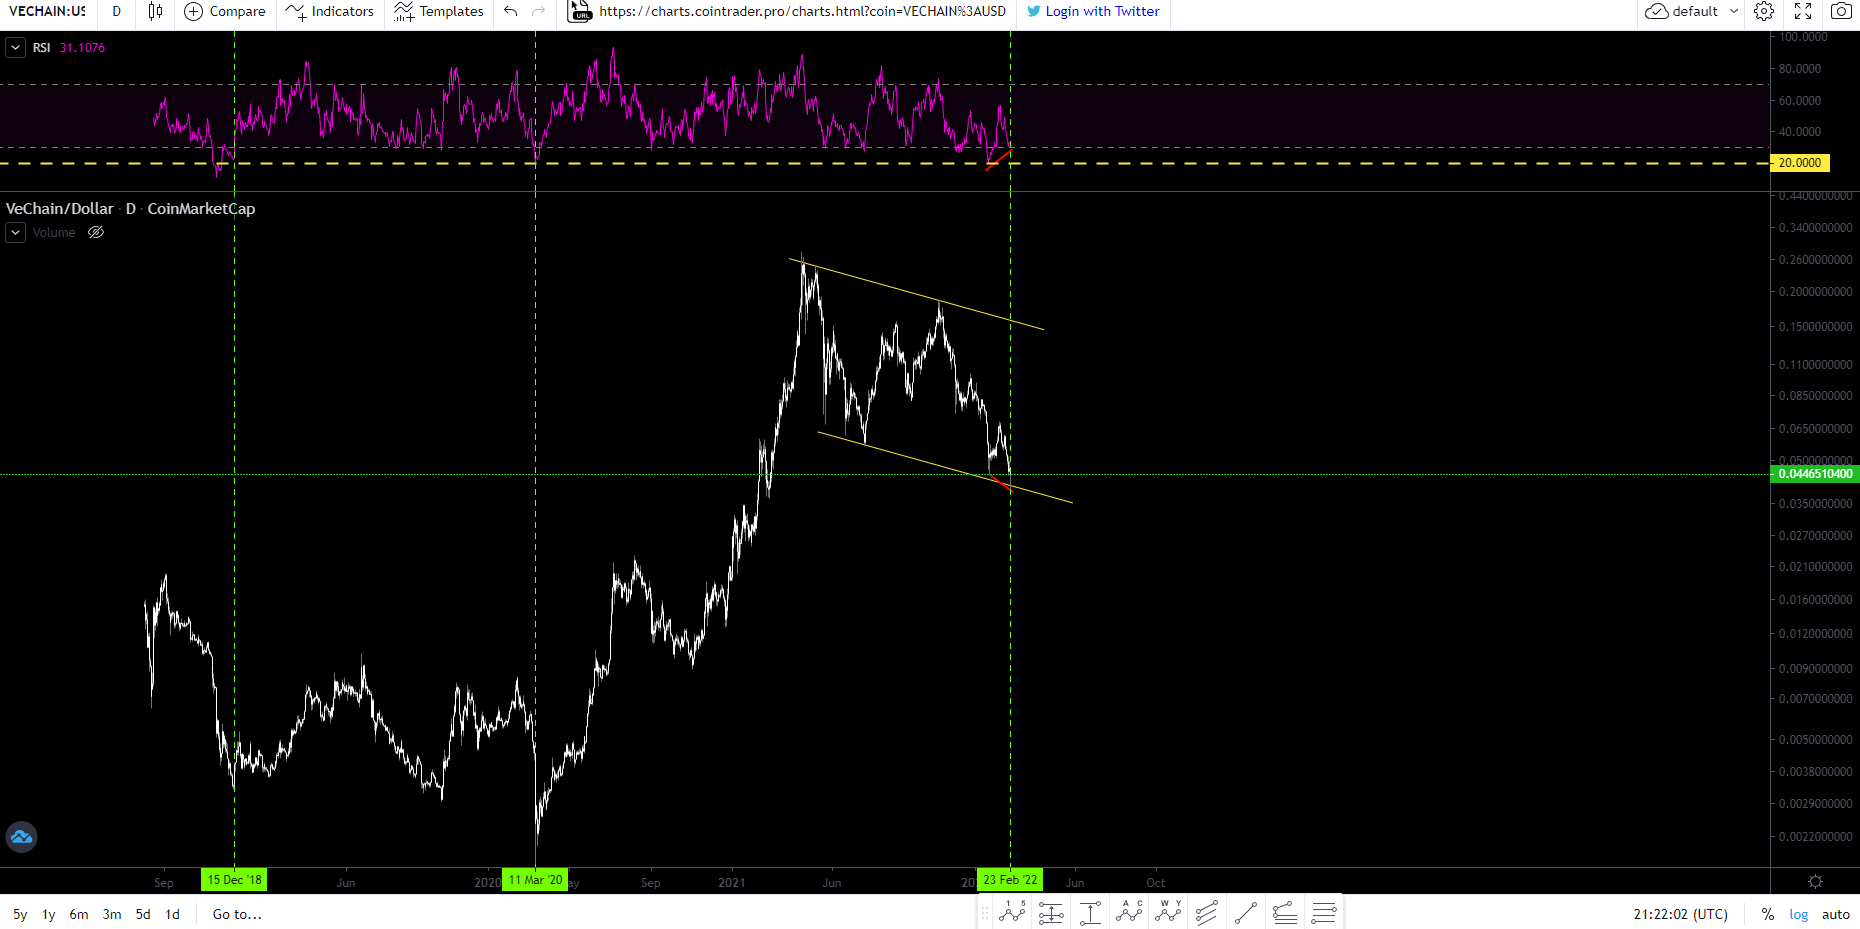
The channel is clearly visible in the logarithmic chart, but does not correspond to the regular one.
If the decrease has taken the shape of an A-B-C corrective structure (black), then waves A:C had a nearly 1:1 ratio, which is the most common one in such corrections.
Therefore, when combined with the channel, it supports the possibility that a low has been reached.
As for the longer-term movement, the most likely count suggests that VET has just completed wave four of a five-wave upward movement (white), which began in March 2020.
If correct, the price would gradually increase towards a new all-time high price.