


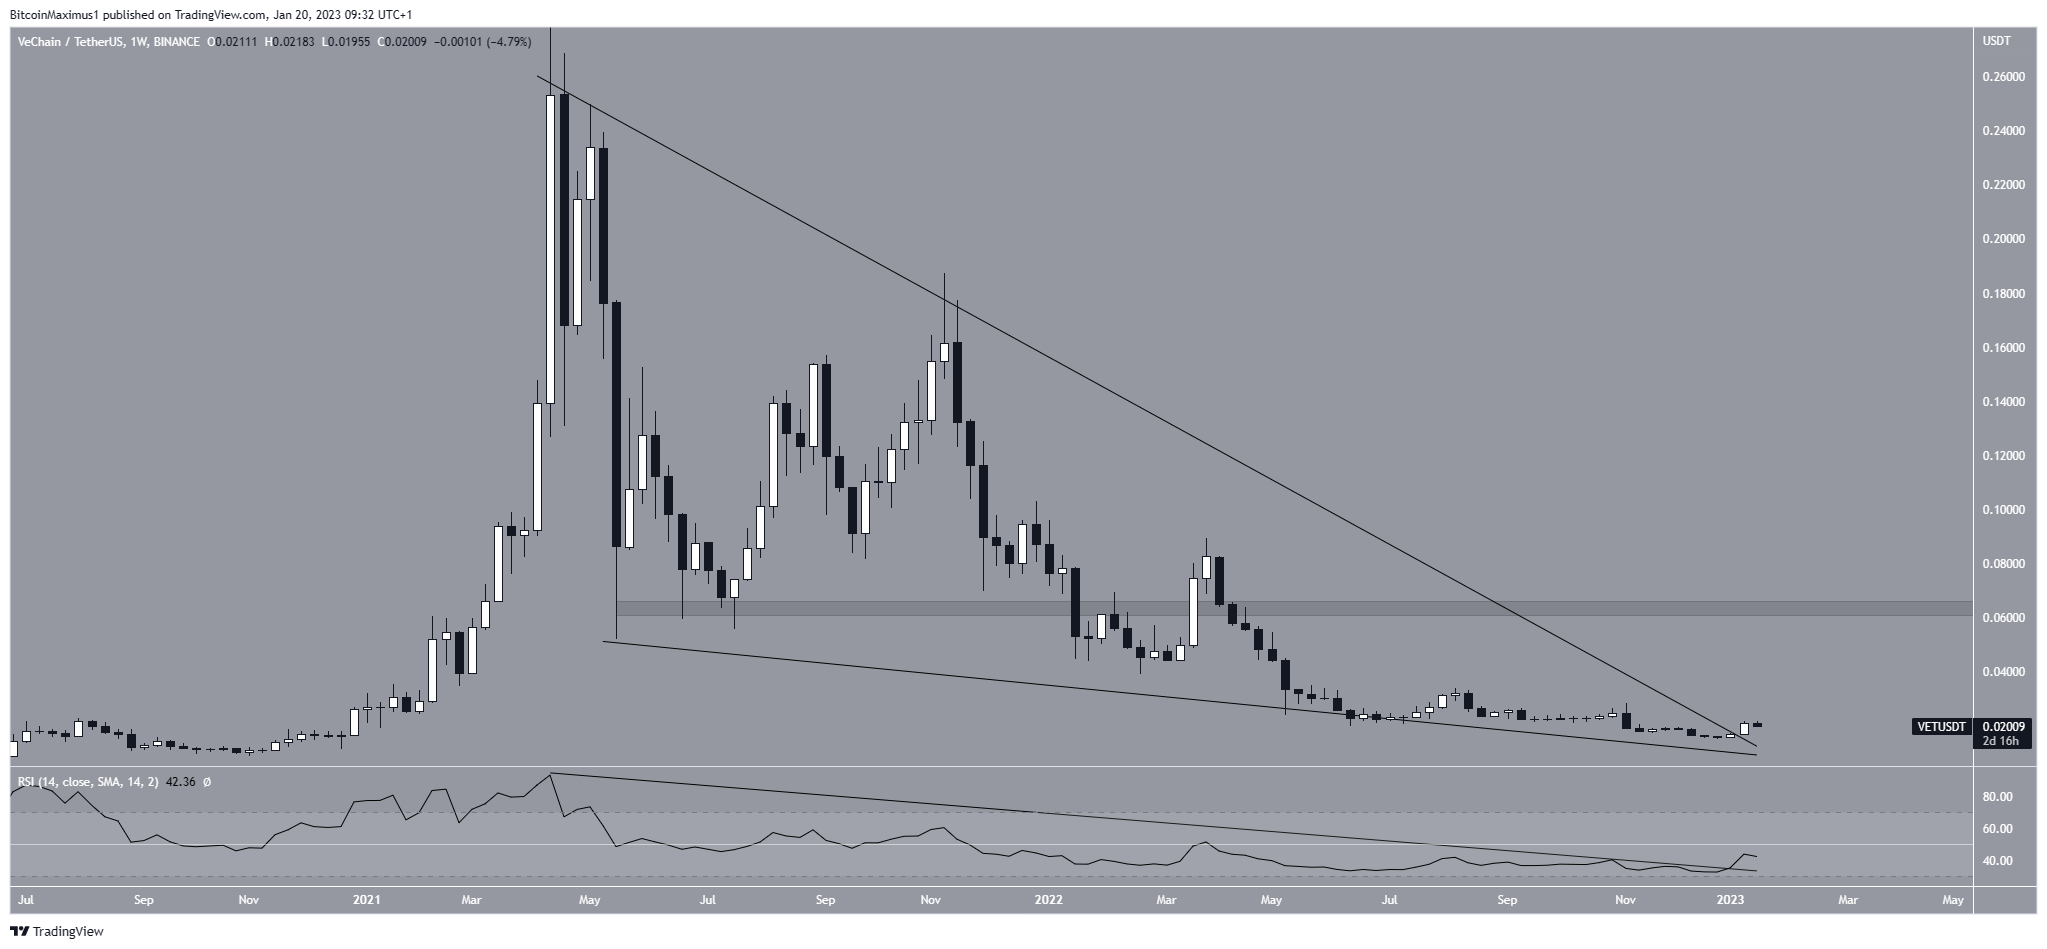
VeChain (VET) broke out from a lengthy descending wedge after increasing 22% last week. This is a strong sign of a long-term bottom.
The price of VET has been declining since reaching an all-time high of $0.2793 in April 2021. A falling wedge, which is viewed as a bullish pattern, had contained the downward movement.
In June 2022, the price fell to a low of $0.0200 before it came back and started moving up again. After creating a slightly lower low in Dec., the price began another upward movement.
VET broke out from the descending wedge during the second week of this month. While the exact slope of the line is difficult to pinpoint due to multiple extended upper wicks, it seems that the price has now broken out.
Given that the wedge has been in place for 370 days, there would probably be a sizable upward movement if this were the case.
The possibility of an increase is supported by the weekly RSI, which broke out from its own descending resistance line. If the upward movement continues, the closest resistance area would be at $0.063. This is a long-term area that previously provided support. Moving above it would confirm that the bullish reversal is in place. From the current price, the area is more than 200% away.
VeChain Price Moves Toward Resistance Line
The technical analysis forecast is undecided on the daily chart. VET faces resistance from a confluence of levels at $0.0215, created by a descending resistance line and the $0.0215 resistance area.
The level caused a rejection (red icon) on Jan. 17 and began the current downward movement for VET. Moreover, this caused the daily RSI to fall below 70.
A breakout from the descending resistance line and $0.0215 area would confirm the bullish readings from the weekly chart. In this case, an increase toward $0.063 would be expected.
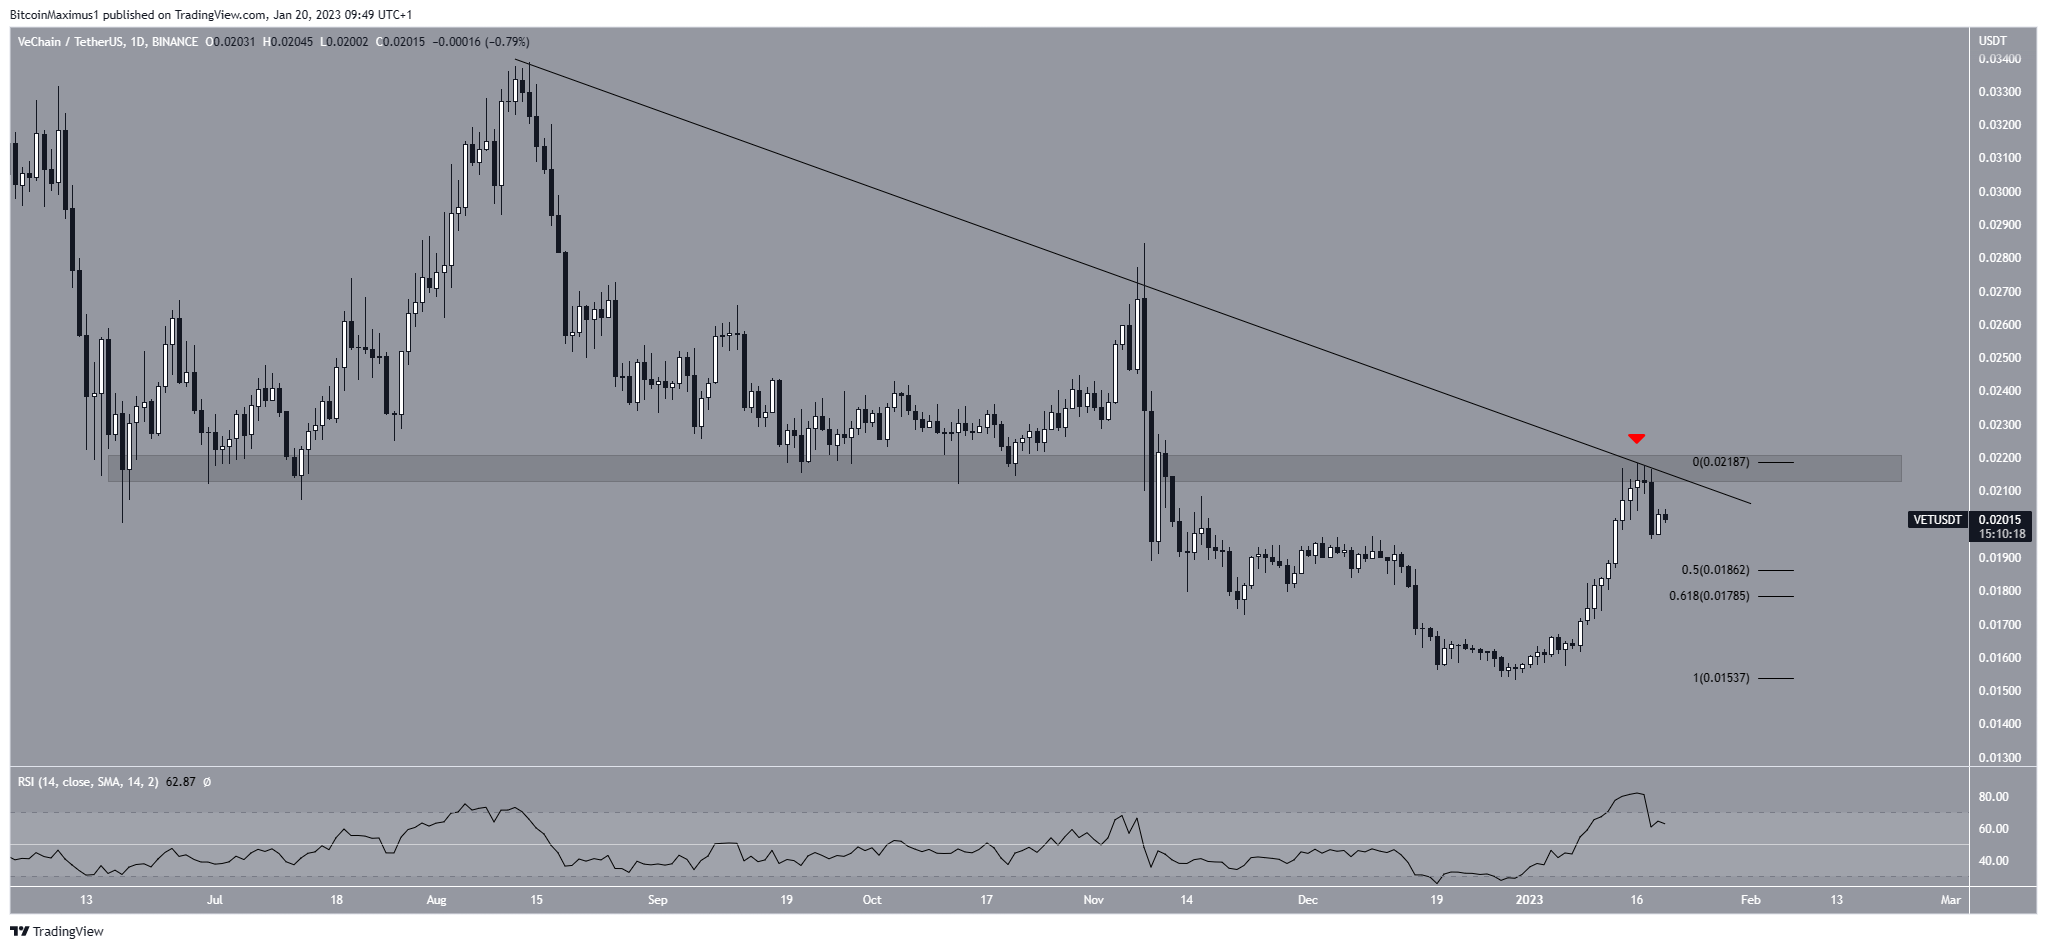
To conclude, the most likely VeChain price forecast is an increase toward the long-term resistance area at $0.062. A breakout from the short-term descending resistance line would confirm this possibility. On the other hand, a rejection from the line could lead to a fall toward $0.0186-$0.0178.
For BeInCrypto’s latest crypto market analysis, click here.


