
The Altcoin Index (ALTPERP) is trading between support and resistance at $2820 and $4780.
The DeFi Index (DEFIPERP) is following a long-term ascending support line and has reclaimed the $1700 support area.
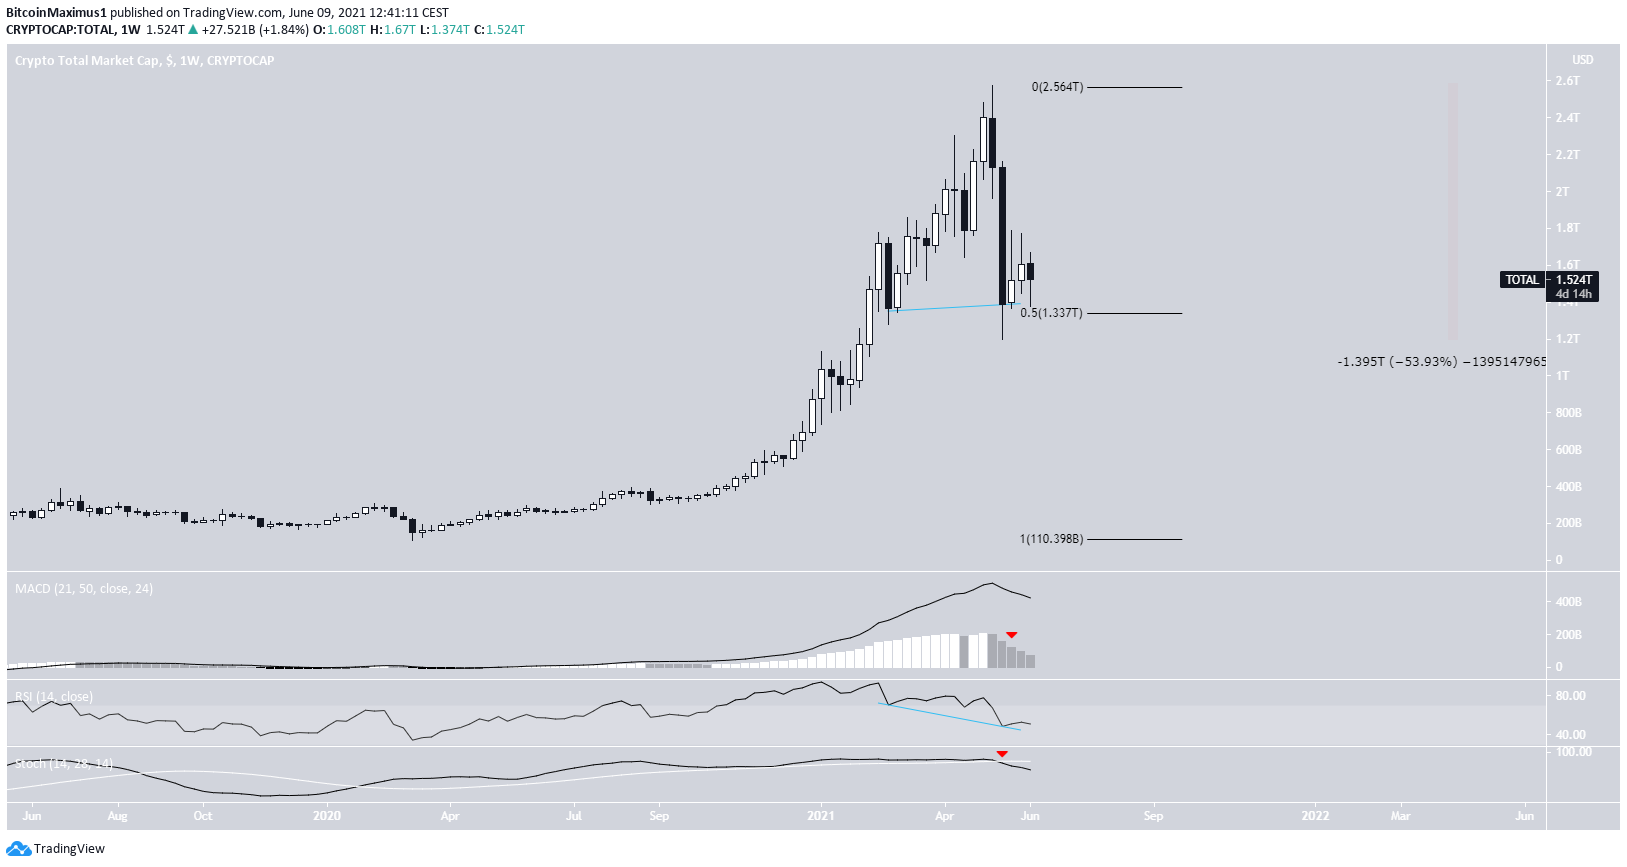
The Crypto Total Market Cap (CRYPTOCAP) has bounced at the $1.33 Trillion support area. It is now trading inside a short-term descending parallel channel.
Altcoin Index
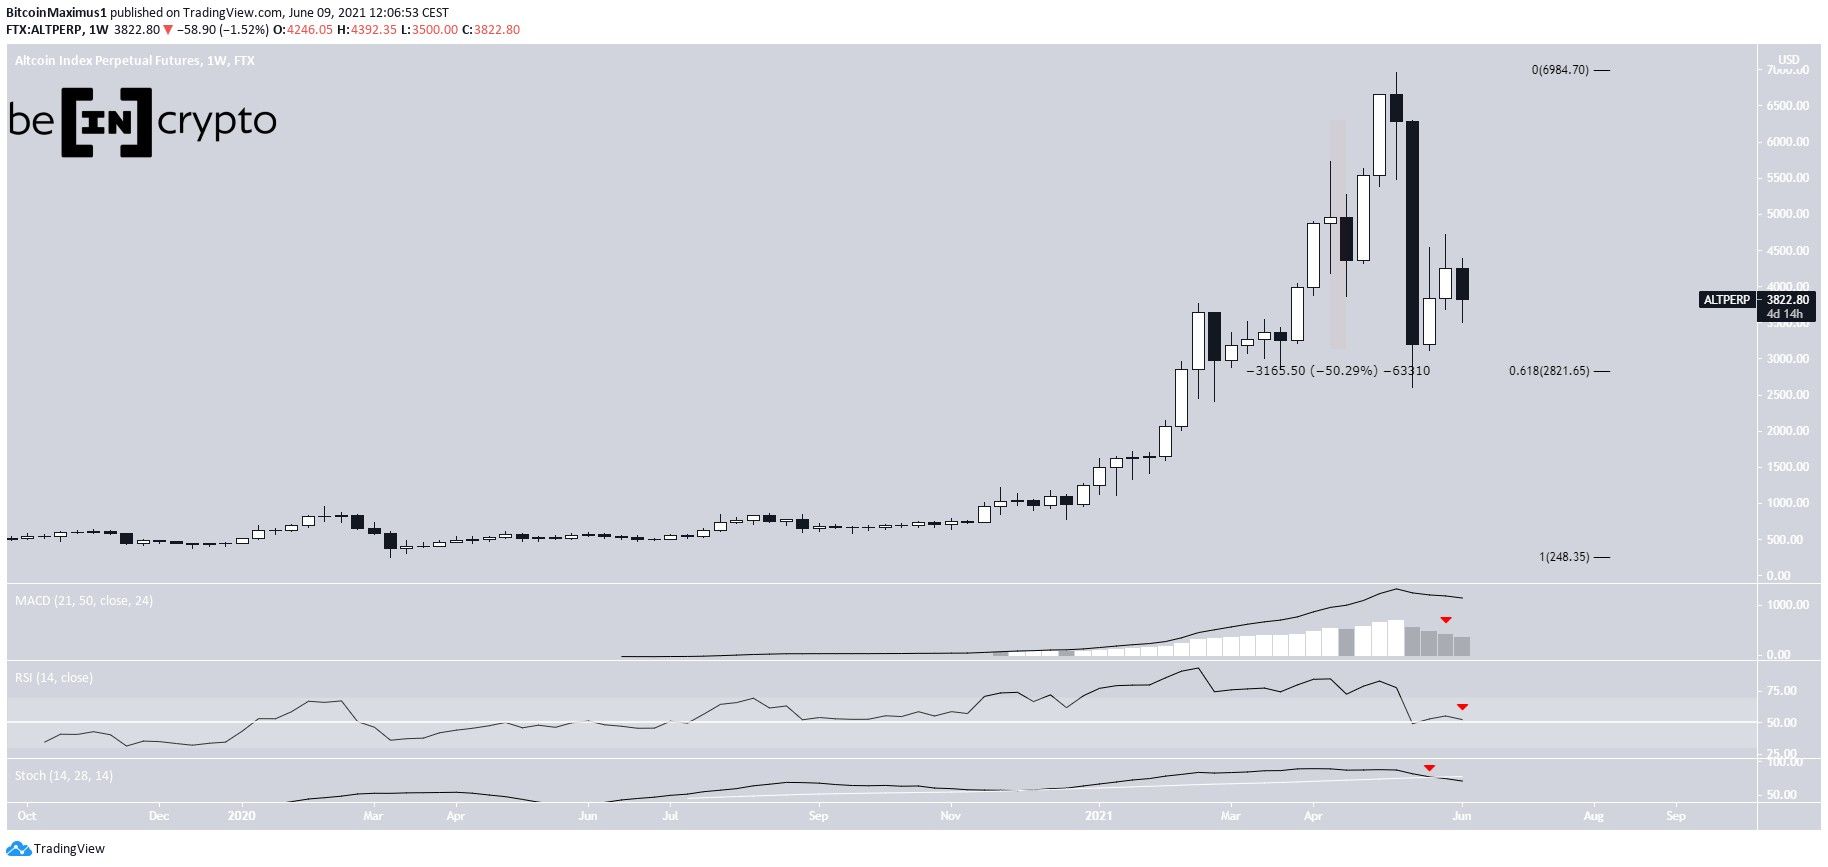
On May 12, the altcoin index reached an all-time high of $6965. However, it began to decrease shortly afterwards.
The rate of decrease was especially sharp during the week of May 17-24, in which ALTPERP fell by 50%.
This took it to the 0.618 Fib retracement support at 2820, where it initiated a bounce.
However, technical indicators are still bearish. The MACD has given a bearish reversal signal and the Stochastic oscillator has made a bearish cross (red icon).
The RSI is right at the 50 line, and could soon decrease below it.
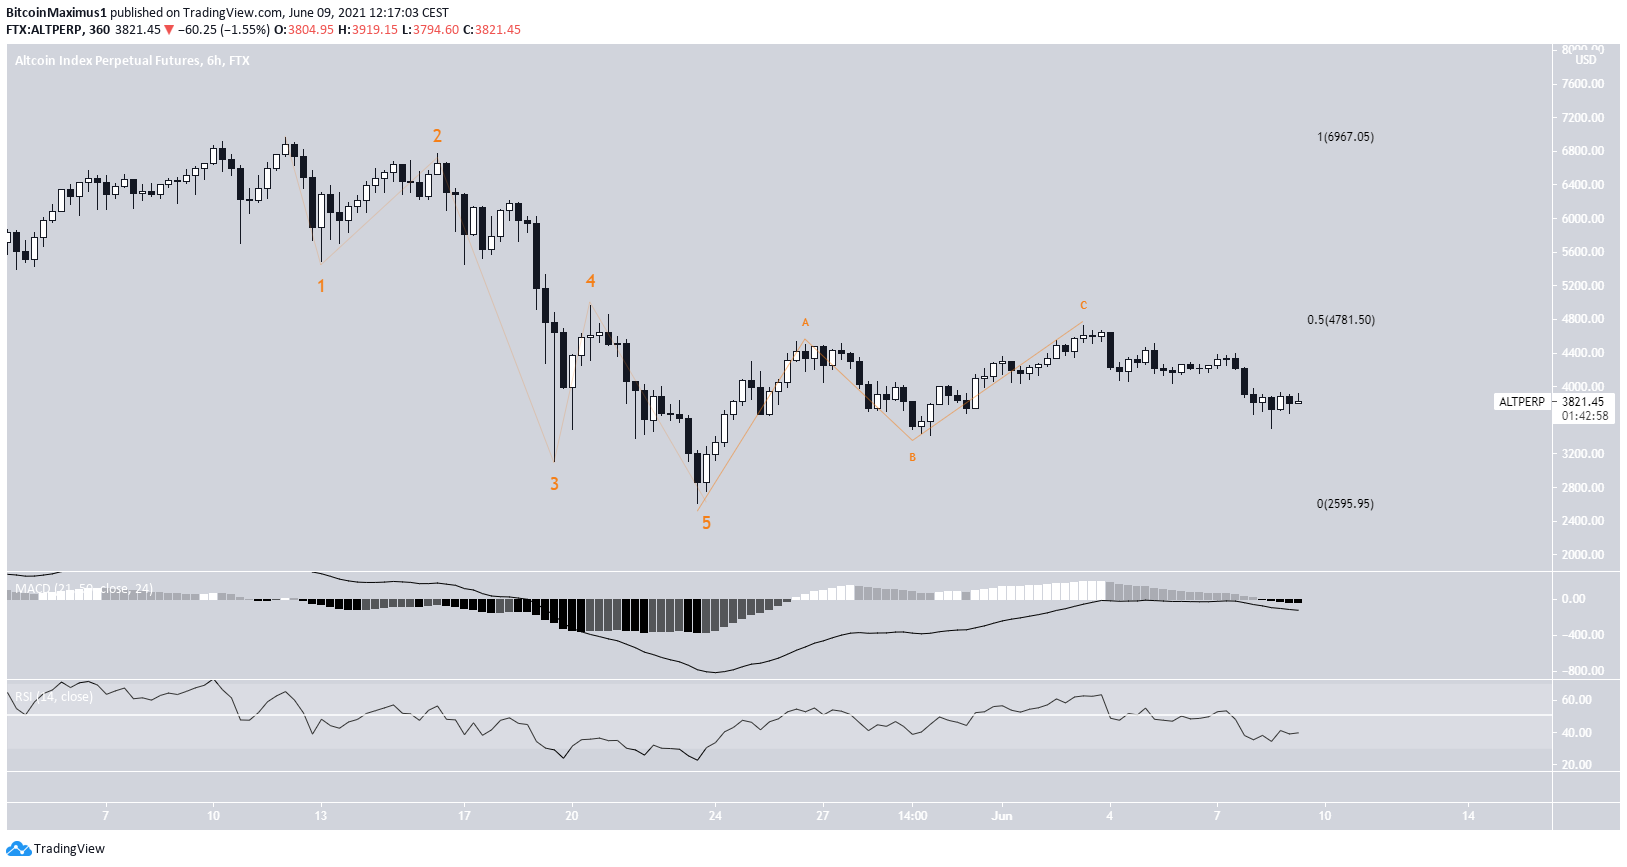
The shorter-term six-hour chart does nothing to dissuade from the bearish outlook.
Despite the ongoing bounce, the index has been rejected by the 0.5 Fib retracement resistance area of $4781 on June 3. It has been decreasing since. Furthermore, the MACD & RSI are both moving downwards.
Finally, the downward movement since the aforementioned all-time high has five completed waves, while the ensuing bounce is a three wave structure.
Therefore, it is likely that the trend is still bearish and new lows will eventually follow.
Highlights
- Long-term indicators are bearish.
- There is support and resistance at $2820 and $4780.
DeFi Index
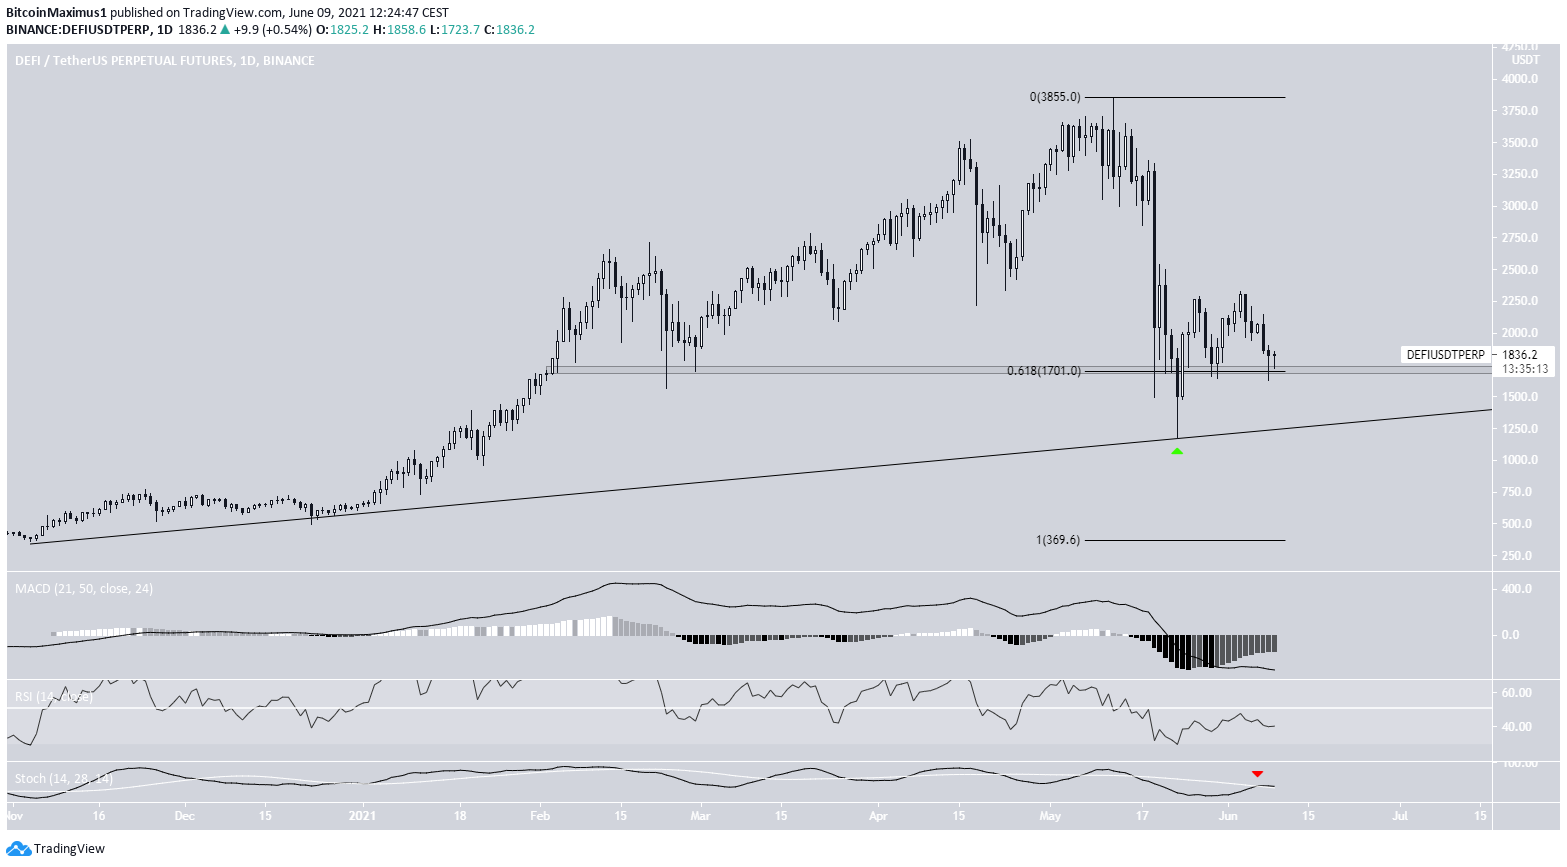
Similarly to the altcoin index, the DeFi index also reached an all-time high on May 12 and has been moving downwards since.
The decrease culminated with a low of $1174 on May 23 (green icon) after which a significant bounce followed. DEFIPERP reclaimed the $1700 area afterwards, which is the 0.618 Fib retracement support level.
It is currently in the process of validating it as support once more.
Despite this, technical indicators are still bearish. The Stochastic oscillator has made a bearish cross (red icon) and the RSI is below 50.
If a breakdown from the $1700 area occurs, the long-term support line would be found at $1300.
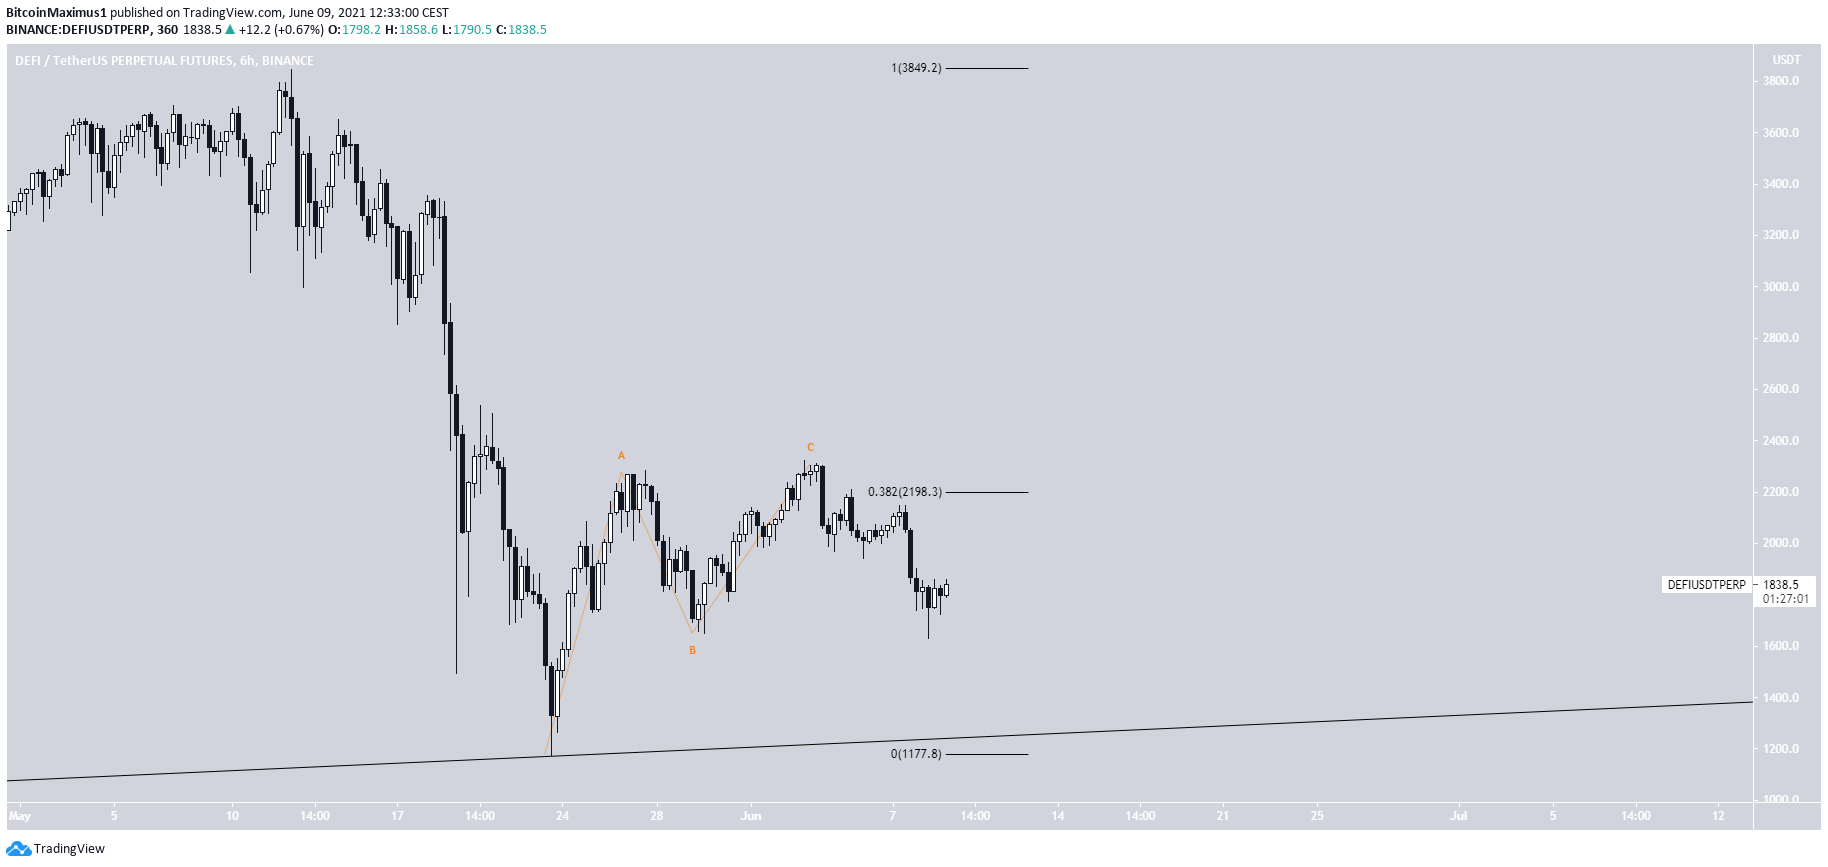
Not unlike the altcoin index, the ongoing bounce is a three wave structure and has been rejected by the 0.382 Fib retracement resistance level.
Highlights
- The DeFi index is following a long-term ascending support line.
- There is support at $1700.
Total Market Cap
The cryptocurrency total market cap an all-time high of $2.57 Trillion on May 12. The ensuing downward movement has been sharp, amounting to 54%.
This caused a bounce at the $1.33 Trillion support area, which is the 0.5 Fib retracement level of the entire upward movement. However, the bounce has been weak so far.
Technical indicators are providing mixed signs. While there is hidden bullish divergence in the RSI, the MACD is falling and the Stochastic oscillator has made a bearish cross.
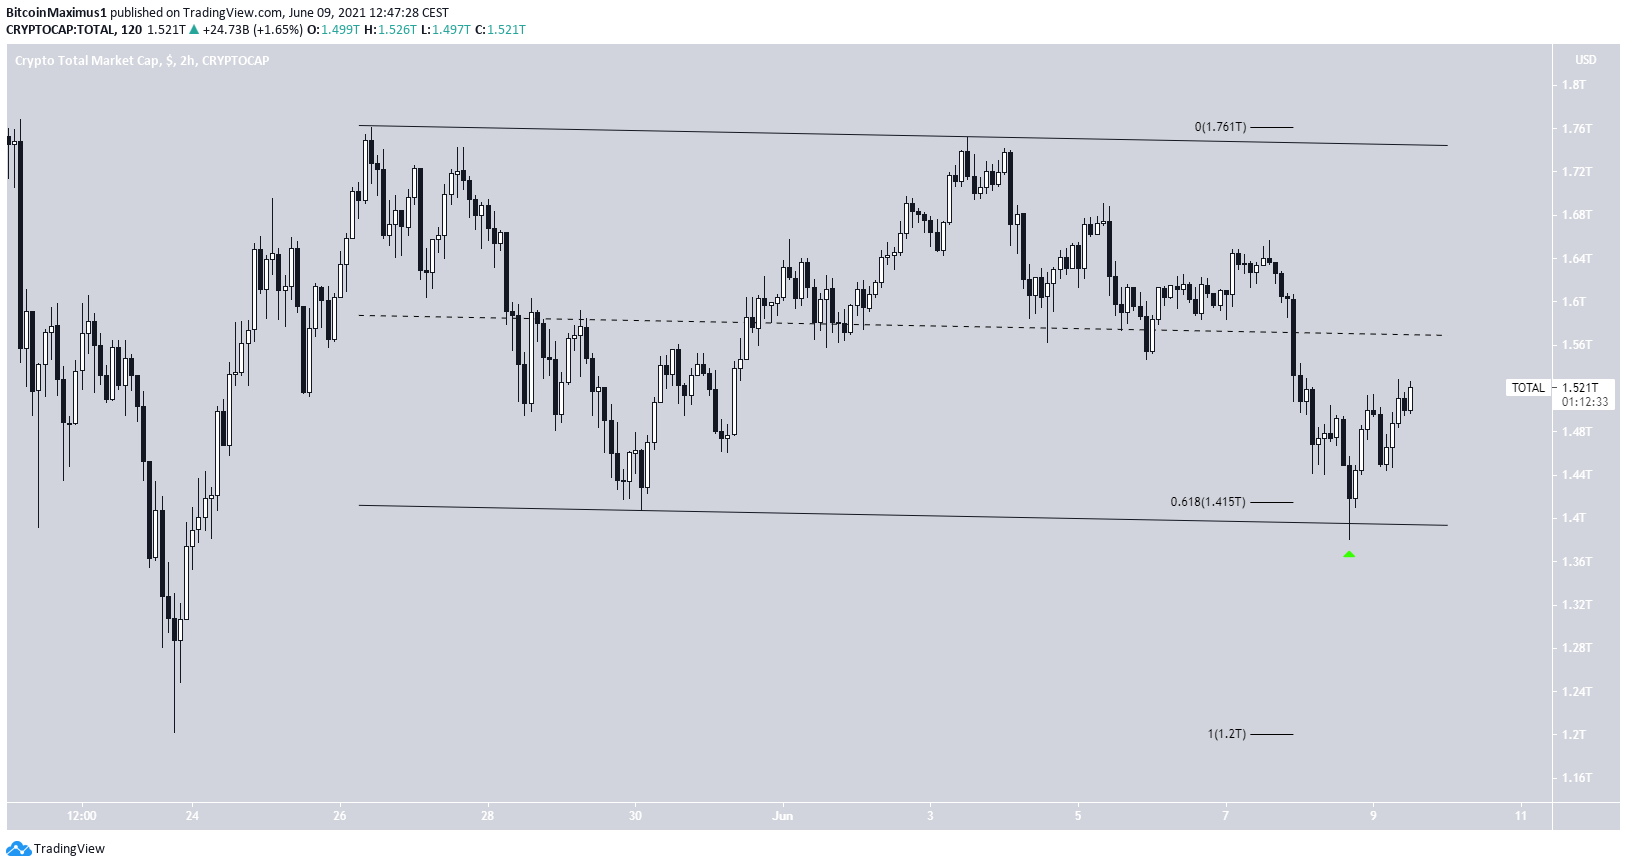
The shorter-term two-hour chart shows that CRYPTOCAP could be trading inside a descending parallel channel. This often contains a corrective structure.
Yesterday, it bounced at the support line of the channel and the 0.618 Fib retracement support level.
Whether it breaks down from this channel will go a long way in determining the direction of the future movement.
Highlights
- CRYPTOCAP is trading inside a short-term descending parallel channel
- There is support at $1.33 Trillion.
For BeInCrypto’s latest bitcoin (BTC) analysis, click here.
