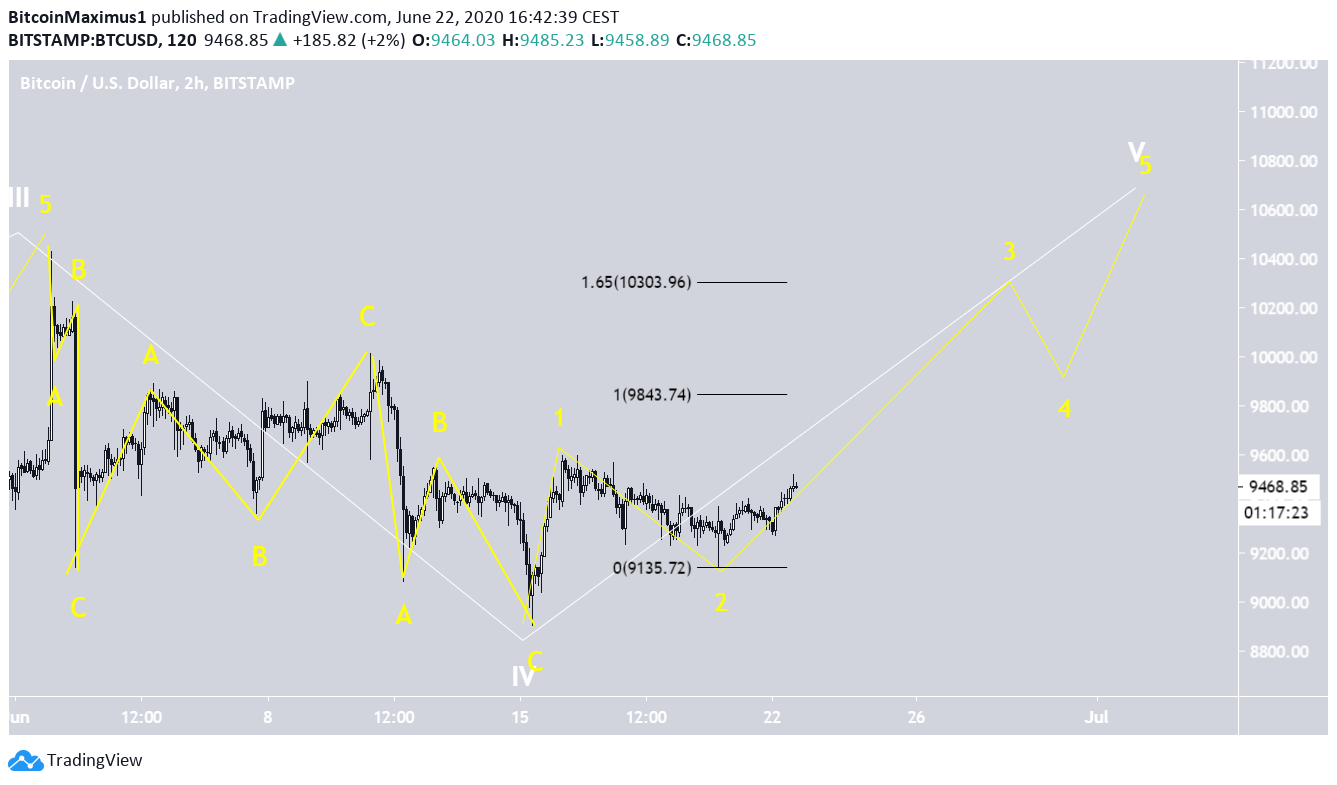
The Bitcoin price has been decreasing since June 1, but today it showed signs of a reversal by breaking out from a short-term descending resistance line. It is possible that this move takes the price all the way to $10,000.
In our previous article, we discussed three possible Elliott wave patterns. Two of these have been invalidated, so we will look at the one possibility that has not been invalidated and a new one that is made possible by the recent movement.
Bitcoin B-Wave
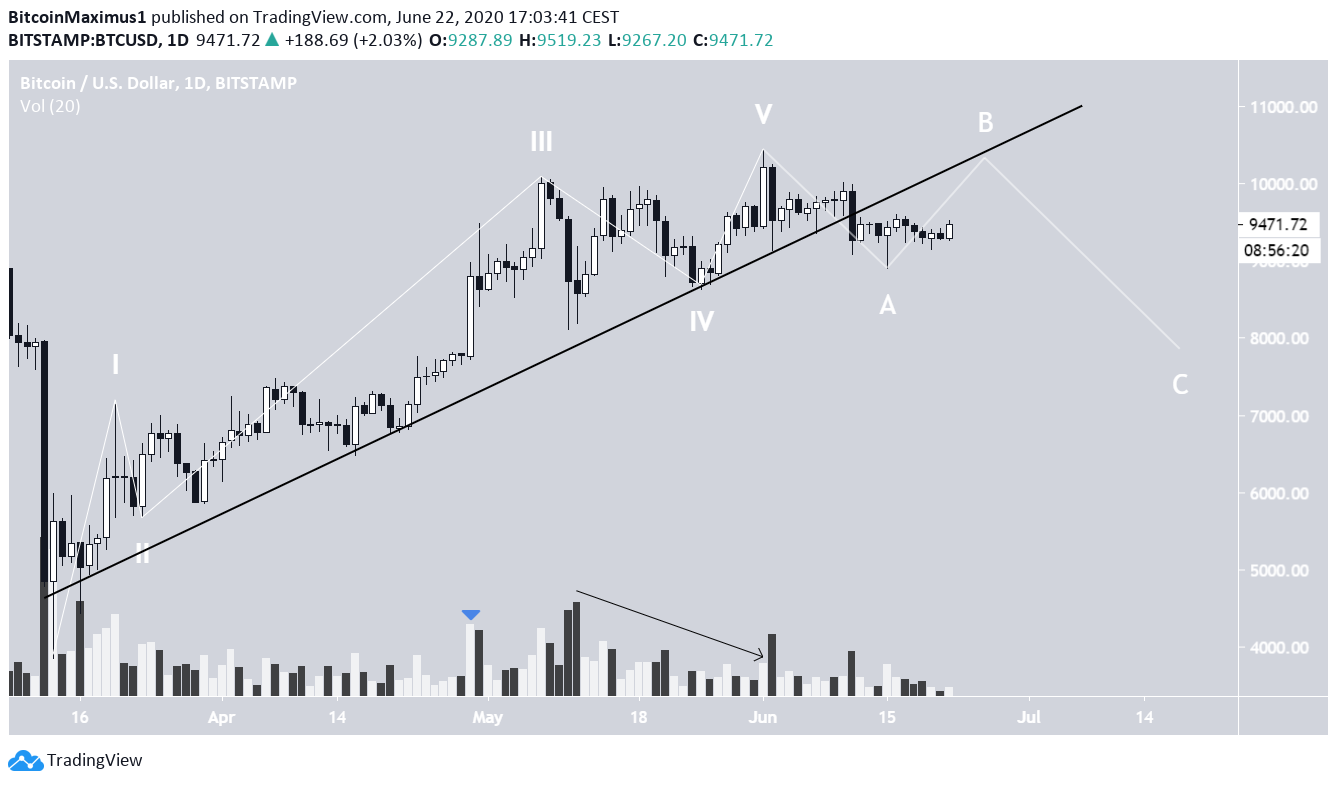
One of the possibilities that we analyzed is that the price has finished a five-wave Elliott formation on June 1. Afterward, it broke down from the long-term ascending support line during the A wave. Currently, it is in the B-wave, which could go towards $10,000 in order to validate the support line BTC just broke down from. Besides the breakdown from the ascending support line, the volume profile is also consistent with this wave count, since it was highest on wave 3 and has been decreasing since.

Fifth Wave
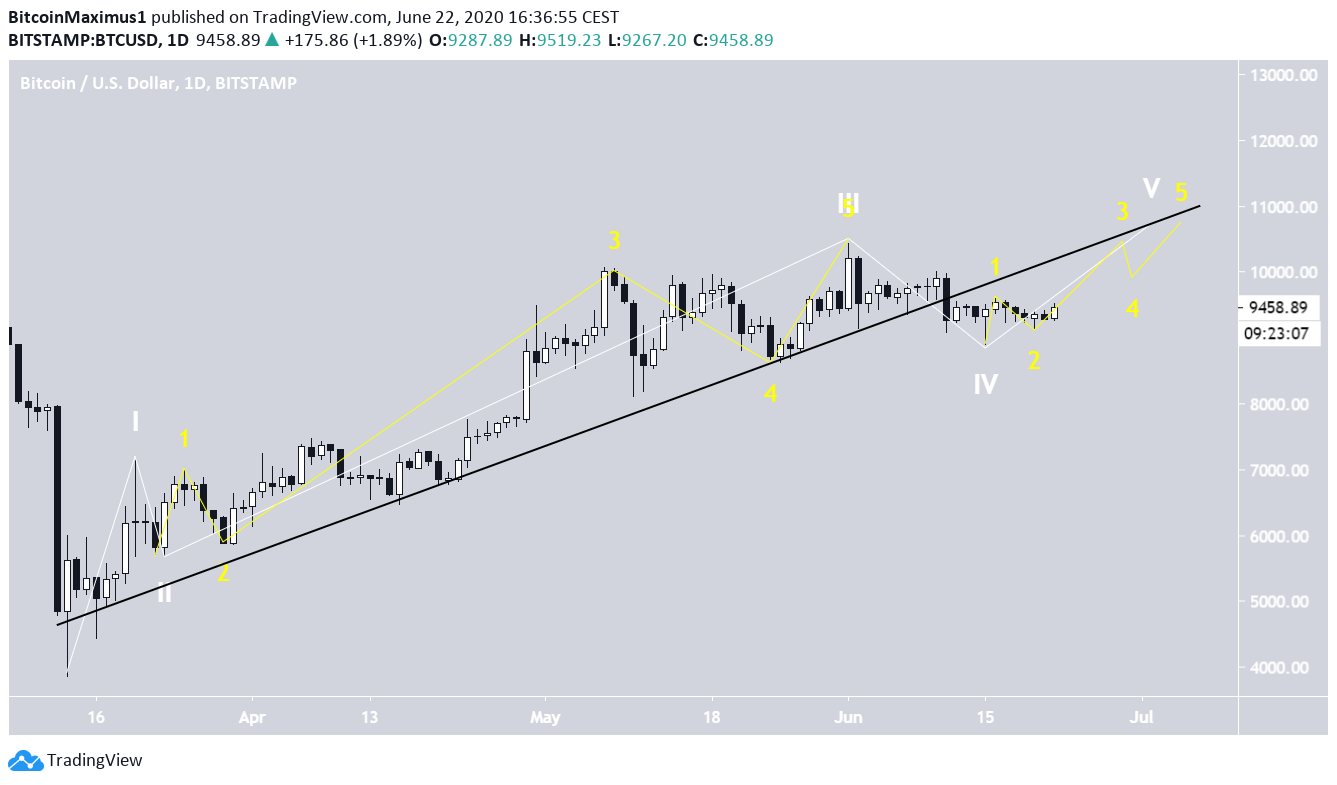
Another possibility is that the price has just begun its fifth wave, also measured from the March 13 bottom. In this case, what was previously wave A of an A-B-C correction, is instead wave 4 of the impulsive upward move. In this wave count, wave 3 is extended until the June 1 high, with the sub-waves being shown in yellow. What does not fit very well with this wave count is the fact that the price has already broken down from the ascending support line that had been in place since March 13.

Top crypto platforms in the US
Disclaimer
In line with the Trust Project guidelines, this price analysis article is for informational purposes only and should not be considered financial or investment advice. BeInCrypto is committed to accurate, unbiased reporting, but market conditions are subject to change without notice. Always conduct your own research and consult with a professional before making any financial decisions. Please note that our Terms and Conditions, Privacy Policy, and Disclaimers have been updated.

Valdrin Tahiri
Valdrin discovered cryptocurrencies while he was getting his MSc in Financial Markets from the Barcelona School of Economics. Shortly after graduating, he began writing for several different cryptocurrency related websites as a freelancer before eventually taking on the role of BeInCrypto's Senior Analyst.
(I do not have a discord and will not contact you first there. Beware of scammers)
READ FULL BIO
Sponsored
Sponsored

