


The Bitcoin price has been decreasing rapidly since March 7. This has caused the price to decrease below numerous important moving averages (MAs). The rate of the decrease has also caused the aforementioned MAs to generate bearish crosses.
Bitcoin (BTC) Price Highlights
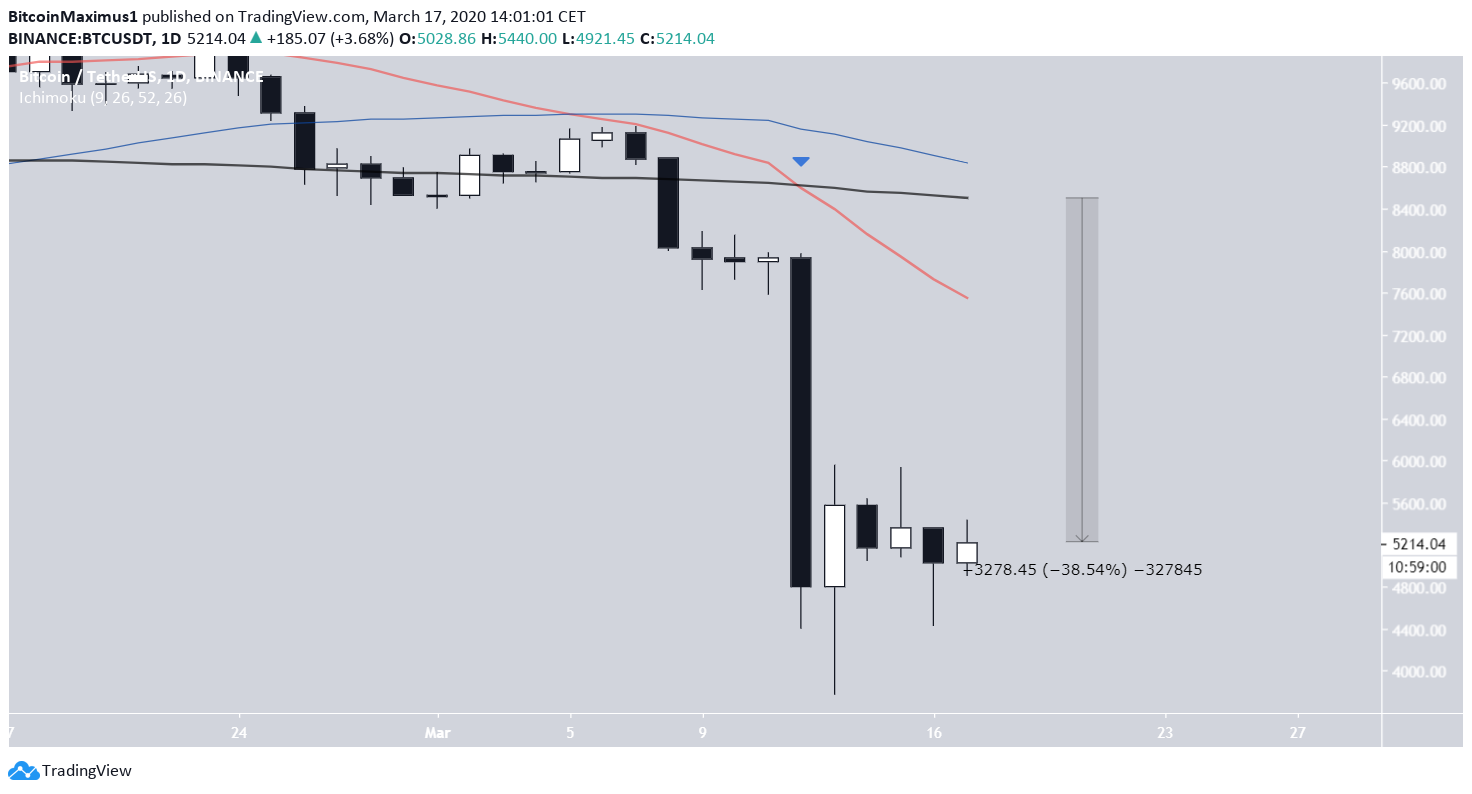
- The BTC price is trading below all significant daily moving averages (MAs).
- The current price is 38.5% below its 200-day MA.
- The 20- and 200-day MAs have made a bearish cross.
Crypto trader @CryptoMakayla posted a Bitcoin chart, stating that the price movement looks bearish as a result of numerous bearish crosses from different moving averages (MAs).
Imagine thinking bitcoin looks great pic.twitter.com/07yWRedKW9
— wen tao ten thou (@wentaotenthou) March 17, 2020
What do these bearish crosses mean for the future price movement? How has the BTC price reacted in previous times when this happened? Continue reading below if you want to find out.
Current Price Movement
The MAs shown in the tweet are short, medium and long-term ones. For our analysis, we will use the 20- (red), 50-(blue) and 200-day MAs. The 20- and 200-day ones made a bearish cross on March 12. The 50- and 200-day ones have yet to do so.
The current price is 38.5% below its 200-day MA.
We want to find occurrences in which the bearish crosses between these moving averages occurred close to each other. While the short-term MA will always change direction faster than the longer-term one, a very rapid decrease can cause the short/medium-term ones to almost converge with each other.
Previous Occurrences
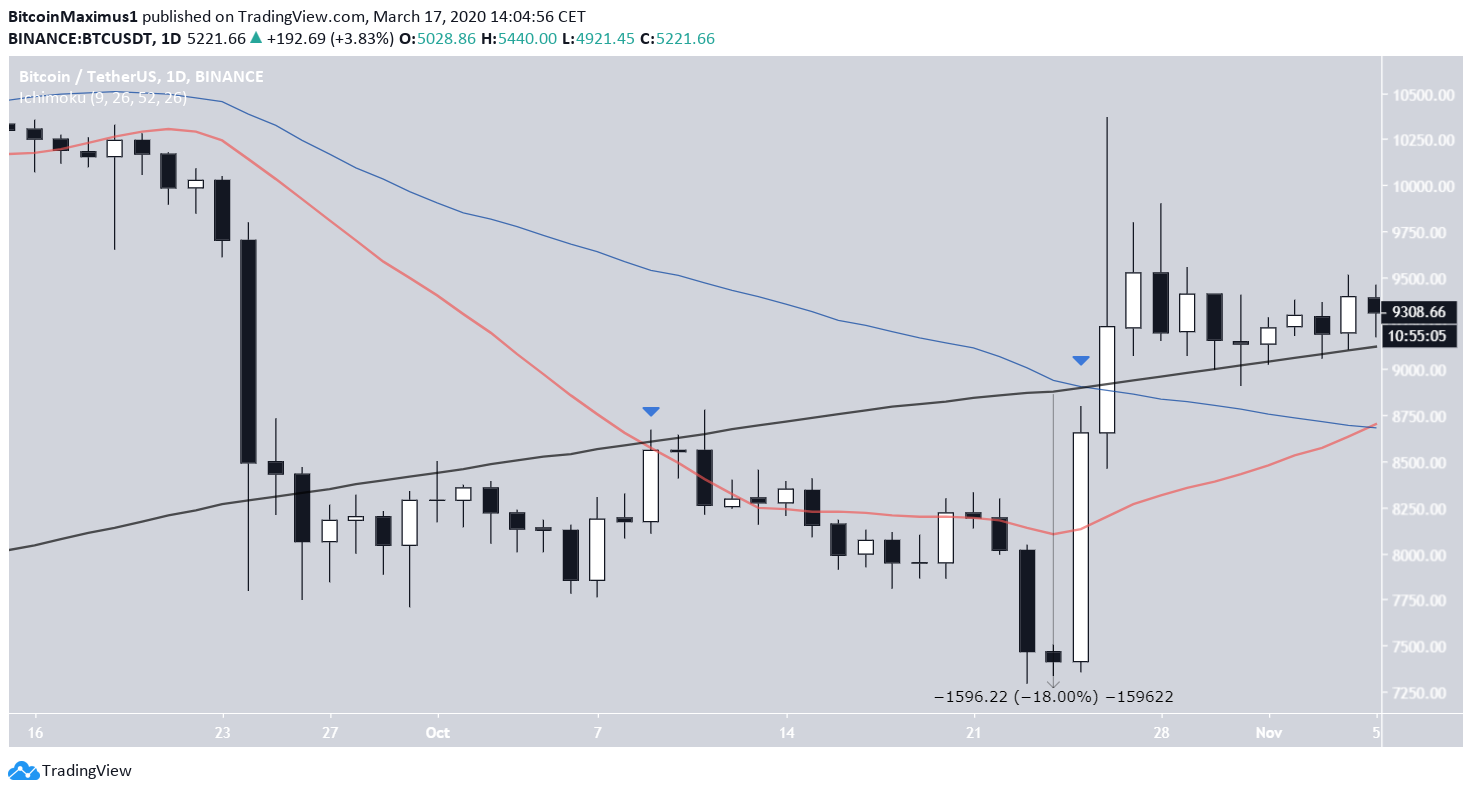
A similar occurrence transpired on Oct. 24, 2019. The 20- and 200-day MAs made a bearish cross on Oct. 9, while the 50-day MA followed suit on Oct. 25.
On Oct. 24, the price was 18% below its 200-day MA.
Interestingly, what followed was a very strong pump that caused the price to move above all these MAs. The difference between these moves, however, is that the 200-day MA was trending upward in October while it is currently trending downwards, indicating the direction of the preceding trend.
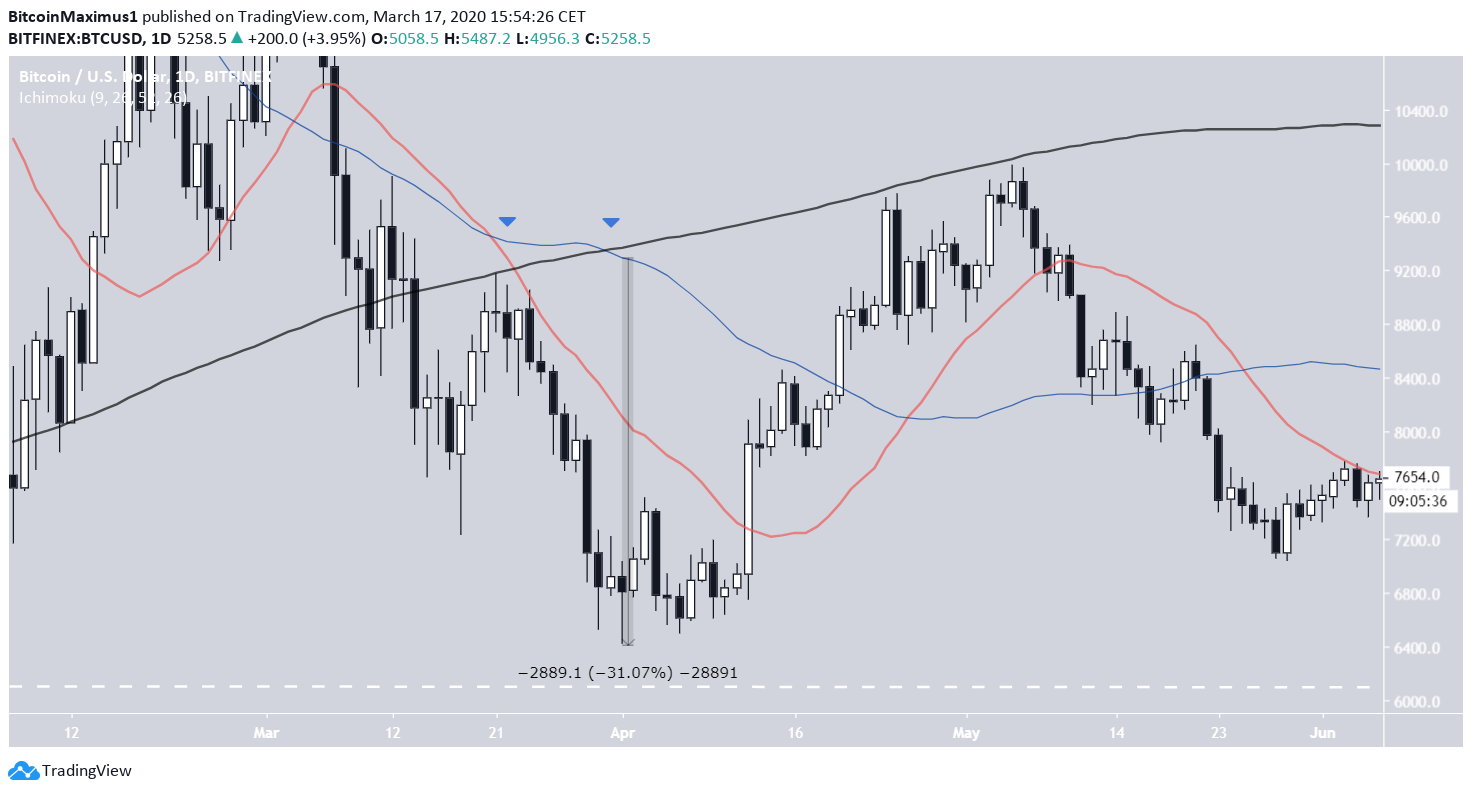
Going further back, a similar relationship of the price and MAs transpired on April 1, 2018. The 20- and 200-day MAs generated a bearish cross on March 19 and the 50-day MA followed suit on March 28.
At the time, the price was 31% below its 200-day MA, very similar to the current movement.
Unlike the current movement, the 200-day MA was trending upward.
To conclude, while the BTC price is trading below numerous MAs that have made bearish crosses, we do not think this is sufficient to determine that the price will head lower. In fact, the previous two times this occurrence transpired, the price rallied afterward in order to validate/move above the 200-day MA.


