
Ripple’s XRP finds itself in a critical situation as the US government commences another shutdown period.
The altcoin’s value plunged sharply during the last two shutdowns, falling 12.8% and 12.45%, respectively, raising concerns among traders about the token’s performance during this current shutdown period.
History Points To Highlights XRP’s Vulnerability During Shutdowns
Based on CoinGecko’s historical data, XRP experienced notable declines during past shutdowns. In 2018, during the brief three-day shutdown from January 20 to 22, XRP’s price plunged from about $1.56 to $1.36, falling by 12.8%.
Similarly, during the 35-day shutdown from December 22, 2018, to January 25, 2019, the longest in US history, the token’s price fell from approximately $0.3623 to $0.3172, logging a 12.45% drop.
The current shutdown comes at a time when broader crypto market sentiment is already weak. XRP has been trading largely sideways over the past week, its price performance muted by falling demand.
This lack of momentum leaves the token vulnerable to further downside should the shutdown drag on.
In addition, six firms—including Grayscale and 21Shares—have filed for spot XRP exchange-traded funds (ETFs). Many of these applications face imminent deadlines next week.
Any slowdown in regulatory processing caused by the shutdown could push back approval timelines, further dampening investor sentiment and potentially triggering renewed selling pressure.
XRP’s Bearish Indicators Hint at History Repeating Itself
Beyond the macro headwinds, XRP’s derivatives market data support this bearish outlook. At press time, its long/short ratio is below one at 0.98.
For token TA and market updates: Want more token insights like this? Sign up for Editor Harsh Notariya’s Daily Crypto Newsletter here.
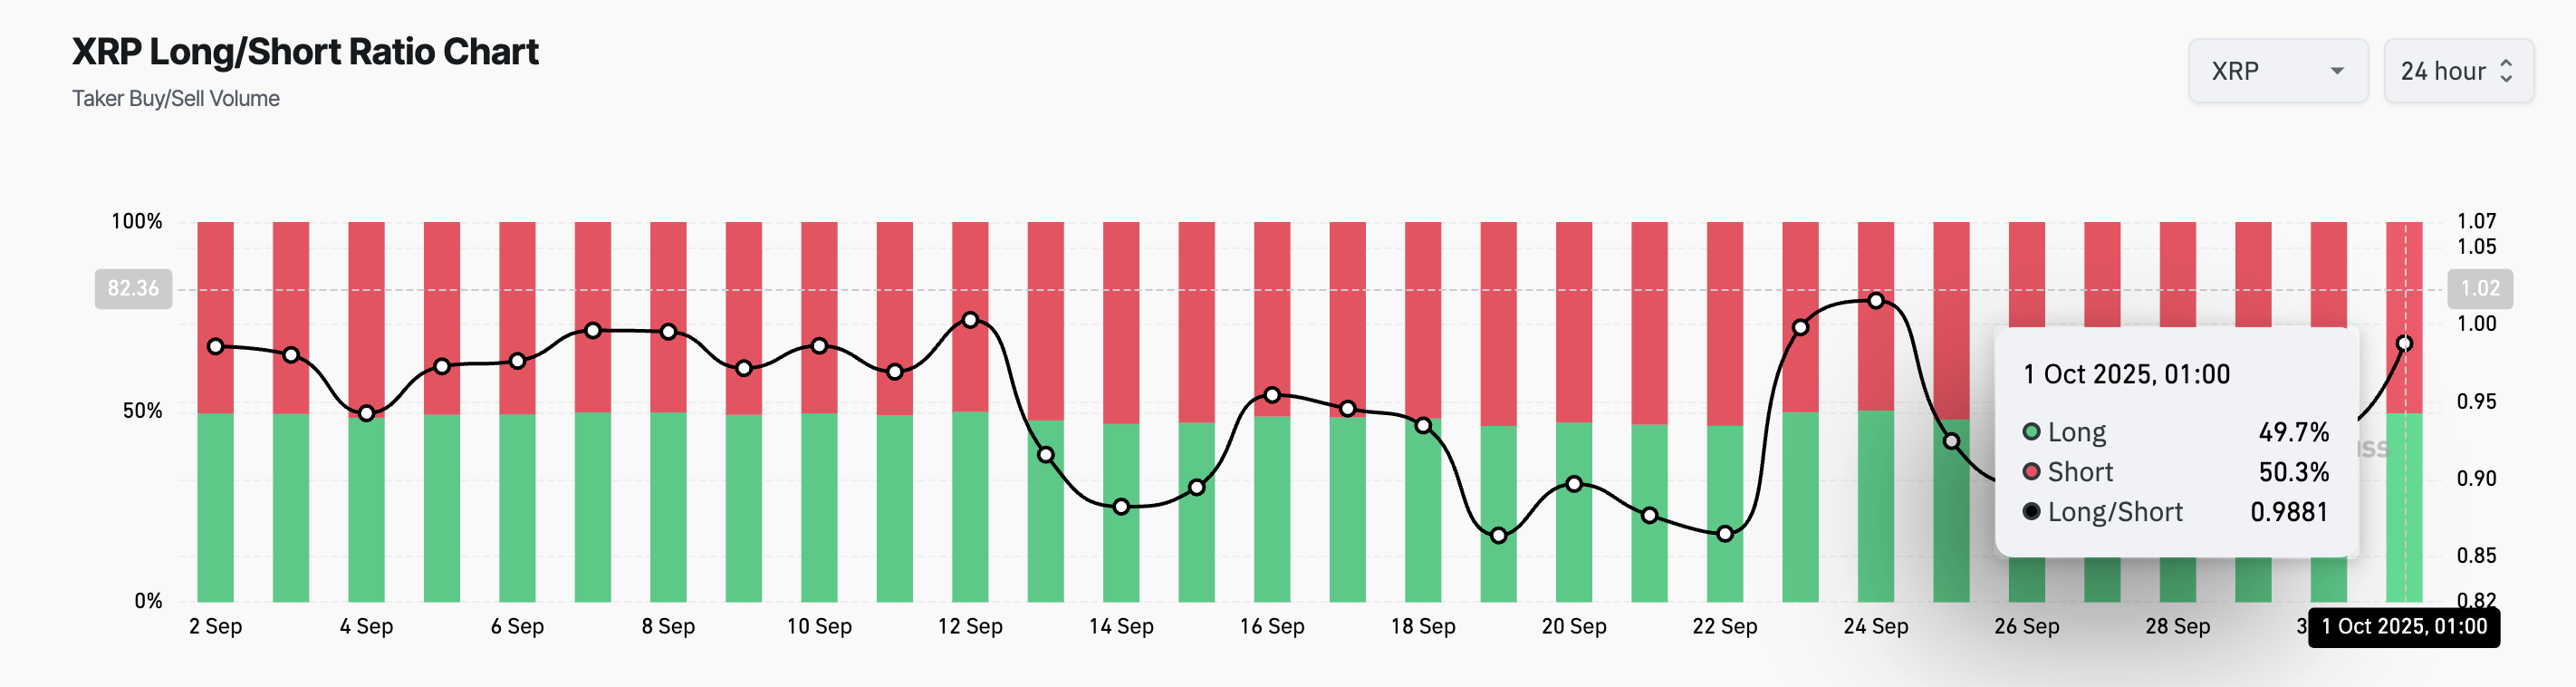
The long/short ratio measures the proportion of long bets to short ones in an asset’s futures market. A ratio above one signals more long positions than short ones. This indicates a bullish sentiment, as most traders expect the asset’s value to rise.
Conversely, as with XRP, a ratio below means there are more short than long positions in the market. This shows that the overriding bias towards the altcoin is negative, putting its price at risk of declines.
Furthermore, on the daily chart, XRP’s Elder-Ray Index continues to show persistent negative readings, indicating weakening bullish momentum. At press time, this momentum indicator is at -0.0103.
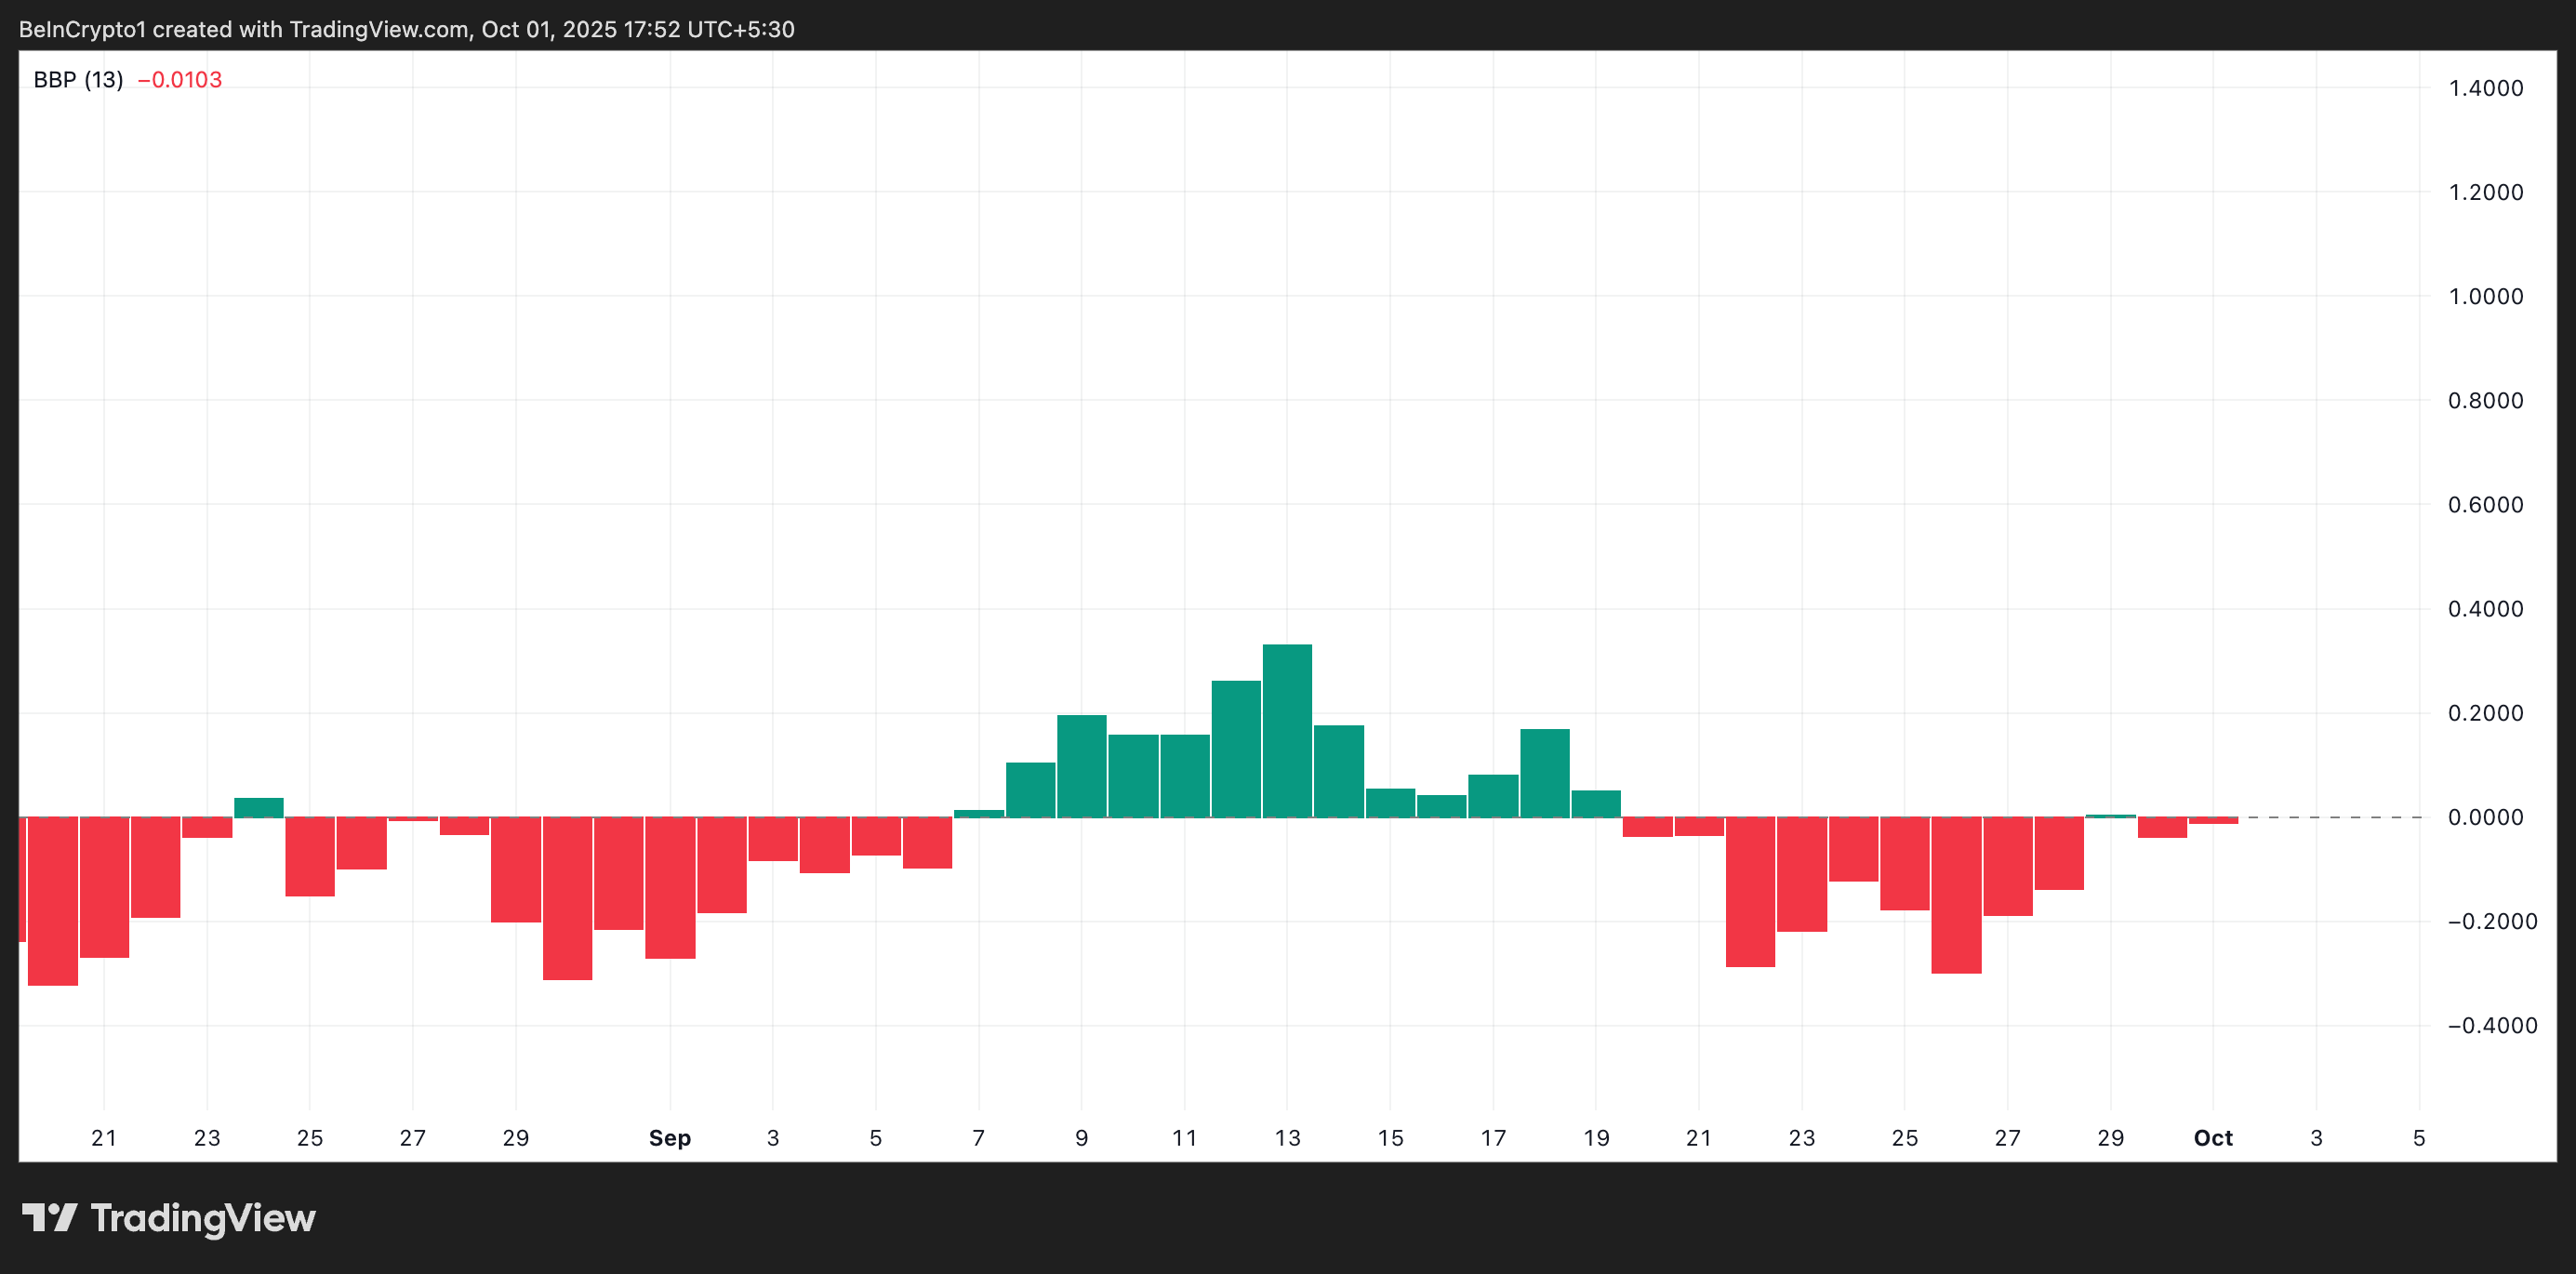
The Elder-Ray Index indicator measures the strength of bulls and bears in the market by comparing buying pressure (Bull Power) and selling pressure (Bear Power).
When the value is positive, the market is experiencing more buying pressure than selling, suggesting a potential uptrend.
On the other hand, when its value is negative like this, the bears have the upper hand, and token distribution is strong.
XRP Could Slip to $2.57—Or Breakout Toward $3.28
Without renewed buying interest, XRP could see additional price pressure in the coming sessions. In this scenario, it could breach its immediate support at $2.7845 and tumble toward $2.5777.
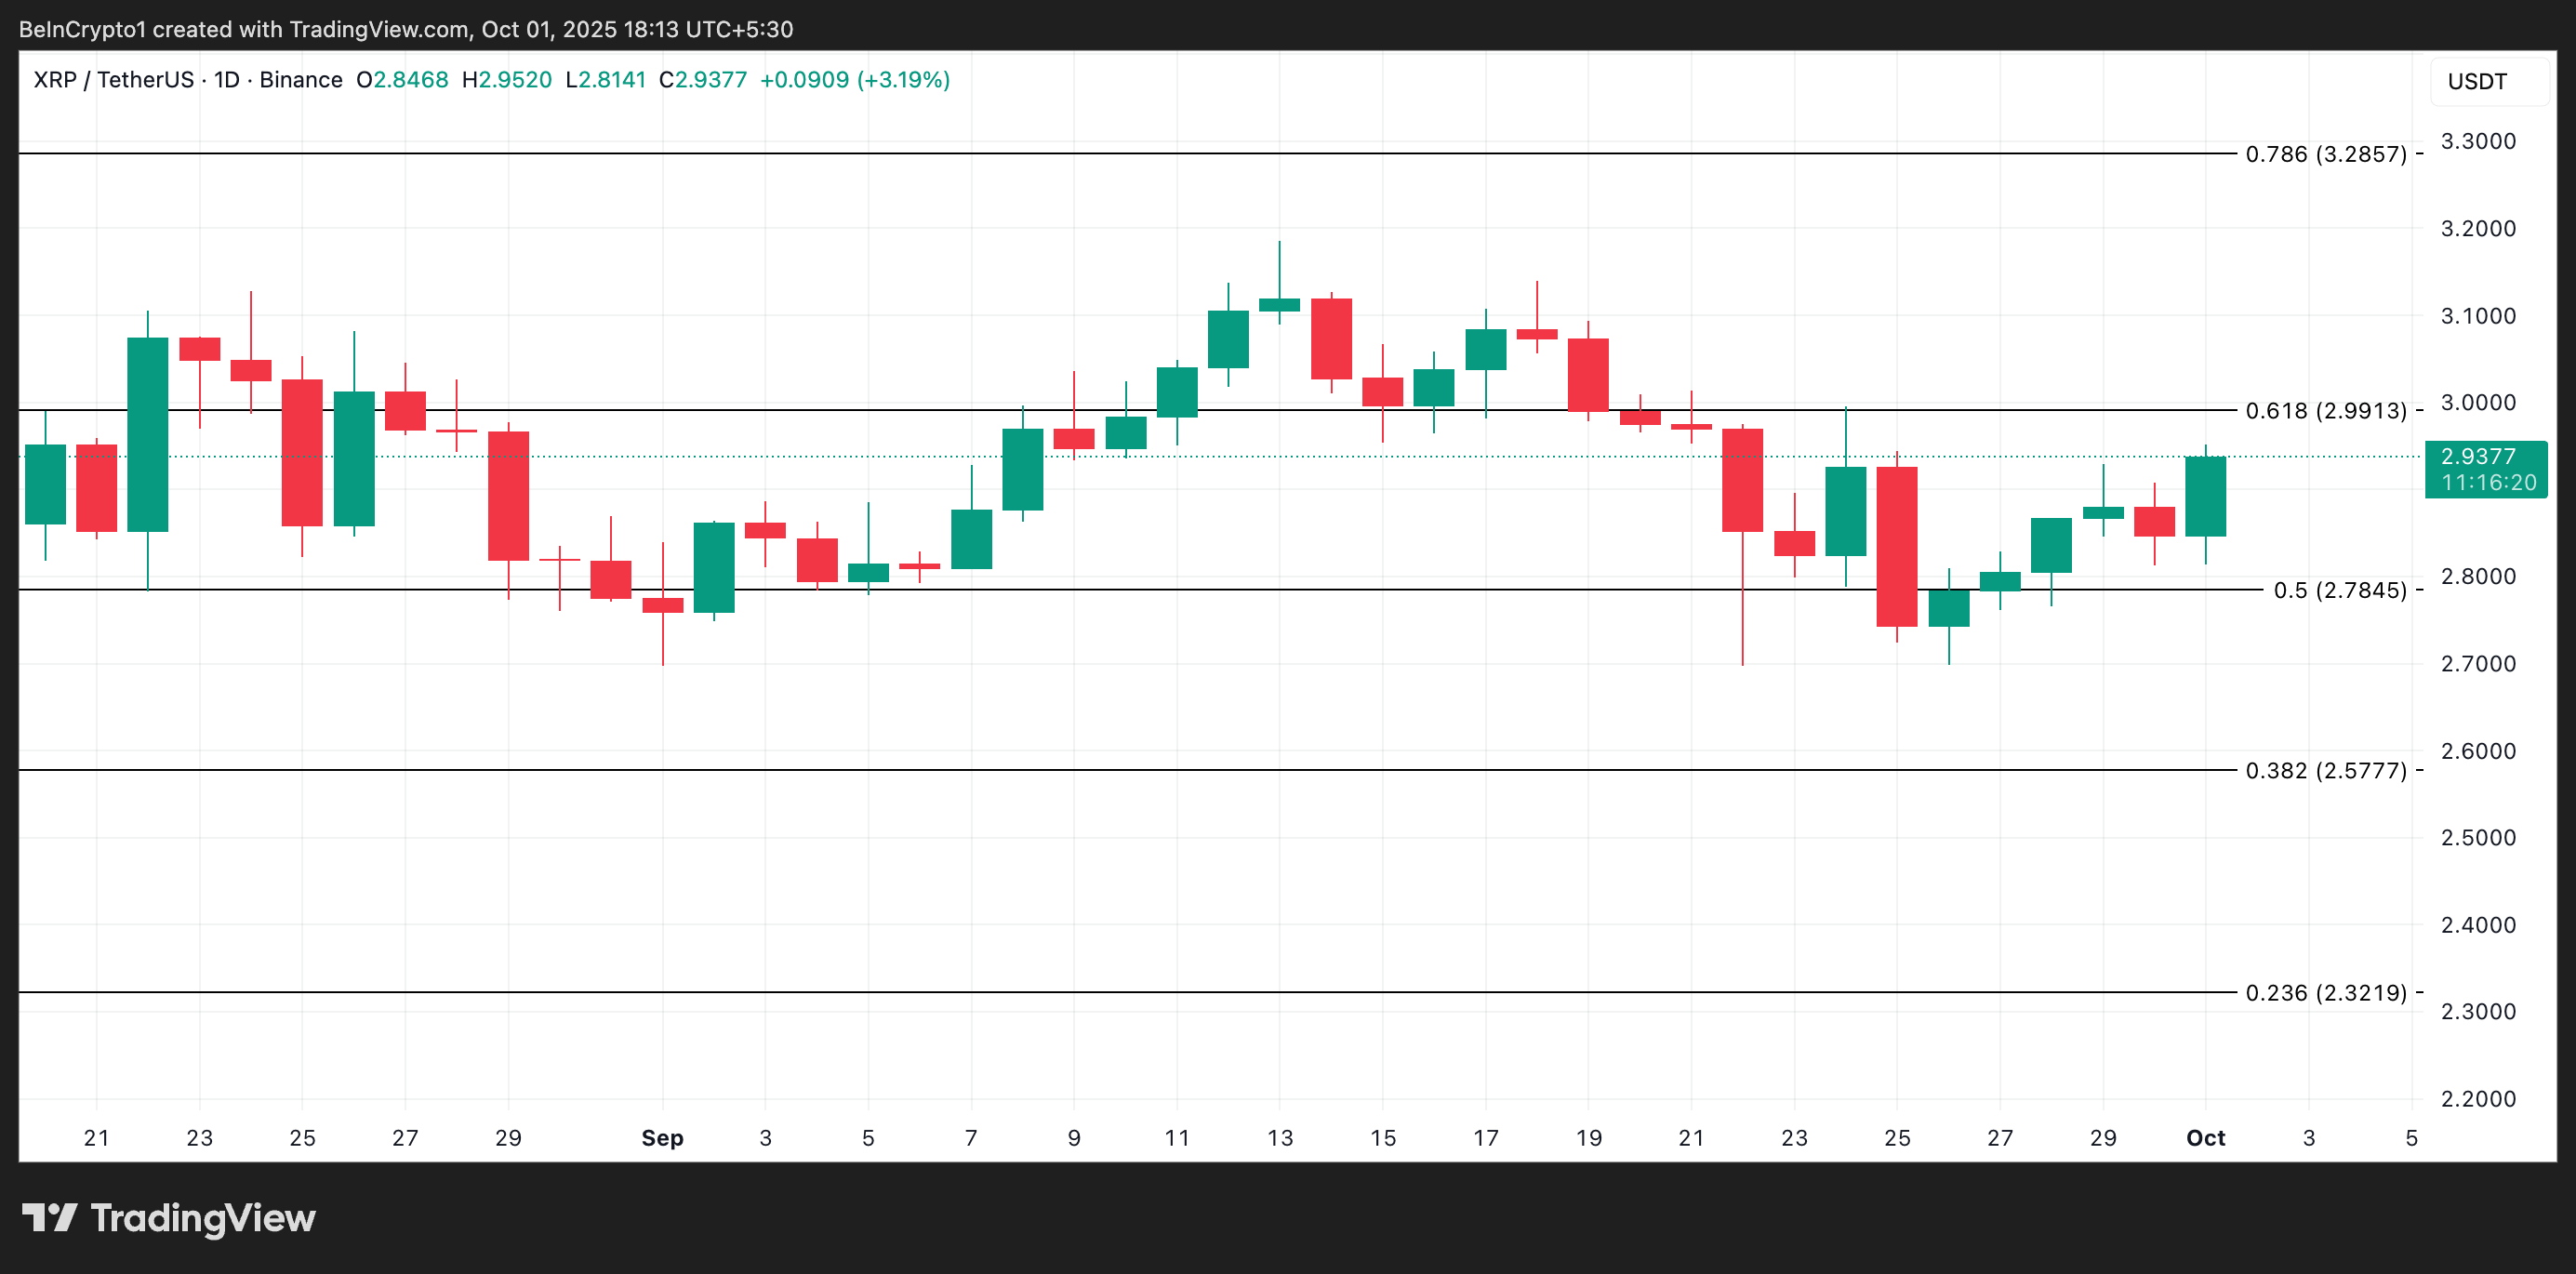
On the flip side, if demand returns to the market, it could break above the price wall at $2.99 and climb to $3.28.
